Spectral Flow Cytometry vs. Conventional Stem Cell Analysis: A High-Dimensional Guide for Researchers
This article provides a comprehensive comparison of spectral and conventional flow cytometry for stem cell research and therapy development.
Spectral Flow Cytometry vs. Conventional Stem Cell Analysis: A High-Dimensional Guide for Researchers
Abstract
This article provides a comprehensive comparison of spectral and conventional flow cytometry for stem cell research and therapy development. It covers the foundational principles, technical methodologies, and practical applications of both technologies, with a focus on high-dimensional analysis of stem cell populations, including hematopoietic, mesenchymal, and induced pluripotent stem cells (iPSCs). Aimed at researchers, scientists, and drug development professionals, the content explores troubleshooting strategies, optimization techniques, and presents validation data to guide technology selection for specific research and clinical goals, from deep immunophenotyping to minimal residual disease (MRD) detection.
From Filters to Full Spectrum: Understanding the Core Technologies
The Evolution of Flow Cytometry in Stem Cell Research
Stem cell research represents one of the most dynamic frontiers in biomedical science, driving advances in regenerative medicine, disease modeling, and drug discovery. The unique properties of stem cells—including self-renewal, differentiation capacity, and heterogeneity—demand analytical tools capable of detailed single-cell characterization. Flow cytometry has emerged as an indispensable technology in this field, enabling researchers to analyze and isolate distinct stem cell populations based on surface markers, intracellular proteins, and functional characteristics. As research questions have grown more complex, the technological evolution from conventional flow cytometry to spectral flow cytometry has fundamentally transformed our analytical capabilities, allowing for unprecedented depth in stem cell characterization and opening new avenues for therapeutic development [1] [2].
This evolution addresses critical challenges in stem cell research, including the need to:
- Identify rare stem cell populations within heterogeneous samples
- Simultaneously monitor multiple signaling pathways governing self-renewal and differentiation
- Analyze complex intracellular and surface marker combinations with minimal sample material
- Achieve high-resolution discrimination between closely related cellular states
The shift from conventional to spectral flow cytometry represents more than just incremental improvement—it constitutes a fundamental reimagining of how we capture, process, and interpret fluorescent signals at the single-cell level, with profound implications for stem cell research and its clinical translation.
Technical Comparison: Conventional versus Spectral Flow Cytometry
Fundamental Detection Mechanisms
The primary distinction between conventional and spectral flow cytometry lies in their approach to fluorescence detection and signal processing:
Conventional Flow Cytometry employs a system of dichroic mirrors and bandpass filters to direct specific wavelength ranges to discrete detectors (typically photomultiplier tubes). This "one detector–one fluorophore" approach requires careful compensation to correct for spectral overlap between fluorochromes, which introduces analytical complexity and can limit panel size [3] [4]. Emission spectra are only partially captured, with each detector measuring a narrow bandwidth (typically 20-50 nm) approximating the peak emission of target fluorophores [5].
Spectral Flow Cytometry utilizes prisms or diffraction gratings to scatter the full emission spectrum across an array of detectors (typically 32-64 channels). Instead of measuring discrete wavelengths, the complete emission signature (400-800 nm) is captured for each cell, creating a unique "spectral fingerprint" for every fluorochrome [3] [2]. Advanced algorithms then unmix these composite signals using reference spectra from single-stained controls, simultaneously resolving 40 or more parameters without traditional compensation [5] [6].
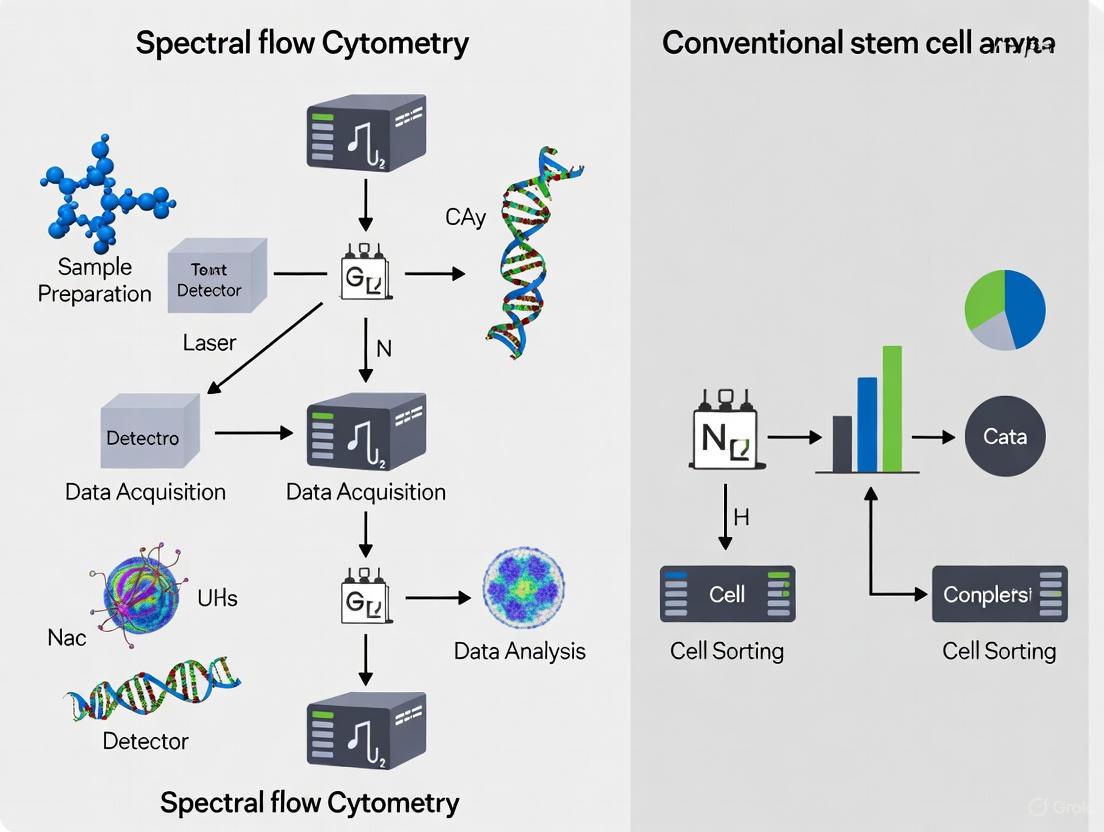
The following diagram illustrates the fundamental differences in the optical detection systems of conventional versus spectral flow cytometers:
Performance Specifications and Capabilities
The technological differences between conventional and spectral flow cytometry translate into distinct performance characteristics that directly impact their utility for stem cell research:
Table 1: Technical Comparison of Conventional and Spectral Flow Cytometry
| Parameter | Conventional Flow Cytometry | Spectral Flow Cytometry |
|---|---|---|
| Maximum Parameters | Typically 15-20 colors [5] [4] | Up to 40+ colors simultaneously [3] [2] |
| Detection System | Discrete photomultiplier tubes with optical filters [5] | Array detectors (32-64 channels) with prism/grating [5] |
| Signal Processing | Compensation (spillover subtraction) [4] | Spectral unmixing algorithms [5] [7] |
| Autofluorescence Handling | Limited correction capabilities | Active extraction and separation [2] [6] |
| Panel Design Flexibility | Constrained by filter configuration and spillover [3] | High flexibility with similarity index guidance [7] |
| Resolution of Similar Fluorophores | Challenging, requires careful panel design | Enhanced through full spectrum analysis [6] |
| Sample Consumption | Higher for equivalent data (multiple tubes) | Reduced (comprehensive data in single tube) [2] |
| Data Richness | Discrete parameters | High-dimensional with spectral signatures [3] |
Table 2: Representative Instrument Configurations in Spectral Flow Cytometry
| Instrument Model | Laser Configuration | Detection Channels | Maximum Parameters | Key Applications in Stem Cell Research |
|---|---|---|---|---|
| Cytek Aurora | 5 lasers (355, 405, 488, 561, 640 nm) [5] | 64 fluorescent channels [5] | Up to 40 colors [5] | High-dimensional immunophenotyping, rare population detection |
| Sony ID7000 | Up to 7 lasers [5] | 184 fluorescent channels [5] | 44+ colors [5] | Comprehensive stem cell profiling, signaling studies |
| BD FACSymphony A5 SE | 5 lasers (355, 405, 488, 561, 637 nm) [5] | 48 fluorescent channels [5] | Up to 40 colors [5] | CAR-T cell monitoring, translational research |
| Agilent NovoCyte Opteon | Up to 5 lasers [5] | 73 fluorescent channels [5] | Up to 45 colors [5] | Drug screening, functional assays |
Experimental Applications in Stem Cell Research
Methodologies for Stem Cell Characterization
The application of spectral flow cytometry in stem cell research requires specialized experimental protocols designed to leverage its high-parameter capabilities while addressing the unique characteristics of stem cell samples:
Sample Preparation and Processing Stem cells require gentle processing to maintain viability and marker expression. For adherent cultures (e.g., mesenchymal stem cells, induced pluripotent stem cells), enzymatic dissociation using trypsin-EDTA or accutase is recommended, followed by DNase treatment to minimize clumping [8]. Mechanical dissociation should be avoided for delicate stem cell populations. For tissue-derived stem cells (e.g., hematopoietic stem cells from bone marrow), enzymatic digestion protocols must be optimized for specific tissue types, with temperature carefully controlled (4-37°C depending on antigen stability) [8]. Sample filtration through nylon mesh (70μm) is critical to ensure single-cell suspensions and prevent instrument clogging.
Viability Staining and Dead Cell Exclusion Incorporating viability dyes (e.g., fixable viability stains) is essential for accurate stem cell analysis, as dead cells nonspecifically bind antibodies and generate autofluorescence. Spectral flow cytometry enables autofluorescence extraction, significantly improving resolution of dim markers often expressed on stem cells [7] [6]. This is particularly valuable for intracellular staining protocols where fixation/permeabilization can increase background signal.
High-Parameter Panel Design Panel design for stem cell characterization follows tiered antigen classification, pairing bright fluorochromes with low-abundance markers (e.g., transcription factors) and dim fluorochromes with highly expressed antigens (e.g., common surface markers) [8]. The similarity index tool (0-1 scale) guides fluorophore selection, with values <0.5 recommended for co-expressed markers [7]. A typical high-dimensional stem cell panel might include:
- Pluripotency markers: OCT4, SOX2, NANOG
- Lineage-specific markers: CD34, CD133, CD271
- Signaling molecules: phospho-STAT3, phospho-AKT
- Functional markers: Ki-67, apoptosis markers
- Differentiation potential indicators: CD105, CD90, CD73
Reference Controls and Unmixing Validation Spectral unmixing requires single-stained controls for each fluorophore, preferably using the same cell type as experimental samples to ensure accurate spectral signature capture [7]. While compensation beads provide strong signal, cells are recommended for dim markers or when bead binding alters spectral properties. Unstained controls are essential for autofluorescence extraction, which must be performed for each tissue type due to variable autofluorescence profiles [7].
Advanced Analytical Workflow
The following diagram illustrates a comprehensive spectral flow cytometry workflow for deep stem cell characterization:
Research Reagent Solutions for Spectral Flow Cytometry
The successful implementation of spectral flow cytometry in stem cell research depends on carefully selected reagents and materials. The following table outlines essential research solutions and their specific applications:
Table 3: Essential Research Reagents for Spectral Flow Cytometry in Stem Cell Research
| Reagent Category | Specific Examples | Application in Stem Cell Research | Technical Considerations |
|---|---|---|---|
| Viability Stains | Fixable viability dyes (e.g., Zombie dyes, Live/Dead fixable stains) | Discrimination of live/dead cells, essential for accurate stem cell quantification | Must be compatible with fixation; spectral signature should not overlap with key markers [8] |
| Surface Marker Antibodies | CD34, CD133, CD90, CD105, CD73, CD271 | Identification and characterization of stem cell populations | Recombinant antibodies recommended for reduced lot-to-lot variability; titrate for optimal signal-to-noise [8] |
| Intracellular Transcription Factors | OCT4, SOX2, NANOG, KLF4 | Assessment of pluripotency and stemness | Require fixation/permeabilization; bright fluorophores essential for low-abundance targets [1] |
| Tandem Dyes | PE-Cy7, APC-Cy7, Brilliant Violet tandems | Expanded panel design through spectral separation | Monitor batch-to-batch variability; validate with single-stained controls [5] [7] |
| Cell Preparation Reagents | DNase, EDTA, collagenase/dispase | Tissue dissociation and single-cell suspension preparation | Optimize concentration and incubation time for specific stem cell types [8] |
| Reference Control Materials | Antibody capture beads, biological reference cells | Spectral unmixing validation and quality control | Use same cell type as experimental samples for most accurate unmixing [7] |
| Cryopreservation Media | DMSO-containing formulations with serum alternatives | Long-term storage of stem cell samples | Post-thaw viability affects autofluorescence; standardize resting time before analysis [8] |
Comparative Performance in Stem Cell Research Applications
Resolution of Rare Populations and Complex Phenotypes
The enhanced capabilities of spectral flow cytometry provide distinct advantages for specific stem cell research applications:
Rare Stem Cell Population Detection Spectral technology significantly improves detection of rare stem cell subsets, such as cancer stem cells or tissue-specific progenitors, through autofluorescence extraction and enhanced signal-to-noise ratios. In hematopoietic stem cell research, spectral cytometry has enabled identification of rare subpopulations with distinct differentiation potential at frequencies below 0.01% [2]. The ability to incorporate numerous markers in a single tube eliminates the need for sample splitting, preserving rare cells for comprehensive analysis.
Multiplexed Functional Assays Comprehensive stem cell characterization often requires simultaneous assessment of surface phenotype, intracellular signaling, and cell cycle status. Spectral flow cytometry supports complex multiplexing of phosphorylation states (phospho-flow), cytokine production, and transcription factor expression alongside conventional immunophenotyping [3]. This integrated approach is particularly valuable for monitoring stem cell responses to microenvironmental cues or pharmacological agents.
Minimal Residual Disease (MRD) Monitoring In clinical stem cell transplantation settings, spectral flow cytometry has demonstrated superior sensitivity for MRD detection in leukemic patients. Studies have validated 24-color panels with sensitivities below 0.02% for acute myeloid leukemia, enabling identification of aberrant stem cell phenotypes that would be undetectable with conventional cytometry [2]. The technology also facilitates detection of antigen-loss variants that may emerge under therapeutic pressure.
Data Quality and Analytical Advantages
Table 4: Application-Based Performance Comparison in Stem Cell Research
| Research Application | Conventional Flow Cytometry Performance | Spectral Flow Cytometry Performance | Experimental Evidence |
|---|---|---|---|
| Stem Cell Immunophenotyping | Limited to 15-20 markers across multiple tubes; population resolution compromised by spreading error | 30-40 markers in single tube; improved resolution through autofluorescence extraction | 37-color panel identified PD-1+ CD8+ CAR-T subsets correlated with complete response in lymphoma [6] |
| Intracellular Signaling Analysis | Challenging due to autofluorescence from fixation/permeabilization | Enhanced resolution through autofluorescence separation; more accurate phospho-protein quantification | Spectral analysis enabled precise STAT3/STAT5 phosphorylation mapping in hematopoietic stem cells [3] |
| Rare Population Detection | Sensitivity limited by background and compensation artifacts | 10-100x improvement in rare population detection sensitivity | MRD detection at 0.001% sensitivity in B-ALL using 23-color panel [2] |
| Sample-Limited Applications | Requires sample splitting for comprehensive analysis; limited data from precious samples | Comprehensive analysis from minimal material (e.g., pediatric samples, biopsies) | Successful immunophenotyping of bone marrow aspirates with limited cellularity [2] [6] |
The evolution from conventional to spectral flow cytometry represents a paradigm shift in stem cell research capabilities. By overcoming the fundamental limitations of spectral overlap and compensation, spectral technology has enabled researchers to address increasingly complex biological questions with unprecedented resolution. The capacity to simultaneously monitor dozens of parameters from limited sample material is particularly valuable for translational stem cell research, where comprehensive characterization is essential for clinical applications.
Looking forward, the integration of spectral flow cytometry with artificial intelligence and machine learning approaches promises to further transform stem cell analysis [1]. These computational methods can extract subtle patterns from high-dimensional spectral data, potentially identifying novel stem cell subsets or predictive signatures of differentiation potential. Additionally, ongoing development of novel fluorophores with distinct spectral signatures will continue to expand analytical possibilities [5].
As spectral technology becomes more accessible and standardized, its role in stem cell research will continue to grow, driving discoveries in basic stem cell biology and accelerating the development of stem cell-based therapies. The continued refinement of both instrumentation and analytical approaches ensures that flow cytometry will remain an essential tool for unlocking the remarkable potential of stem cells in regenerative medicine and beyond.
Conventional flow cytometry remains a cornerstone technique in biomedical research and clinical diagnostics, enabling the multiparameter analysis of physical and chemical characteristics of cells or particles in suspension as they flow through a laser beam [9]. This technology has had its most profound impact in fields such as immunology, stem cell research, and drug development, where it allows researchers to identify and quantify rare cell populations within complex mixtures [10]. The fundamental principle underlying conventional flow cytometry involves the use of fluorophore-conjugated antibodies to target specific cellular markers, followed by laser excitation and precise detection of the resulting fluorescent signals [5]. For decades, this approach has provided invaluable insights into cellular phenotypes and functions, forming the technological foundation upon which more recent advancements, including spectral flow cytometry, have been built.
The enduring significance of conventional flow cytometry lies in its robust methodology and well-established protocols, which continue to support a wide range of applications from basic research to clinical diagnostics [11]. While the field has undergone substantial evolution from early single-parameter systems to modern polychromatic platforms capable of analyzing 15-20 parameters, the core principles of optical filtration, signal detection, and electronic compensation remain essential to its operation [12] [10]. This article will explore these fundamental principles in detail, providing researchers with a comprehensive understanding of conventional flow cytometry instrumentation and methodology within the contemporary context of spectral flow cytometry advancement.
Fundamental Principles and Instrumentation
Optical Filters: Isolating Fluorescent Signals
In conventional flow cytometry, optical filters perform the critical function of isolating specific wavelength ranges from the broad emission spectra of fluorophores, enabling the detection of multiple markers simultaneously [12]. These filters are strategically positioned within the optical path to direct precise portions of the light spectrum to appropriate detectors. Three primary types of optical filters work in concert to achieve this signal separation:
Dichroic mirrors (or dichroic filters) serve as wavelength-specific gates that either transmit or reflect incident light based on its wavelength [5]. These mirrors are positioned at 45-degree angles to the light path and feature a sharp cutoff between their transmitting and reflecting ranges. Long-pass dichroic mirrors allow light above a specific wavelength to pass through while reflecting shorter wavelengths, whereas short-pass mirrors perform the opposite function.
Bandpass filters further refine the isolated light by permitting only a narrow window of wavelengths (typically 20-50 nm) to reach the detector [5] [12]. Each bandpass filter is characterized by its center wavelength and bandwidth, with the filter's transmission efficiency varying across its allowed spectrum. These filters are essential for matching the emission peak of specific fluorophores while excluding stray light and emissions from other dyes in the panel.
Long-pass and short-pass filters provide additional control over spectral separation by transmitting light either above or below a designated cutoff wavelength, respectively [13]. While bandpass filters create specific detection "windows," long-pass and short-pass filters establish broader boundaries in the optical sorting process.
The arrangement of these optical components follows a precise sequence that progressively segregates the full light emission into discrete channels. When fluorescent light emitted from a cell enters the detection system, it first encounters a dichroic mirror that separates the spectrum into two paths based on wavelength. Each resulting beam may then encounter additional dichroic mirrors for further separation, with bandpass filters finally defining the exact wavelength range that reaches each detector [5]. This sophisticated optical network enables conventional flow cytometers to resolve multiple fluorescent signals, though the number of parameters is ultimately limited by the physical number of detectors and filters installed in the system.
Detector Systems: Converting Photons to Data
Conventional flow cytometers employ photomultiplier tubes (PMTs) as their primary detection technology for capturing and amplifying fluorescent signals [5] [13]. These vacuum tube detectors operate through a photoelectric effect whereby incoming photons strike a photocathode material, ejecting electrons that then undergo multiple stages of amplification through a dynode chain [13]. This process results in a measurable electrical current that is proportional to the initial light intensity, enabling the detection of even dim fluorescent signals from rare cellular events.
The operational principle of PMTs involves several critical stages that collectively determine detector performance. When a photon with sufficient energy strikes the photocathode, it dislodges an electron through the photoelectric effect. This primary electron is then accelerated toward the first dynode by an applied voltage difference, upon impact releasing multiple secondary electrons. These secondary electrons are in turn accelerated toward subsequent dynodes, creating an exponentially increasing electron cascade at each stage [13]. Finally, this amplified electron cloud reaches the anode, where it generates an electrical pulse that can be processed and digitized by the instrument's electronics.
Key performance characteristics of PMT detectors include:
- Spectral response, which varies depending on the photocathode material, with different compositions optimized for specific wavelength ranges
- Gain, or amplification factor, typically ranging from 10^5 to 10^7, which can be adjusted by modifying the applied voltage
- Signal-to-noise ratio, critical for detecting dim populations against background signals
- Dynamic range, determining the span between the lowest detectable signal and signal saturation
In advanced conventional flow cytometers, these PMT detectors are often supplemented with more sensitive detection technologies such as avalanche photodiodes (APDs) for specific applications requiring enhanced sensitivity in certain wavelength ranges [5]. The configuration of these detectors follows the "one detector–one fluorophore" paradigm, where each PMT is dedicated to measuring a specific fluorophore's emission within a narrow bandwidth defined by the preceding optical filters [5]. This fundamental architecture, while highly effective, imposes inherent limitations on parameter expansion that spectral flow cytometry has been designed to address.
The Compensation Matrix: Correcting Spectral Overlap
Spectral overlap presents a fundamental challenge in conventional flow cytometry, occurring when the broad emission spectrum of one fluorophore spills into the detection channel of another [12]. This phenomenon is inevitable in multicolor panels due to the physical properties of fluorescent molecules, whose emission profiles typically span dozens of nanometers. Compensation represents the mathematical correction process that accounts for this spillover, ensuring that the signal measured in each detector accurately reflects the contribution from its intended fluorophore [12].
The compensation procedure requires the collection of single-stained control samples for each fluorophore used in the panel. These controls establish how much signal from each fluorophore appears in its primary detector versus its spillover into secondary detectors [12]. The resulting data is used to calculate a compensation matrix that mathematically subtracts the appropriate proportion of signal from each affected channel during subsequent sample acquisition.
Table 1: Key Components of Conventional Flow Cytometry Compensation
| Component | Function | Considerations |
|---|---|---|
| Single-Stained Controls | Determine fluorophore spillover patterns | Must be identical to experimental samples |
| Compensation Matrix | Mathematical correction for spectral overlap | Applied during data acquisition or analysis |
| Fluorophore Brightness | Impacts spillover magnitude | Brighter dyes cause more spillover |
| Detector Voltage | Affects spillover compensation | Requires optimization before compensation |
The mathematical foundation of compensation relies on solving a system of linear equations where the measured signal in each detector (M1, M2, ..., Mn) represents the sum of contributions from all fluorophores (F1, F2, ..., Fn), weighted by their spillover coefficients (Sij represents spillover from fluorophore j into detector i) [12]. The compensation algorithm inverts this relationship to calculate the true fluorophore abundances. This process becomes increasingly complex as more parameters are added, with potential for error propagation that can lead to misinterpretation of dim or overlapping populations [9].
Despite its critical importance, traditional compensation faces several limitations. The process assumes linearity and additivity of signals, which may not hold true at extreme signal intensities. Additionally, compensation can amplify noise in negatively stained populations and requires careful manual setup and verification [12] [11]. These challenges become particularly pronounced in high-parameter panels (>15 colors), where extensive spectral overlap complicates the compensation matrix and can compromise data integrity [9].
Experimental Protocols for Conventional Flow Cytometry
Panel Design and Optimization
Effective panel design is a critical prerequisite for successful conventional flow cytometry experiments, requiring careful consideration of multiple factors to minimize spectral overlap while maintaining detection sensitivity [12]. The process begins with a thorough assessment of the biological question, specifically identifying the cell populations and markers of interest, their expected expression levels, and potential co-expression patterns. This information guides the strategic assignment of fluorophores to antigens, following the fundamental principle of matching the brightest fluorophores with the most dimly expressed antigens [12].
A methodical approach to panel design includes several essential stages. Researchers must first compile a comprehensive list of target antigens and characterize their expression patterns—whether they are highly expressed, moderately expressed, or dim—on the specific cell populations under investigation. Next, the available laser lines and detection channels on the instrument must be catalogued to identify compatible fluorophore options. The core of the design process involves strategically assigning fluorophores to antigens, prioritizing bright fluorophores (such as PE or APC) for dimly expressed markers, while reserving dimmer fluorophores for highly expressed antigens [12]. This assignment must carefully consider potential spectral overlaps, avoiding combinations where two fluorophores with significant spillover are likely to be co-expressed on the same cell populations.
Table 2: Fluorophore Selection Strategy for Conventional Flow Cytometry
| Antigen Expression Level | Recommended Fluorophore Type | Examples | Rationale |
|---|---|---|---|
| Dim/Low Density | High quantum yield, bright | PE, APC, tandems | Maximizes signal detection |
| Moderate | Medium brightness | FITC, PerCP-Cy5.5 | Balanced brightness and spillover |
| High/Abundant | Dim or susceptible to spillover | Pacific Blue, FITC | Minimizes spillover to other channels |
| Co-expressed Antigens | Minimal spectral overlap | Different laser excitation | Reduces compensation errors |
Instrument-specific configuration plays a crucial role in panel design, as different cytometers vary in their laser wavelengths, optical filters, and detector sensitivities [12]. Before finalizing a panel, researchers should consult the specific configuration of their instrument, as filter sets and laser lines can significantly impact fluorophore performance. Additionally, the use of tandem dyes requires special consideration due to their potential for batch-to-batch variability and susceptibility to degradation, which can alter their spectral properties and compromise compensation accuracy [12].
Instrument Setup and Quality Control
Proper instrument setup and rigorous quality control protocols are essential for generating reproducible, high-quality flow cytometry data [11]. Daily quality assurance begins with the running of standardized calibration beads to verify laser delays, detector voltages, and optical alignment. These beads serve as stable reference materials for monitoring instrument performance over time and ensuring consistency across experiments. Following calibration, fluorescence compensation must be established using single-stained controls that are identical to the experimental samples in terms of cell type, staining protocol, and matrix [12].
A critical aspect of quality control involves optimizing photodetector voltages to achieve optimal signal-to-noise ratios. PMT voltages should be set such that negative populations remain on scale while allowing positive populations to be fully resolved without saturation [13]. This typically involves titrating antibodies to determine the optimal concentration that provides sufficient signal intensity without increasing background noise or unnecessary spillover. Additionally, researchers should regularly perform spectral overlap checks using compensation matrices to identify potential issues before running valuable experimental samples [11].
Long-term quality control requires meticulous documentation and tracking of key performance metrics, including fluorescence resolution, detection sensitivity, and background levels [11]. Implementing a systematic quality control program with regular instrument maintenance, standardized operating procedures, and personnel training significantly enhances the reliability and reproducibility of conventional flow cytometry data, particularly in regulated environments such as clinical trials or drug development settings [11].
Comparative Analysis: Conventional vs. Spectral Flow Cytometry
Technical and Performance Differences
Conventional and spectral flow cytometry differ fundamentally in their approach to fluorescence detection and signal processing, leading to distinct performance characteristics and application capabilities [5] [2]. While conventional cytometers employ optical filters to isolate specific wavelength ranges and direct them to discrete detectors following the "one detector–one fluorophore" paradigm, spectral cytometers capture the full emission spectrum of each fluorophore using detector arrays [5]. This architectural distinction underlies their contrasting strengths and limitations in high-parameter cell analysis.
The data processing methodologies diverge significantly between the two platforms. Conventional flow cytometry relies on compensation to mathematically correct for spectral overlap after data acquisition, a process that can introduce noise and becomes increasingly challenging with larger panels [12]. In contrast, spectral flow cytometry utilizes unmixing algorithms that employ the complete spectral signature of each fluorophore to deconvolve signals, potentially providing more accurate resolution of overlapping dyes [2] [9]. This fundamental difference in signal processing enables spectral cytometers to resolve fluorophores with nearly identical emission peaks that would be incompatible on conventional systems [13].
Table 3: Instrument Comparison Between Conventional and Spectral Flow Cytometry
| Feature | Conventional Flow Cytometry | Spectral Flow Cytometry |
|---|---|---|
| Detection Method | Bandpass filters + PMTs | Prism/grating + detector arrays |
| Signal Processing | Compensation | Spectral unmixing |
| Typical Maximum Parameters | 15-30 [9] | 40+ [2] [13] |
| Fluorophore Compatibility | Limited by filter configuration | Expanded due to full spectrum capture |
| Autofluorescence Handling | Limited subtraction capabilities | Can be mathematically extracted [2] |
| Panel Design Flexibility | Constrained by filter configuration | Enhanced due to spectral signature differentiation |
Application-specific performance varies considerably between the technologies. Conventional flow cytometry excels in targeted, lower-parameter assays where well-established panels and protocols exist, particularly in clinical diagnostics where standardization is critical [11]. Spectral flow cytometry demonstrates superior capabilities in high-parameter discovery research, rare population identification, and analysis of samples with significant autofluorescence [2]. The ability of spectral cytometers to resolve complex cellular phenotypes from limited sample material makes them particularly valuable for translational studies and clinical trials where sample volume is often restricted [2].
Practical Implications for Research and Diagnostics
The choice between conventional and spectral flow cytometry has significant practical implications for research workflows, data quality, and operational efficiency [2] [9]. Conventional systems offer the advantage of established methodologies, extensive validation histories, and generally simpler data analysis workflows, making them well-suited for standardized clinical assays and routine immunophenotyping [11]. However, their limitations in panel complexity often necessitate splitting markers across multiple tubes, increasing sample volume requirements and potentially complicating data integration [2].
Spectral flow cytometry provides substantial benefits for high-complexity panels, potentially reducing total sample consumption by consolidating markers that would otherwise require multiple tubes in a conventional approach [2]. This advantage is particularly valuable in precious sample scenarios such as pediatric studies, bone marrow aspirates, or serial monitoring during clinical trials [2]. Additionally, the ability to reuse previously established spectral references across experiments can streamline panel setup and improve workflow efficiency compared to the repeated compensation required with conventional cytometers [13].
The implementation decision between these technologies involves careful consideration of several practical factors. Conventional flow cytometers typically have lower initial acquisition costs and benefit from extensive institutional experience and established protocols [5]. Spectral systems represent a greater initial investment but offer expanded capabilities for high-parameter research and future-proofing as scientific questions become more complex [9]. For many facilities, a hybrid approach incorporating both technologies may be optimal, allowing routine clinical work to proceed on conventional platforms while supporting cutting-edge research needs with spectral technology [9].
Visualization of Technical Principles
Conventional Flow Cytometry Optical Path
Compensation Principle and Workflow
Essential Research Reagent Solutions
Table 4: Key Reagents for Conventional Flow Cytometry
| Reagent Category | Specific Examples | Function and Application Notes |
|---|---|---|
| Fluorophore-Conjugated Antibodies | FITC, PE, APC, PerCP-Cy5.5 | Target specific cellular markers; brightness varies by conjugate |
| Viability Dyes | 7-AAD, Propidium Iodide, Fixable Viability Dyes | Distinguish live/dead cells; critical for data accuracy |
| Compensation Beads | Anti-Mouse/Rat Igκ beads, ArC beads | Create consistent single-stained controls for compensation |
| Calibration Standards | Rainbow beads, alignment beads | Verify instrument performance and laser delays |
| Cell Preparation Reagents | Red blood cell lysis buffer, Fc receptor blocking | Prepare samples for staining and reduce non-specific binding |
| Fixation and Permeabilization | Paraformaldehyde, methanol, commercial kits | Preserve cells and enable intracellular marker detection |
Conventional flow cytometry, with its well-established principles of optical filtration, PMT detection, and electronic compensation, continues to be a powerful technology for cellular analysis in both research and clinical settings [10] [11]. Its robust methodology and standardized protocols support a wide range of applications from basic phenotyping to complex immunophenotyping panels of up to 20 parameters [5] [9]. The fundamental understanding of filter configurations, detector operations, and compensation mathematics remains essential for researchers working with these instruments, regardless of the ongoing technological evolution toward spectral platforms [12] [10].
The comparison with spectral flow cytometry reveals a complementary relationship between the two technologies rather than a simple replacement scenario [2] [9]. While spectral cytometry offers clear advantages in parameter expansion, panel design flexibility, and autofluorescence management, conventional flow cytometry maintains important benefits in operational simplicity, cost-effectiveness, and established validation pathways for regulated environments [11]. The choice between these platforms ultimately depends on specific research needs, sample availability, and analytical requirements, with both technologies continuing to evolve and address distinct niches in the expanding landscape of single-cell analysis [9] [10].
Flow cytometry has long been an indispensable tool in cellular and molecular biology, enabling multiparametric analysis of individual cells in real time. However, conventional flow cytometry (CFC) has been constrained by limitations in spectral resolution and the ability to measure multiple parameters simultaneously. The emergence of spectral flow cytometry (SFC) represents a technological breakthrough that addresses these limitations by capturing the complete emission spectrum of fluorochromes, thereby significantly increasing analytical accuracy and enabling the evaluation of up to 40 parameters on a single cell [3]. This evolution is particularly transformative for stem cell analysis research, where understanding complex cellular heterogeneity is crucial for advancing regenerative medicine and therapeutic development.
The fundamental difference between these technologies lies in their approach to fluorescence detection. While conventional systems use optical filters to direct specific wavelengths to individual detectors, spectral cytometry employs full-spectrum profiling using multi-channel detectors and advanced algorithms to unmix overlapping signals [3] [14]. This technical advancement has driven substantial progress in immunology, oncology, and autoimmune disease research, with growing implications for stem cell characterization and monitoring.
Technical Foundations: Conventional vs. Spectral Detection Mechanisms
Conventional Flow Cytometry Limitations
Conventional flow cytometry relies on a system of fixed optical filters, dichroic mirrors, and photomultiplier tubes (PMTs) to direct specific wavelength ranges to dedicated detectors. This "one detector–one fluorophore" approach necessitates complex optical systems – a flow cytometer registering signals from 12 fluorophores may contain 12–14 independent detectors and more than 40 optical filters [5]. This architecture creates several limitations:
- Spectral Overlap: Fluorophores with nearby emission spectra exhibit "spillover," requiring mathematical compensation algorithms that can introduce errors and affect population quantification, especially in panels with more than 10 markers [3] [14].
- Limited Multiplexing: Practical limitations restrict conventional systems to approximately 18 colors simultaneously, insufficient for deep immunophenotyping of complex stem cell populations [3] [5].
- Detection Constraints: Filter-based systems cannot distinguish between fluorophores with highly similar emission peaks, such as APC and Alexa Fluor 647, preventing their co-utilization in the same panel [14].
Spectral Flow Cytometry Advancements
Spectral flow cytometry fundamentally redefines fluorescence detection by capturing the entire emission spectrum (400->800 nm) for each fluorophore. Key advantages include:
- Full Spectrum Capture: Using prisms or diffraction gratings, emitted light is scattered and captured by an array of highly sensitive detectors (typically 32-88 channels), generating a unique spectral fingerprint for each fluorophore [3] [5] [15].
- Spectral Unmixing: Advanced algorithms mathematically decompose overlapping signals using previously established reference spectra, minimizing compensation needs and improving accuracy [3] [14].
- Enhanced Multiplexing: The ability to distinguish fluorophores with up to 98% spectral similarity enables simultaneous detection of 30-50 parameters in a single tube, far exceeding conventional limits [14] [2].
The following diagram illustrates the fundamental differences in how conventional and spectral flow cytometers handle light detection and signal processing:
Comparative Performance Data: Quantitative Analysis
Instrument Capabilities and Specifications
The performance advantages of spectral flow cytometry are evident in the technical specifications of contemporary instruments across leading platforms.
Table 1: Comparison of Spectral Flow Cytometer Capabilities
| Manufacturer & Model | Number of Lasers | Detection Channels | Maximum Colors | Key Technologies |
|---|---|---|---|---|
| Cytek Aurora | 3-5 | 38-64 | Up to 40 | Full Spectrum Profiling [5] [14] |
| Sony ID7000 | Up to 7 | 184F | 44 or more | 32-channel PMT arrays [5] |
| BD FACSymphony A5 SE | 5 | 48F | Up to 40 | Cascade square PMT array [5] |
| Agilent NovoCyte Opteon | Up to 5 | 73F | Up to 45 | CMOS WD* [5] |
| Invitrogen Attune Xenith | 6 | 51F | Up to 32 | Acoustic-assisted focusing [15] |
| BD FACSDiscover A8 | 5 | 86 detectors | 50+ | BD SpectralFX Technology, BD CellView Image Technology [15] |
*CMOS WD: Complementary metal-oxide-semiconductor wide-detection array
Analytical Performance in Stem Cell Research Applications
Direct comparative studies demonstrate the superior capabilities of spectral flow cytometry for complex stem cell analysis:
Minimal Residual Disease (MRD) Detection: A 24-color SFC panel for acute myeloid leukemia achieved sensitivity below 0.02% while preserving marker correlation and improving resolution of maturation states [2]. In B-cell acute lymphoblastic leukemia, a 23-color panel identified CD19-negative leukemic clones, a critical challenge following CD19-targeted therapies [2].
High-Dimensional Immunophenotyping: A 42-parameter spectral panel (40 commercially available fluorochromes plus autofluorescence parameter) enabled identification of over 80 distinct immune cell subsets from peripheral whole blood, including rare populations like mucosal-associated invariant T (MAIT) cells and innate lymphoid cells (ILCs) [16].
Stem Cell Characterization: Research on intercellular mitochondria transfer utilized a 31-color spectral panel (1 viability dye, 1 fluorescent reporter, and 29 antibody-fluorophore conjugates) to identify 21 distinct cell types and monitor organelle transfer between adipocytes and multiple recipient cell types [14].
Experimental Protocols for Spectral Flow Cytometry
Sample Preparation and Staining Optimization
Proper sample preparation is critical for successful spectral flow cytometry experiments, particularly for precious stem cell samples:
Viability Staining: Always include a viability dye to exclude dead cells, which cause non-specific binding and have different autofluorescence profiles. Titrate viability reagents first, then titrate antibody-conjugates on viable cells using the optimal viability dye concentration [17] [18].
Fc Receptor Blocking: Use Fc blocking reagents prior to staining for samples containing monocytes, dendritic cells, B cells, or granulocytes to prevent non-specific antibody binding [18].
Buffer Consistency: Maintain identical buffer systems for testing, panel preparation, and experimental sample acquisition to ensure consistency in staining performance [17].
Fixation Considerations: Note that fixation can impact fluorescence intensity and autofluorescence. If fixation is necessary, ensure single-stained controls undergo identical treatment [17].
Panel Design and Fluorophore Selection
Spectral flow cytometry panel design requires careful consideration of antigen density, fluorophore brightness, and spectral overlap:
Brightness Matching: Match fluorophore brightness to antigen abundance, considering that brightness perception is influenced by detector sensitivity and cellular autofluorescence. For example, BV421 experiences higher autofluorescence than PE due to endogenous vitamins and metabolic cofactors [18].
Spectral Spreading Management: Avoid assigning markers conjugated to fluorophores with heavy spectral overlap to co-expressed antigens. Utilize online tools (e.g., FluoroFinder Spectra Viewer) to calculate complexity indices and optimize fluorophore combinations [18].
Tandem Dye Considerations: Be aware that tandem dyes (e.g., PE-Cy7, APC-Cy7) can exhibit lot-to-lot variability and degradation. Use the same lot for controls and experiments, and consider using "Brilliant" polymer dyes with blocking buffers to prevent non-specific polymer interactions [17] [18].
Essential Experimental Controls
Robust experimental design requires both biological and technical controls to ensure data quality and accurate interpretation:
Table 2: Essential Controls for Spectral Flow Cytometry Experiments
| Control Type | Purpose | Application in Stem Cell Research |
|---|---|---|
| Unstained Cells | Determine cellular autofluorescence; set FSC/SSC parameters | Essential for establishing baseline autofluorescence of different stem cell populations [17] |
| Single-Stain Controls | Generate spectral fingerprints for unmixing algorithms | Required for every fluorophore; should use the same cell type and treatment as experimental samples [17] |
| Biological Positive Controls | Establish expected positive signal for antigens of interest | Use known positive stem cell populations or induced expression samples [17] |
| Biological Negative Controls | Establish expected negative signal | Use knockout cells, isotype controls, or known negative populations [17] |
| FMO Controls | Determine gate boundaries accounting for spreading error | Critical for low-abundance markers and continuous expression patterns [17] |
| Viability Controls | Distinguish live/dead cells | Particularly important for primary stem cells and tissue samples [18] |
The Scientist's Toolkit: Essential Research Reagents
Successful spectral flow cytometry experiments require carefully selected reagents optimized for high-parameter panels.
Table 3: Key Research Reagent Solutions for Spectral Flow Cytometry
| Reagent Category | Specific Examples | Function in Spectral Experiments |
|---|---|---|
| Bright Fluorophores | Spark, Super Bright, Brilliant Violet | Maximize signal for low-abundance markers; enable better separation [5] [19] |
| Tandem Dyes | PE-Cy7, PE-Cy5.5, APC-Cy7 | Expand panel possibilities; require careful lot matching [5] [18] |
| Viability Dyes | Fixable viability stains (e.g., Zombie, Live/Dead) | Identify and exclude dead cells; reduce non-specific binding [17] [18] |
| Fc Blocking Reagents | Human Fc Block, Mouse Fc Block | Reduce non-specific antibody binding to Fc receptor-expressing cells [17] [18] |
| Cell Activation Reagents | PMA/Ionomycin, Cell Stimulation Cocktail | Induce cytokine production for functional assays [16] |
| Intracellular Staining Kits | FoxP3/Transcription Factor Staining Buffers | Enable detection of intracellular and nuclear targets [16] |
| Reference Control Particles | ViaComp particles, antibody capture beads | Provide consistent controls for viability dyes and single stains [18] |
Advanced Applications in Stem Cell Research
High-Dimensional Stem Cell Characterization
Spectral flow cytometry enables comprehensive immunophenotyping of complex stem cell populations that was previously impossible with conventional technology:
CAR-T Cell Therapy Monitoring: SFC permits simultaneous assessment of CAR-T products, residual disease, and immune context in a single tube, facilitating real-time clinical insights. Recent studies have identified cellular phenotypes associated with therapeutic response, including PD-1+ CD8+ CAR-T subsets in lymphoma responders and CCR7+ early-memory cells in CLL [2].
Rare Population Analysis: The technology enables identification of rare stem cell subpopulations and differentiation intermediates using 30+ parameter panels, providing unprecedented resolution of developmental hierarchies [14] [16].
Mitochondrial Transfer Studies: As demonstrated in adipocyte-specific mitochondria reporter models, SFC can track organelle transfer between cell types while simultaneously characterizing recipient and donor populations using 31-color panels [14].
Autofluorescence Extraction in Stem Cell Analysis
A unique advantage of spectral flow cytometry is its ability to identify and subtract cellular autofluorescence, which is particularly valuable when working with specialized stem cell populations:
This capability is particularly important for:
- Primary Tissue Samples: Stem cells isolated from solid tissues often exhibit higher autofluorescence than cell lines.
- Metabolically Active Cells: Pluripotent stem cells and rapidly dividing progenitors may have distinct autofluorescence profiles.
- Drug-Treated Cells: Experimental treatments can alter cellular metabolism and autofluorescence signatures [19] [2].
Future Perspectives and Emerging Technologies
The field of spectral flow cytometry continues to evolve with several emerging technologies enhancing its capabilities:
Integrated Imaging: The BD FACSDiscover A8 combines spectral flow with real-time imaging using BD CellView Image Technology, enabling visualization of fluorescence localization and cellular morphology alongside spectral data [15].
Mass Spectrometry Integration: Combined with mass spectrometry, spectral cytometry enables validation of fluorescent probe identity and purity, with recent advancements making high-accuracy mass spectrometry more accessible to flow cytometry labs [15].
Advanced Detection Systems: New instruments feature increasingly sophisticated detection systems, such as the CytoFLEX mosaic module with 88 detection channels and dual conventional/spectral modes, and the Cytek Aurora Evo with enhanced nanoparticle detection capabilities [15].
Automated Analysis Platforms: Integration with machine learning platforms like Cytobank enables advanced analysis of complex spectral datasets, facilitating identification of novel cell populations and biomarkers in stem cell research [2] [15].
Spectral flow cytometry represents a fundamental advancement over conventional flow cytometry, providing researchers with unprecedented capability to analyze complex cellular systems. By capturing the full emission spectrum and employing sophisticated unmixing algorithms, this technology enables comprehensive stem cell characterization that was previously unattainable. While implementation requires careful attention to panel design, control selection, and experimental optimization, the resulting high-dimensional data provides deeper insights into stem cell biology, therapeutic mechanisms, and disease pathogenesis. As the technology continues to evolve with integrated imaging, mass spectrometry correlation, and enhanced computational analysis, spectral flow cytometry is poised to become an increasingly indispensable tool in stem cell research and therapeutic development.
Flow cytometry stands as a cornerstone technology in biomedical research and clinical diagnostics, enabling the multiparametric analysis of cells at a single-cell level. For decades, conventional flow cytometry (CFC) has been the standard tool, but its limitations in analyzing complex biological systems have spurred technological innovation. The emergence of spectral flow cytometry (SFC) represents a paradigm shift in detection and data acquisition methodologies [5] [2]. This evolution is particularly relevant for advanced research fields like stem cell analysis, where the ability to deeply characterize heterogeneous cell populations is crucial for understanding differentiation, function, and therapeutic potential [20]. This guide provides a detailed, objective comparison of the core technical principles underlying conventional and spectral flow cytometry, focusing on their detection mechanisms and data acquisition processes to inform researchers and drug development professionals.
Core Detection Mechanisms: A Fundamental Divergence
The most fundamental difference between conventional and spectral flow cytometry lies in their approach to capturing and interpreting fluorescent light. This divergence in optical design dictates their capabilities, limitations, and suitability for different applications.
Conventional Flow Cytometry: Filter-Based Detection
Conventional flow cytometers rely on a system of optical filters and dichroic mirrors to direct specific wavelengths of light to discrete detectors [5] [21]. Each detector, typically a photomultiplier tube (PMT), is assigned to a narrow band of wavelengths approximating the emission peak of a specific fluorophore [5]. This establishes a "one detector–one fluorophore" principle [5]. A significant challenge in this system is spectral overlap, where the broad emission spectra of fluorophores cause signal "spillover" into multiple detectors [22]. This necessitates post-acquisition compensation, a mathematical correction to subtract this spillover and accurately attribute signals to their correct fluorophore [21] [22]. The optical system is complex, often containing more than 40 optical filters for a 12-parameter instrument, which increases cost and complexity [5].
Spectral Flow Cytometry: Full-Spectrum Detection
Spectral flow cytometers take a holistic approach by capturing the entire emission spectrum of every fluorophore used in the panel [5] [3] [2]. Instead of using filters to direct light to specific detectors, the emitted light from all fluorophores is scattered using a prism or diffraction grating and captured by an array of highly sensitive detectors (on average 32-64) [5] [3]. Each fluorophore has a unique spectral signature, akin to a fingerprint [3] [21]. During data analysis, advanced spectral unmixing algorithms deconvolve the combined signal from each cell using pre-recorded reference spectra for all fluorophores in the panel [5] [22]. This process mathematically separates the contributions of each fluorophore, even those with highly overlapping emissions [2].
Table 1: Comparative Overview of Detection Mechanisms in Conventional vs. Spectral Flow Cytometry.
| Feature | Conventional Flow Cytometry | Spectral Flow Cytometry |
|---|---|---|
| Core Principle | Filter-based separation; "one detector–one fluorophore" [5] | Full-spectrum capture; "every detector sees every fluorophore" [22] |
| Optical System | Complex arrangement of dichroic mirrors and bandpass filters [5] | Simpler system using prism or diffraction grating [5] [3] |
| Spectral Overlap | Managed via hardware filters and post-acquisition compensation [21] [22] | Embraced and resolved via mathematical spectral unmixing [2] [22] |
| Key Data Output | Fluorescence intensity in discrete channels [3] | Complete fluorescence emission spectrum for each cell [3] [22] |
| Autofluorescence | Can obscure target signals and complicate analysis [2] | Can be characterized and subtracted during unmixing to improve resolution [2] |
Figure 1: Workflow comparison highlighting the fundamental divergence in signal detection and processing between conventional and spectral flow cytometry.
Data Acquisition: Compensation vs. Unmixing
The difference in detection mechanisms directly creates a stark contrast in how data is acquired and processed.
Data Acquisition in Conventional Cytometry
In CFC, the signal from each detector is processed independently after hardware-based filtration. The primary computational task is compensation. This is a linear subtraction process where the amount of spillover from one channel into another is quantified using single-stained controls, and this value is then subtracted from the signal in the affected channel for all subsequent data [21] [22]. While effective for panels with a limited number of colors, compensation becomes increasingly complex and prone to error as the number of fluorophores increases, as spillover spreads are interconnected and can magnify spreading error [22].
Data Acquisition in Spectral Cytometry
SFC replaces compensation with spectral unmixing, a more powerful linear algebra operation [22]. The measured signal on each detector is considered a linear mixture of the contributions from all fluorophores present. Using a reference library of the full emission spectrum for each fluorophore (the "spectral signature"), the algorithm calculates the abundance of each fluorophore that would best reproduce the measured composite signal across all detectors [5] [22]. This process not only separates signals from different fluorophores but also allows for the identification and subtraction of cellular autofluorescence by treating it as a separate component in the unmixing process, thereby enhancing signal-to-noise ratio [2].
Table 2: Comparative Analysis of Data Processing in Conventional and Spectral Flow Cytometry.
| Aspect | Conventional Flow Cytometry | Spectral Flow Cytometry |
|---|---|---|
| Primary Process | Compensation (spillover subtraction) [21] | Spectral Unmixing (linear decomposition) [5] [22] |
| Mathematical Basis | Linear subtraction based on spillover coefficients [22] | Linear algebra-based unmixing using reference spectra [22] |
| Reference Controls | Single-stained controls for spillover calculation [21] | Single-stained controls to build reference spectral library [21] |
| Impact of More Colors | Increases compensation complexity and spreading error [22] | Managed by the unmixing algorithm, though panel design remains critical [5] |
| Handling Autofluorescence | Can be a significant source of background noise [2] | Can be characterized and subtracted as a separate "fluorophore" [2] |
Experimental Validation and Performance Data
Independent studies have quantitatively compared the performance of conventional and spectral cytometers, providing objective data on their capabilities.
Protocol for Instrument Comparison
A robust method for comparing instrument performance involves running the same stained sample on different cytometers and analyzing key metrics [23]. A typical protocol includes:
- Sample Preparation: Using a standardized cell line (e.g., HEK293) or primary cells (e.g., peripheral blood mononuclear cells) stained with a defined multicolor antibody panel.
- Instrument Calibration: All cytometers are calibrated using the same batch of rainbow calibration beads to ensure standardized measurement conditions.
- Data Acquisition: The same sample tube is run on various conventional (e.g., BD Fortessa, Beckman Coulter Gallios) and spectral (e.g., Cytek Aurora, Sony ID7000) cytometers [23].
- Data Analysis: Key parameters are analyzed, including Median Fluorescence Intensity (MFI), signal-to-noise ratio, resolution index (a measure of a system's ability to distinguish between positive and negative populations), and detection range [23].
Key Comparative Findings
Research has demonstrated measurable performance differences. A 2025 study comparing live MOG-IgG cell-based assays across multiple cytometers found that the MFI detection range on a spectral cytometer (ID7000) was 4.75-fold higher than a conventional cytometer (Fortessa) and another spectral system (Aurora) showed a 12-fold higher range [23]. Despite these differences in absolute signal intensity, the MFI values across all platforms were highly correlated (R² = 0.99), and the assays showed high reproducibility and concordance in final results (e.g., serostatus determination, κ = 1) [23]. This indicates that while spectral technology can offer a larger dynamic range, both technologies can be validated for robust diagnostic and research applications.
The Scientist's Toolkit: Essential Research Reagents and Materials
The successful implementation of high-parameter flow cytometry, whether conventional or spectral, relies on a carefully selected set of reagents and tools.
Table 3: Key Research Reagent Solutions for Advanced Flow Cytometry.
| Reagent / Material | Function and Importance in Panel Design |
|---|---|
| Fluorophore-Conjugated Antibodies | Enable specific detection of cellular markers. Bright fluorophores (e.g., PE, APC) should be assigned to low-abundance antigens [21]. |
| Viability Dyes | Critical for excluding dead cells, which exhibit high nonspecific antibody binding and autofluorescence, thereby improving data quality. |
| Single-Stained Controls | Essential for generating compensation matrices (CFC) or building reference spectral libraries (SFC). Typically created using compensation beads or cells [21]. |
| Calibration Beads | Used to standardize instrument settings across different days and machines, ensuring reproducibility and comparability of data over time. |
| Cell Staining Buffer | Provides an optimized environment for antibody binding while minimizing nonspecific Fc receptor-mediated binding through the inclusion of proteins like BSA. |
Implications for Stem Cell Research
The advanced capabilities of spectral flow cytometry are uniquely positioned to address key challenges in stem cell research. The ability to perform deep immunophenotyping with 30-40 parameters in a single tube is transformative for characterizing complex and heterogeneous populations, such as those found in pluripotent stem cell cultures or differentiated tissue progenitors [5] [2]. This is crucial for identifying novel subpopulations, tracking differentiation trajectories, and ensuring the purity and safety of cellular therapy products [20].
Furthermore, SFC's ability to handle volume-limited samples is a significant advantage in this field. Research often involves precious samples, such as primary tissue biopsies or in vitro differentiated cells, where cell numbers are low. SFC's capacity to extract maximal information from a single tube conserves these valuable samples [2]. The technology's utility is also being demonstrated in monitoring advanced therapies, including CAR-T cells and mesenchymal stem cell (MSC) products, allowing researchers to simultaneously track the therapeutic cells, the host immune response, and potential residual disease [20] [2]. As the stem cell field moves toward more quantitative disciplines, with a push for standardized cell counting [24], the high-dimensional, precise data from SFC will be integral to correlating stem cell dose with therapeutic outcomes.
Stem cells are fundamentally heterogeneous, a characteristic that is central to their biology but poses significant challenges for their precise identification. This inherent diversity arises from a complex network of varying self-renewal capabilities, differentiation potentials, and proliferative behaviors within a population [25]. Traditional analytical methods, which rely on a limited set of surface markers, often fall short because no single marker is exclusively expressed on stem cells and not on other hematopoietic cells [26]. This limitation is evidenced by research showing that even within a carefully isolated population, stem cell dynamics are composed of multiple co-existing sub-populations, including fast and slow-dividing cells, as well as quiescent cells [25]. Consequently, the scientific community has recognized that defining stem cells requires a shift from simplistic, reductionist approaches to a more holistic, systems-level view that can account for this intricate heterogeneity [1] [25].
The emergence of high-parameter spectral flow cytometry represents a transformative solution to this challenge. By enabling the simultaneous analysis of up to 40+ parameters on individual cells, this technology provides the resolution necessary to deconvolute complex stem cell populations, identify rare stem cell subtypes, and accurately characterize the stem cell hierarchy [3] [5] [27]. This capability is indispensable for advancing both basic research in stem cell biology and the development of robust clinical diagnostics and therapies [2].
Technical Comparison: Conventional vs. Spectral Flow Cytometry
The core difference between conventional and spectral flow cytometry lies in their fundamental approach to detecting and analyzing fluorescent signals. This distinction in detection mechanism is the primary driver behind the superior performance of spectral cytometry in high-parameter applications.
Detection Mechanisms and Data Processing
Conventional flow cytometry relies on a system of optical filters and dichroic mirrors to direct specific, predefined wavelength bands to individual photomultiplier tubes (PMTs). This "one detector–one fluorophore" approach is inherently limited by spectral overlap (spillover) between fluorochromes with nearby emissions [3] [5]. To correct for this overlap, complex mathematical compensation is required, a process that can introduce errors and becomes increasingly cumbersome and inaccurate as the number of parameters in a panel grows [3] [28].
In contrast, spectral flow cytometry captures the full emission spectrum of every fluorochrome across a wide range of wavelengths (e.g., 400-800 nm). The combined fluorescence is scattered using a prism or diffraction grating and detected by an array of highly sensitive detectors [3] [5] [27]. Advanced spectral unmixing algorithms then deconvolute the composite signal from each cell by comparing it to pre-established reference spectra for every fluorochrome used [3] [2]. This process not only minimizes the need for traditional compensation but also allows for the resolution of fluorochromes with highly similar emission peaks, which would be impossible to separate using conventional filter-based systems [5] [27].
Table 1: Fundamental Technical Comparison of Conventional and Spectral Flow Cytometry
| Feature | Conventional Flow Cytometry | Spectral Flow Cytometry |
|---|---|---|
| Detection Principle | Filters and mirrors direct specific wavelength bands to discrete detectors [5] | Prism/grating scatters full emission spectrum to a detector array [3] [5] |
| Signal Processing | Mathematical compensation for spillover [3] [28] | Linear unmixing using reference spectra [3] [2] |
| Fluorochrome Flexibility | Limited by laser and filter configuration [27] | Limited primarily by laser configuration; more flexible [27] |
| Autofluorescence Handling | Contributes to background noise; cannot be easily separated [2] | Can be profiled and mathematically extracted, improving resolution [2] [27] |
| Typical Max Panel Size | ~28 colors [27] | 40+ colors [3] [27] |
Performance Implications for Stem Cell Research
The technical differences translate into direct practical benefits for stem cell analysis. Spectral cytometry's ability to resolve more parameters in a single tube is crucial for studying rare populations, such as leukemia-initiating cells (LICs) or minimal residual disease (MRD), where comprehensive phenotyping from a limited sample volume is essential [2] [26]. Furthermore, the ability to extract autofluorescence is particularly valuable when working with stem cells, as it enhances the signal-to-noise ratio and improves the resolution of dimly expressed markers [2] [27].
Experimental Data and Application Comparisons
The theoretical advantages of spectral flow cytometry are borne out in direct experimental comparisons and specialized clinical applications, particularly in the detailed immunophenotyping required for stem cell research.
Instrument Capabilities and Panel Design
Modern flow cytometers have seen a dramatic increase in their analytical capacity. Conventional cytometers have pushed their limits with complex optical systems; for instance, the BD FACSymphony A5 Cell Analyzer uses 5 lasers and 50 detectors to measure up to 30 fluorescent parameters [5]. However, spectral cytometers achieve even higher multiplexing with a less optically complex setup. The Cytek Aurora, equipped with 5 lasers, can detect up to 64 fluorescent parameters, while the Agilent NovoCyte Opteon can measure up to 73 fluorescent channels [5].
This expanded capacity directly enables more powerful panel design. A key application is in deep immunophenotyping, where a single 40-color panel can identify all major leukocyte phenotypes, including rare stem and progenitor subsets, in one assay, preserving precious cells for downstream functional studies [27]. The following diagram illustrates the foundational workflow of spectral flow cytometry that makes this possible.
Diagram: The core spectral analysis workflow involves capturing the full emission spectrum from a laser-excited cell and using computational unmixing to resolve individual fluorochrome signatures.
Key Application: Minimal Residual Disease (MRD) Detection
The superior performance of spectral flow cytometry is critically important in clinical applications like Minimal Residual Disease (MRD) detection in hematologic malignancies, where identifying rare cancer stem cells is essential for prognosis and treatment.
Table 2: Spectral Flow Cytometry Applications in MRD Detection for Hematologic Malignancies
| Disease | Panel Size | Key Markers | Reported Sensitivity | Clinical Advantage |
|---|---|---|---|---|
| Acute Myeloid Leukemia (AML) | 24 colors | Combination of lineage and disease-specific markers [2] | < 0.02% [2] | Detects aberrant maturation states with high sensitivity [2] |
| B-cell Acute Lymphoblastic Leukemia (B-ALL) | 23 colors | Includes surrogate B-lineage markers (CD22, CD24, CD81) to detect antigen-loss variants [2] | < 0.001% [2] | Identifies CD19-negative clones that evade CD19-targeted therapies [2] |
| Various Hematologic Malignancies | 30+ colors | Disease-specific aberrant immunophenotypes [2] | High (specific % varies) | Comprehensive single-tube assay improves accuracy and workflow [2] |
The ability to incorporate a large number of markers in a single tube is a key strategic advantage. It allows for the simultaneous use of "backbone" lineage markers alongside multiple disease-specific markers and negative "dump" channels to exclude non-target cells. This comprehensive approach increases the specificity and sensitivity of rare cell detection, reducing the false-positive rates that can occur in conventional multi-tube approaches due to sample-to-sample carryover [2] [29].
Experimental Protocols for High-Parameter Stem Cell Analysis
To achieve reliable results in high-parameter stem cell analysis, rigorous experimental protocols must be followed. The following section outlines established methodologies for the isolation and immunophenotyping of human hematopoietic stem and progenitor cells (HSPCs), a common application in both research and clinical diagnostics.
Protocol: Isolation and Immunophenotyping of Human HSPCs
This protocol is adapted from methods used for the subfractionation of hematopoietic progenitor cells to study leukemia-initiating cells [26] and can be implemented on a spectral cytometer capable of 30+ parameters.
1. Sample Preparation and Pre-enrichment
- Obtain bone marrow or mobilized peripheral blood samples.
- Isolate mononuclear cells using density gradient centrifugation (e.g., Ficoll-Paque).
- Pre-enrich CD34+ cells using immunomagnetic beads. This step reduces total cell numbers and the cost of subsequent antibody staining [26].
- Resuspend the enriched CD34+ cell fraction in a suitable staining buffer.
2. Staining for Surface Markers
- Design a high-parameter panel based on the marker combinations in Table 3.
- Lineage Depletion: Stain cells with a cocktail of antibodies against committed lineage markers (e.g., CD2, CD3, CD11b, CD14, CD15, CD19, CD20, CD56, Glycophorin A), all conjugated to the same fluorophore. This marks differentiated cells for exclusion during analysis [26].
- Progenitor Panel Staining: Co-stain cells with antibodies defining stem and progenitor subsets. Critical markers include CD34, CD38, CD90 (Thy-1), CD123 (IL3Rα), and CD45RA [26]. If immunomagnetic selection was used, ensure the CD34 antibody for staining targets a different epitope.
- Include a viability dye to exclude dead cells.
3. Data Acquisition and Analysis on a Spectral Cytometer
- Acquire data on a spectral flow cytometer, collecting the full emission spectrum for each cell.
- Use single-stain controls to build the reference spectral library for unmixing.
- In the analysis software, apply the spectral unmixing algorithm.
- The gating strategy typically proceeds as follows:
- Gate single cells using FSC-A vs. FSC-H.
- Exclude dead cells.
- Exclude Lineage-positive (Lin+) cells.
- Within the Lin-CD34+ compartment, identify subpopulations based on CD38, CD90, CD123, and CD45RA expression as defined in Table 3 [26].
The Scientist's Toolkit: Essential Reagent Solutions
The successful execution of high-parameter stem cell analysis relies on a carefully selected set of reagents and tools.
Table 3: Key Research Reagent Solutions for Stem Cell Immunophenotyping
| Reagent / Tool | Function in Experiment | Example Specifics |
|---|---|---|
| Immunomagnetic CD34+ Kits | Pre-enrichment of the stem/progenitor compartment from a complex sample like bone marrow, reducing staining cost and improving resolution [26]. | Class II epitope binders for enrichment. |
| Lineage Depletion Cocktail | Negative selection to exclude committed T-cell, B-cell, myeloid, NK, and erythroid cells, simplifying the analysis of primitive cells [26]. | Antibodies against CD2, CD3, CD11b, CD14, CD19, CD20, etc. |
| High-Parameter Antibody Panels | Simultaneous detection of multiple stem and progenitor cell surface markers to define cellular hierarchy and functional states [27]. | Combinations of CD34, CD38, CD90, CD123, CD45RA. |
| Viability Dye | Critical for excluding dead cells, which exhibit high nonspecific antibody binding and autofluorescence, thereby improving data quality [28]. | Propidium iodide or fluorescent reactive dye. |
| Spectral Unmixing Software | Computational decomposition of the full emission spectrum into its individual fluorochrome components using a reference library [3] [27]. | Software such as SpectroFlo (Sony) or SpectroFlo (Cytek). |
| Single-Stain Controls | Essential for building an accurate reference spectral library, which is the foundation of precise unmixing [28] [27]. | Cells or beads stained with each individual fluorochrome used in the panel. |
The transition to high-parameter analysis is not merely an incremental improvement but a fundamental necessity for accurately defining and understanding stem cell populations. The extreme heterogeneity inherent to stem cells cannot be captured by low-parameter technologies, which risk oversimplifying complex biology and missing critical rare subpopulations. Spectral flow cytometry, with its ability to resolve 40 or more parameters simultaneously by capturing the full emission spectrum of fluorochromes, provides the necessary analytical power. As stem cell research increasingly moves towards clinical translation in areas like regenerative medicine and cancer therapy, the precision, depth, and reproducibility offered by spectral cytometry will be indispensable for developing reliable diagnostics, monitoring treatment efficacy, and ensuring patient safety.
Advanced Protocols for Stem Cell Characterization and Therapy Development
Spectral flow cytometry represents a transformative advancement for the analysis of complex stem cell populations, enabling a level of multiplexing that surpasses the inherent limitations of conventional flow cytometry. This guide provides an objective comparison of the two technologies, supported by experimental data and detailed protocols, to inform researchers and drug development professionals in their panel design strategies.
The comprehensive characterization of stem cell populations—including hematopoietic, mesenchymal, and induced pluripotent stem cells—requires the simultaneous detection of numerous surface and intracellular markers. This is crucial for identifying subtle subpopulations, tracking differentiation states, and assessing functional potency. Conventional flow cytometry (CFC) has been a cornerstone technique, but its utility is constrained by spectral overlap between fluorochromes, which necessitates complex compensation and limits practical panel size to approximately 18 colors [3] [2]. This restriction often forces researchers to split samples across multiple tubes, leading to increased sample consumption and potential data integration challenges.
Spectral flow cytometry (SFC) addresses this bottleneck through a fundamental shift in detection philosophy. Unlike CFC, which uses optical filters to measure a narrow emission band for each fluorochrome, SFC captures the full emission spectrum of every fluorophore across a wide range of wavelengths [5] [2]. This is achieved by using a prism or diffraction grating to scatter the emitted light, which is then detected by an array of highly sensitive detectors [5]. Advanced algorithms then deconvolute, or "unmix," these full-spectrum signals based on pre-defined reference spectra for each fluorochrome [3]. This technical difference allows SFC to resolve fluorophores with highly overlapping emission peaks, dramatically increasing the number of parameters that can be analyzed from a single sample and enabling truly deep immunophenotyping of rare stem cell subsets.
Technical Comparison: Conventional vs. Spectral Flow Cytometry
The core differences between conventional and spectral flow cytometry lie in their optical design and data processing approaches, which directly impact their capabilities for high-parameter panel design.
Detection Mechanisms: Discrete Channels vs. Full Spectrum Analysis
- Conventional Flow Cytometry: CFC relies on a system of dichroic mirrors and bandpass filters to direct specific, narrow wavelength ranges to individual photomultiplier tube (PMT) detectors. This creates a "one detector–one fluorophore" paradigm [5]. A key limitation is spectral overlap (spillover), where the emission of one fluorochrome is detected in another's channel, requiring mathematical compensation that can introduce noise and reduce resolution, especially in complex panels [3].
- Spectral Flow Cytometry: SFC replaces the complex filter system with a spectrometer. Fluorescent light is dispersed via a prism or grating and projected onto a array of detectors (e.g., 32-88 channels, depending on the instrument) [5] [15]. Each fluorochrome is identified by its unique spectral signature across all detectors, not just its peak emission. Linear unmixing algorithms then separate the combined signal from each cell into its constituent fluorophores, minimizing spillover and improving resolution [3] [2].
The table below summarizes the fundamental technical distinctions:
Table 1: Core Technical Comparison Between Conventional and Spectral Flow Cytometry
| Feature | Conventional Flow Cytometry | Spectral Flow Cytometry |
|---|---|---|
| Detection Principle | Filter-based, discrete channels | Full-spectrum acquisition |
| Key Optical Components | Dichroic mirrors, bandpass filters | Prism or diffraction grating |
| Signal Processing | Electronic or software compensation | Spectral unmixing algorithms |
| Typical Detectors | Photomultiplier Tubes (PMTs) | PMT arrays or Avalanche Photodiodes (APDs) |
| Handling of Spillover | Compensation post-acquisition | Minimized through full-spectrum unmixing |
| Autofluorescence Handling | Manually subtracted or compensated | Can be incorporated and subtracted as a separate "signal" [2] |
Quantitative Performance Data in Cell Analysis
Direct comparisons of instrument performance demonstrate the tangible benefits of SFC for high-parameter analysis. The following table synthesizes data from various commercial systems and studies.
Table 2: Performance Comparison of Conventional and Spectral Flow Cytometers
| Instrument | Technology | Max. Number of Lasers | Max. Number of Fluorescence Detectors | Practical Panel Size (Colors) |
|---|---|---|---|---|
| BD FACSymphony A5 | Conventional | 5 | 50 [5] | ~30 [5] |
| Bio-Rad ZE5 | Conventional | Not specified | 30 [5] | ~18-20 |
| BC CytoFLEX LX | Conventional | Not specified | 21 [5] | ~15-18 |
| Cytek Aurora | Spectral | 5 | 64 [5] | Up to 40+ [5] [3] |
| Agilent NovoCyte Opteon | Spectral | 5 | 73 [5] | Up to 45 [5] |
| Sony ID7000 | Spectral | 7 | 184 [5] | 44 or more [5] |
| BD FACSDiscover A8 | Spectral | 5 | 78 spectral + 6 imaging [15] | Up to 50+ [15] |
Experimental data from clinical applications underscores this performance advantage. For instance, a study validating a 24-color SFC panel for minimal residual disease (MRD) detection in acute myeloid leukemia (AML) achieved a sensitivity below 0.02% while preserving marker correlation and improving the resolution of cell maturation states [2]. Another study developed a 23-color panel for B-cell acute lymphoblastic leukemia (B-ALL) that successfully identified critical CD19-negative leukemic clones, a significant challenge in the era of CD19-targeted therapies [2]. These results highlight SFC's enhanced sensitivity and resolution, which are directly applicable to identifying rare stem cell populations or aberrant subclones.
Panel Design and Optimization for Spectral Cytometry
Designing high-parameter panels for SFC requires a different strategy than for CFC, leveraging its strengths while acknowledging new considerations.
Key Strategies for Effective Spectral Panel Design
- Leverage Broader Fluorophore Options: SFC can resolve dyes with extreme spectral overlap that are unusable in CFC. This allows for the inclusion of more bright fluorophores in a single panel. Almost all fluorescent dyes are suitable, including fluorescent proteins, small organic dyes, quantum dots, and tandem dyes [5].
- Utilize Reference Controls for Unmixing: Accurate spectral unmixing is dependent on high-quality, single-stain controls. These controls are used to build the reference spectral library for the unmixing algorithm. It is critical that these controls are performed on the same biological matrix (e.g., compensation beads or same cell type) as the experimental samples.
- Manage Autofluorescence as a Spectrum: A powerful feature of SFC is the ability to measure and account for cellular autofluorescence. The unmixing algorithm can treat autofluorescence as a distinct spectrum and subtract it, thereby improving the signal-to-noise ratio for dim markers [2].
- Mitigate Dye-Dye Interactions: Certain dye families, particularly polymer dyes ("Brilliant" dyes, NovaFluors), are prone to non-specific interactions that can cause signal artifacts. These can be mitigated by including specific buffers like Brilliant Stain Buffer or CellBlox in the staining mixture [30].
The Scientist's Toolkit: Essential Reagents for Spectral Panel Design
The following table details key reagents and their functions for optimizing spectral flow cytometry experiments.
Table 3: Essential Research Reagent Solutions for Spectral Flow Cytometry
| Reagent | Function | Application Note |
|---|---|---|
| Brilliant Stain Buffer | Prevents aggregation and non-specific interactions between polymer-based fluorescent dyes (e.g., Brilliant Violet dyes) [30]. | Use at up to 30% (v/v) in surface staining master mix. BD Horizon Brilliant Stain Buffer Plus can be used at a 4x lower volume [30]. |
| Tandem Dye Stabilizer | Prevents degradation of tandem dyes (e.g., APC-Cy7), which can break down and emit light in the channel of the constituent fluorophore [30]. | Add to blocking buffer (1:1000) and resuspension buffer to maintain dye integrity during staining and acquisition. |
| Fc Receptor Blocking Solution | Reduces non-specific antibody binding via Fc receptors on immune cells, lowering background signal. | Comprised of normal serum (e.g., rat, mouse) from the same species as the conjugated antibodies. Incubate with cells for 15 min prior to staining [30]. |
| Single-Stain Controls | Used to generate the reference spectral library for the unmixing algorithm. | Must be performed on the same instrument and using the same biological matrix as the experimental samples. |
| CellBlox | Specifically designed to reduce non-specific interactions of NovaFluor dyes [30]. | Required for panels containing NovaFluors; usage should be optimized as per manufacturer guidelines. |
Experimental Protocols for Complex Staining Panels
The following detailed protocols, adapted for high-parameter stem cell analysis, ensure high specificity and sensitivity in spectral flow cytometry.
Basic Protocol 1: Surface Staining for High-Parameter Panels
This protocol is optimized for reducing non-specific interactions when analyzing surface markers on stem cell populations [30].
Materials:
- Cells (e.g., whole bone marrow, cultured stem cells)
- Mouse serum (Thermo Fisher, cat. no. 10410)
- Rat serum (Thermo Fisher, cat. no. 10710C)
- Tandem stabilizer (BioLegend, cat. no. 421802)
- Brilliant Stain Buffer (BD Biosciences, cat. no. 566385)
- FACS buffer (PBS containing 1-2% FBS or BSA and optional 1-5mM EDTA)
- Sterilin 96-well V-bottom plates
Procedure:
- Prepare Blocking Solution: Create a mix containing mouse serum (1:3.3 dilution), rat serum (1:3.3 dilution), and tandem stabilizer (1:1000 dilution) in FACS buffer [30].
- Wash and Plate Cells: Dispense up to 10^7 cells into a V-bottom 96-well plate. Centrifuge at 300 × g for 5 minutes and decant the supernatant.
- Block Cells: Resuspend the cell pellet thoroughly in 20 µL of the prepared blocking solution. Incubate for 15 minutes at room temperature (RT), protected from light.
- Prepare Staining Master Mix: During the blocking step, prepare the antibody cocktail in a mix containing FACS buffer, Brilliant Stain Buffer (up to 30% v/v), and tandem stabilizer (1:1000) [30].
- Stain Cells: Add 100 µL of the antibody master mix directly to the 20 µL of cells in blocking solution (without washing). Mix thoroughly by pipetting. Incubate for 60 minutes at RT in the dark.
- Wash Cells: Add 120 µL of FACS buffer to each well, centrifuge at 300 × g for 5 minutes, and decant the supernatant. Repeat this wash with a larger volume of 200 µL.
- Resuspend for Acquisition: Resuspend the final cell pellet in FACS buffer containing tandem stabilizer (1:1000). Acquire data on the spectral cytometer.
Basic Protocol 2: Intracellular Staining
For staining intracellular markers (e.g., transcription factors, cytokines) following surface staining.
Procedure:
- Fix and Permeabilize Cells: After completing Basic Protocol 1 (surface staining), fix and permeabilize cells using a commercial fixation/permeabilization kit, following the manufacturer's instructions.
- Repeat Blocking Step: Resuspend the fixed and permeabilized cells in 20 µL of the same blocking solution used in Step 3 of Basic Protocol 1. Incubate for 15 minutes at RT in the dark. Note: This step is critical as permeabilization exposes more epitopes and can increase non-specific binding.
- Intracellular Staining: Add 100 µL of the intracellular antibody cocktail (prepared in permeabilization buffer) directly to the cells. Incubate for 30-60 minutes at RT in the dark.
- Wash and Acquire: Wash the cells twice with 200 µL of permeabilization buffer, then resuspend in FACS buffer for acquisition.
The diagram below illustrates the core difference in how conventional and spectral cytometers process fluorescence signals, which underpins the need for optimized protocols.
Diagram 1: Signal Processing in Conventional vs. Spectral Cytometry.
The evolution from conventional to spectral flow cytometry marks a pivotal shift for stem cell research. By overcoming the fundamental limitation of spectral overlap, SFC empowers researchers to design highly multiplexed panels that can dissect the profound heterogeneity within stem cell populations with unprecedented clarity. While the initial investment and data complexity present challenges, the benefits of increased multiplexing capacity, improved resolution, and reduced sample consumption are clear. As instrumentation and bioinformatic tools continue to advance, spectral flow cytometry is poised to become the standard for deep phenotyping, accelerating discovery and the development of stem cell-based therapies.
Application in Hematopoietic Stem Cell (HSC) Identification and Sorting
The precise identification and sorting of hematopoietic stem cells (HSCs) represent a cornerstone of modern hematological research and clinical practice. These rare cells, residing at the apex of the hematopoietic hierarchy, are responsible for life-long blood production and are crucial targets for regenerative medicine and cell-based therapies [31]. For decades, conventional flow cytometry has been the gold standard for HSC analysis, enabling their prospective isolation based on surface marker expression. However, the existing heterogeneity of the human HSC compartment imposes significant challenges in understanding their physiology and molecular constitution [31].
In recent years, spectral flow cytometry has emerged as a transformative technology that addresses key limitations of conventional systems. This comparison guide objectively evaluates the performance of spectral flow cytometry against conventional alternatives in the specific context of HSC identification and sorting. By examining experimental data across multiple parameters—including resolution, sensitivity, multiplexing capability, and data quality—this analysis provides researchers, scientists, and drug development professionals with evidence-based insights to inform their technology selection for hematopoietic stem cell research.
Technology Comparison: Performance Metrics and Experimental Data
Key Performance Characteristics
The following table summarizes the comparative performance of spectral and conventional flow cytometry systems based on published experimental data:
Table 1: Performance Comparison of Spectral vs. Conventional Flow Cytometry for HSC Analysis
| Performance Parameter | Spectral Flow Cytometry | Conventional Flow Cytometry |
|---|---|---|
| Maximum Simultaneous Parameters | 20+ colors demonstrated in HSPC panels [32] | Typically 8-13 colors in HSPC panels [32] |
| Sensitivity in HSPC Detection | Comparable or superior to conventional methods (CC > 0.98) [32] | Established reference standard |
| Data Resolution | Enhanced due to full spectrum capture [32] | Limited by filter-based detection |
| Compensation Requirements | Computational unmixing reduces compensation challenges [32] | Extensive compensation controls required |
| HSC Subpopulation Discrimination | Superior identification of rare subpopulations [32] | Limited by parameter constraints |
| MRD Detection Capability | At least comparable sensitivity to conventional methods [32] | Well-established for clinical applications |
| Workflow Efficiency | Single-tube multiparameter analysis [32] | Requires multiple tubes for high-parameter panels |
Experimental Validation Data
A direct comparative study analyzing hematopoietic stem and progenitor cell (HSPC) populations provides quantitative validation of spectral cytometry performance. When a 20-color spectral panel was compared to conventional 10-color flow cytometry for quantifying CD34+ HSPCs, the correlation was exceptionally strong (correlation coefficient > 0.98) across 46 patient samples [32]. Similarly, the myeloid/lymphoid HSPC ratio demonstrated excellent correlation between methods (CC > 0.98), confirming that spectral cytometry delivers quantitatively equivalent results to conventional systems while capturing significantly more parameters per cell [32].
The enhanced resolution of spectral flow cytometry particularly benefits the identification of rare HSC subpopulations. True long-term repopulating HSCs (LT-HSCs) represent a minuscule fraction of total nucleated cells and require specific marker combinations (lin⁻CD34⁺CD38⁻CD45RA⁻CD90⁺CD49f⁺) for precise isolation [31]. Spectral cytometry improves resolution in these complex immunophenotyping panels by minimizing fluorescence spillover and enabling more accurate population discrimination.
Experimental Protocols for HSC Analysis
Conventional Flow Cytometry Protocol for HSC Isolation
The established methodology for prospective isolation of human HSCs using conventional flow cytometry involves multiple sequential steps:
Sample Preparation: Mobilized peripheral blood (after leukapheresis) or bone marrow aspirates are collected and processed to isolate mononuclear cells via density gradient centrifugation [31].
Lineage Depletion: Cells are stained with a cocktail of lineage-specific antibodies (CD2, CD3, CD14, CD16, CD19, CD56, CD235a) to exclude differentiated cells [31].
HSC Enrichment: Magnetic-activated cell sorting (MACS) using anti-CD34 microbeads provides initial enrichment of CD34⁺ populations, significantly improving subsequent sorting efficiency [31].
Multiparameter Staining: Cells are stained with fluorochrome-conjugated antibodies against HSC markers including CD34, CD38, CD45RA, CD90, and CD49f, along with viability dyes to exclude dead cells [31].
Compensation Controls: Single-stain and unstained controls are prepared for each fluorochrome to establish compensation matrices [31].
Flow Cytometric Analysis and Sorting: Cells are analyzed using conventional flow cytometers (e.g., BD FACSAria III) with predefined gating strategies. HSCs are identified as lin⁻CD34⁺CD38⁻CD45RA⁻CD90⁺CD49f⁺ populations [31].
This protocol typically requires splitting samples across multiple tubes due to the limited parameter capacity of conventional systems, potentially introducing variability in population analysis.
Spectral Flow Cytometry Protocol for HSC Analysis
The spectral flow cytometry protocol incorporates modifications that leverage the technological advantages of full-spectrum detection:
Sample Preparation and Staining: Initial steps mirror conventional protocols through multiparameter staining, with the key difference being the ability to incorporate 20+ markers in a single tube [32].
Reference Spectrum Collection: Instead of compensation controls, single-stained samples are used to capture the full emission spectrum of each fluorochrome, creating a reference library [32].
Spectral Unmixing: During acquisition, the full emission spectrum of each cell is captured across multiple detectors. Proprietary algorithms then deconvolute these mixed signals into individual fluorochrome contributions based on the reference library [32].
High-Dimensional Data Analysis: The unmixed data is analyzed using traditional gating strategies or computational approaches such as t-SNE, UMAP, or FlowSOM for population identification [32].
A critical advantage in HSC analysis is the ability to incorporate extensive marker panels (CD34, CD38, CD45RA, CD90, CD49f, CD123, CD371, CD19, CD33, etc.) in a single tube, enabling more comprehensive immunophenotyping without sample splitting [32].
Visualization of Experimental Workflows
HSC Analysis Workflow Comparison
HSC Identification Strategy
Research Reagent Solutions for HSC Analysis
The following table details essential reagents and their applications in HSC identification and sorting protocols:
Table 2: Key Research Reagents for Hematopoietic Stem Cell Analysis
| Reagent Category | Specific Examples | Application in HSC Research |
|---|---|---|
| Lineage Depletion Cocktail | Anti-CD2, CD3, CD14, CD16, CD19, CD56, CD235a [31] | Exclusion of mature hematopoietic cells to enrich primitive populations |
| HSC Surface Markers | CD34, CD38, CD45RA, CD90 (Thy1), CD49f [31] | Definitive identification of long-term repopulating HSCs |
| Progenitor Population Markers | CD123, CD33, CD371 (CLL-1), CD19 [32] | Discrimination of multipotent and lineage-restricted progenitors |
| Viability Indicators | Fixable Viability Dyes, Propidium Iodide [31] [33] | Exclusion of dead cells to improve sort purity and data quality |
| Magnetic Enrichment Reagents | CD34 MicroBead Kit UltraPure [31] | Pre-enrichment of target populations prior to flow cytometric sorting |
| Fluorochrome Conjugates | Brilliant Violet, PE, APC, and multiple fluorophore conjugates [31] [32] | Multiparameter detection enabling high-dimensional immunophenotyping |
Advanced Applications in Hematopoietic Research
Clinical Translation and Therapeutic Applications
The precision of HSC identification directly impacts clinical outcomes in stem cell-based therapies. Recent clinical trials for sickle cell disease (SCD) utilizing autologous, genetically modified HSPCs have demonstrated variable engraftment efficacy, highlighting the critical importance of accurately characterizing the stem cell product [34]. In these trials, patients receiving higher proportions of true HSCs in the drug product showed superior engraftment and clinical improvement, underscoring the therapeutic relevance of precise HSC identification [34].
Spectral flow cytometry enhances quality control in therapeutic applications by providing more comprehensive characterization of cellular products. The technology's ability to simultaneously monitor multiple surface markers, functional states, and potential contaminants in a single tube makes it particularly valuable for manufacturing settings where cell product consistency is paramount.
Research Applications in Hematopoietic Malignancies
In malignant hematology, spectral flow cytometry enables sophisticated immunophenotyping that benefits both diagnosis and minimal residual disease (MRD) monitoring. The 20-color panel described by [32] demonstrated enhanced sensitivity in detecting aberrant immunophenotypes in acute myeloid leukemia (AML) and myelodysplastic syndromes (MDS), potentially improving MRD assessment.
Furthermore, the technology facilitates the study of leukemic stem cells (LSCs), which are critical therapeutic targets in AML. The simultaneous assessment of multiple LSC markers (CD34, CD38, CD123, CD371) alongside normal HSC markers in a single tube provides a more comprehensive picture of the hematopoietic hierarchy in malignant conditions [32].
Spectral flow cytometry represents a significant advancement in HSC identification and sorting, offering demonstrated advantages in multiparameter capability, workflow efficiency, and data quality compared to conventional flow cytometry. The experimental data confirms that spectral systems deliver equivalent quantitative results to conventional methods (with correlation coefficients >0.98) while enabling more comprehensive immunophenotyping through 20+ color panels [32].
For research applications requiring deep immunophenotyping of rare populations, such as LT-HSC characterization or leukemic stem cell analysis, spectral flow cytometry provides clear benefits. However, conventional flow cytometry remains a valid choice for more standardized applications where extensive parameter capacity is not required.
The choice between these technologies should be guided by specific research needs, considering factors such as the complexity of the hematopoietic populations under investigation, available instrumentation, and analytical expertise. As the field continues to evolve, spectral flow cytometry is positioned to become an increasingly central technology in both basic hematopoietic research and clinical cell therapy applications.
Deep Phenotyping of Mesenchymal Stem Cells (MSCs) and iPSCs
Deep phenotyping represents a transformative approach in stem cell research, moving beyond the identification of a few surface markers to encompass a high-dimensional, multiparametric characterization of cellular identity, functional state, and heterogeneity. For Mesenchymal Stem Cells (MSCs) and induced Pluripotent Stem Cells (iPSCs), this detailed profiling is crucial for ensuring purity, assessing differentiation potential, verifying safety, and ultimately developing reproducible therapeutic applications. The technological evolution from conventional to spectral flow cytometry has fundamentally reshaped our capacity for deep phenotyping, offering unprecedented resolution to dissect complex stem cell populations. [5] [2]
Conventional flow cytometry, while a cornerstone of cellular analysis, faces inherent limitations due to spectral overlap of fluorochromes, necessitating complex compensation and limiting practical panel size to approximately 18 colors. This constraint has historically forced researchers to analyze stem cell markers across multiple staggered panels or tubes, potentially missing critical correlative data at the single-cell level. [3] Spectral flow cytometry addresses these limitations by capturing the full emission spectrum of every fluorophore, employing sensitive detector arrays and advanced unmixing algorithms to resolve markers with highly overlapping emissions. This technological leap enables the simultaneous assessment of 40 or more parameters from a single sample, providing a systems-level view of stem cell phenotypes that was previously unattainable. [5] [2]
Technological Showdown: Spectral vs. Conventional Flow Cytometry
Fundamental Operational Differences
The core distinction between conventional and spectral flow cytometry lies in their detection and signal processing methodologies. Conventional flow cytometers utilize a system of dichroic mirrors and bandpass filters to direct specific wavelength ranges to discrete photomultiplier tubes (PMTs). This "one detector–one fluorophore" approach is mechanically complex, requiring more than 40 optical filters in a 12-color system, and is inherently limited by spectral overlap (spillover) between fluorochromes with adjacent emission spectra. This spillover must be corrected mathematically through compensation, a process that can introduce errors and reduce resolution, particularly in high-parameter panels. [5] [3]
In contrast, spectral flow cytometers replace the filter-based detection system with a prism or diffraction grating that disperses the full emission light from each cell across an array of highly sensitive detectors—often 32 to 64 channels. Instead of measuring a single intensity per fluorophore, the instrument captures a full spectral signature (350–850 nm) for every fluorescent label. During analysis, sophisticated linear unmixing algorithms deconvolve these composite signals by comparing them to pre-recorded reference spectra for each fluorophore used in the panel. This process not only minimizes compensation-associated errors but also allows researchers to incorporate and mathematically subtract cellular autofluorescence, significantly enhancing signal-to-noise ratio for dimly expressed markers. [5] [2]
Table 1: Technical Comparison of Conventional and Spectral Flow Cytometry
| Feature | Conventional Flow Cytometry | Spectral Flow Cytometry |
|---|---|---|
| Detection Principle | Filters & dichroic mirrors direct light to PMTs | Prism/grating disperses light to detector array |
| Signal Measurement | Intensity in narrow, predefined bands | Full emission spectrum (e.g., 400-800 nm) |
| Spectral Overlap | Managed via post-acquisition compensation | Managed via reference-based spectral unmixing |
| Typical Max Parameters | 18-27 in practice | 40+ parameters simultaneously |
| Autofluorescence | Can obscure dim signals | Can be characterized and subtracted |
| System Complexity | High (many filters, mirrors, PMTs) | Lower (fewer moving optical parts) |
| Panel Design | Requires careful compensation control | Focus on spectral separability |
Quantitative Performance Advantages in Stem Cell Research
For MSC and iPSC research, the practical advantages of spectral cytometry translate directly into enhanced analytical power. A key application is the identification and purification of specific subpopulations from heterogeneous cultures. For instance, while conventional cytometry might struggle to resolve a rare primitive MSC subset based on a combination of dim markers (e.g., SSEA-4, CD271, CD146, PDPN), spectral cytometry can clearly distinguish this population due to its superior resolution and noise reduction capabilities. [2]
Furthermore, the ability to run extensive panels in a single tube conserves precious primary cell samples—a critical consideration for MSCs derived from limited bone marrow aspirates or iPSCs from patient biopsies. Studies have validated panels of over 30 parameters on archived and cryopreserved samples, enabling robust retrospective studies and longitudinal monitoring of stem cell phenotypes. [2] This high-dimensional data captures the complex correlation between surface markers, transcription factors, and functional proteins, providing a holistic view of cellular identity that is essential for validating iPSC pluripotency or predicting MSC differentiation potential. [35]
Experimental Protocols for Deep Phenotyping
A Generalized Workflow for High-Parameter Stem Cell Analysis
The following protocol outlines a standardized approach for deep phenotyping of MSCs and iPSCs using spectral flow cytometry, synthesizing best practices from the literature. [5] [2] [36]
Step 1: Panel Design Select antibodies targeting a comprehensive set of markers that define the core identity and functional state of your stem cell population.
- For iPSCs: Include core pluripotency factors (OCT4, SOX2, NANOG, SSEA-4, TRA-1-60, TRA-1-81), differentiation lineage markers (ectoderm, mesoderm, endoderm), and apoptosis/proliferation markers (Ki-67, Annexin V). [35]
- For MSCs: Include International Society for Cell & Gene Therapy (ISCT) minimal criteria markers (CD73, CD90, CD105; lack of CD34, CD45, CD11b, CD19, HLA-DR), plus markers for subpopulation identification (CD146, CD271, SSEA-4, CD106) and functional state (MHC class I/II, co-stimulatory molecules). [5] Assign fluorochromes based on antigen abundance and spectral separability. Place bright fluorophores (e.g., PE, BV421) on low-abundance antigens and dim fluorophores (e.g., FITC, PerCP-Cy5.5) on high-abundance antigens. Utilize spectral cytometry resources and software tools to visualize and optimize the combined spectral signature of your panel.
Step 2: Sample Preparation Harvest cells using standard methods (e.g., gentle enzymatic dissociation for MSCs, EDTA or Accutase for iPSCs). Wash cells in a cold FACS buffer (PBS with 1-5% FBS or BSA). Aliquot 1-5x10^5 cells per tube. Resuspend cells in Fc receptor blocking solution (e.g., Human TruStain FcX) for 10 minutes on ice to minimize non-specific antibody binding. Add titrated antibody cocktails and incubate for 30 minutes in the dark at 4°C. Wash cells twice with FACS buffer to remove unbound antibody. If using viability dye (e.g., Zombie Aqua, DAPI), add it according to the manufacturer's instructions, typically before fixation. For intracellular staining (e.g., for OCT4, NANOG), fix and permeabilize cells using a commercial kit (e.g., FoxP3/Transcription Factor Staining Buffer Set) after surface staining.
Step 3: Instrument Setup and Quality Control
- Calibration: Run calibration beads daily to ensure laser delays and fluidics are optimized.
- Voltage Optimization: Use the "peak 2" method—running a dimly fluorescent bead sample across a voltage series and plotting the coefficient of variation (CV) against voltage—to identify the inflection point where increased voltage no longer improves resolution. [36]
- Reference Controls: Create single-stained controls for every fluorophore in the panel. These must be at least as bright as the experimental sample and have identical background. For viability dyes and fixed samples, use control cells treated identically to experimental samples.
- Validation: Run an FMO (Fluorescence Minus One) control for every marker where precise gating is critical, especially for dim populations or complex immunophenotyping.
Step 4: Data Acquisition and Unmixing Acquire data on the spectral cytometer. The software will use the pre-defined reference spectra from your single-stained controls to unmix the composite signal from each cell, generating a conventional FCS file for analysis. For large experiments, include a standardized QC bead or reference control sample at the start and end of the run to monitor instrument performance over time, tracking metrics in a Levey-Jennings plot. [36]
Diagram 1: Spectral Phenotyping Workflow
Key Signaling Pathways in Stem Cell Fate
Understanding the signaling pathways that govern self-renewal and differentiation is crucial for interpreting deep phenotyping data. For iPSCs, the core pluripotency network centered around OCT4, SOX2, and NANOG maintains the undifferentiated state, while TGF-β/Activin A and FGF signaling support self-renewal. Inhibition of BMP signaling is often necessary to prevent spontaneous differentiation. [35] [37] For MSCs, key pathways include TGF-β/BMP signaling for chondrogenic and tenogenic differentiation, Wnt/β-catenin signaling for osteogenic differentiation, and Notch signaling for cell fate decisions. [37] Deep phenotyping panels can include phospho-specific antibodies to probe the activity of these pathways at the single-cell level.
Diagram 2: iPSC Pluripotency Signaling
Comparative Experimental Data and Applications
Resolving Complex Stem Cell Populations
The superior resolution of spectral flow cytometry is demonstrated in its ability to dissect complex stem cell populations that are intractable with conventional methods. For example, in iPSC cultures, which often contain a mix of undifferentiated cells and spontaneously differentiated progenitors, a high-parameter spectral panel can simultaneously identify pluripotent cells (OCT4+, SSEA-4+, TRA-1-81+), and quantify the emergence of all three germ layers (e.g., SOX1+ ectoderm, Brachyury+ mesoderm, SOX17+ endoderm) within the same tube. This provides a comprehensive quality control metric far superior to simple pluripotency checks. [35]
Similarly, MSCs are notoriously heterogeneous, with varying proliferative capacity, differentiation potential, and immunomodulatory activity among subfractions. Spectral cytometry panels incorporating 30+ markers have successfully identified functionally distinct MSC subsets based on differential expression of CD146, CD271, PD-L1, CD106, and other markers, correlating specific immunophenotypes with in vivo functional outcomes. This resolution is critical for developing potency assays for clinical-grade MSC products. [2]
Table 2: Key Marker Panels for Deep Phenotyping
| Cell Type | Core Identity Markers | Subpopulation/Functional Markers | Exclusion Markers |
|---|---|---|---|
| iPSCs | OCT4, SOX2, NANOG, SSEA-4, TRA-1-60, TRA-1-81 | SSEA-1 (differentiation), CD30, CD50, CD90, CD24, CD342 | - |
| MSCs | CD73, CD90, CD105 | CD146, CD271, SSEA-4, CD106, CD200, PD-L1, HLA-G | CD34, CD45, CD11b, CD19, HLA-DR |
Advancing Clinical Applications: MRD and Beyond
In clinical development, spectral flow cytometry shows immense promise for monitoring stem cell-based therapies. While most advanced in hematologic malignancies for Minimal Residual Disease (MRD) detection—with validated panels achieving sensitivities below 0.02% in Acute Myeloid Leukemia—the same principles apply to monitoring the fate and purity of administered stem cell products. [2] For instance, after iPSC-derived cell transplantation, spectral panels could potentially track the grafted cells and distinguish them from host cells, while simultaneously monitoring for aberrant or unwanted cell types. The technology's capacity for high-resolution analysis in sample-limited settings (e.g., small biopsies, precious in-vitro differentiation samples) makes it ideally suited for translational stem cell research and quality control in cellular manufacturing. [2]
The Scientist's Toolkit: Essential Reagent Solutions
Successful deep phenotyping relies on a carefully selected set of reagents and tools. The following table details key solutions for spectral flow cytometry experiments. [5] [2] [36]
Table 3: Essential Research Reagent Solutions for Spectral Flow Cytometry
| Reagent/Tool | Function/Purpose | Key Considerations |
|---|---|---|
| Fluorochrome-Conjugated Antibodies | Tag specific cellular proteins (surface/intracellular) for detection. | Choose bright fluorophores (Spark, PE, BV421) for low-abundance antigens. Validate clones for specific applications. |
| Viability Dyes | Distinguish live from dead cells to exclude artifacts from non-viable cells. | Examples: Zombie dyes, DAPI, 7-AAD. Add before fixation for amine-reactive dyes. |
| Fc Receptor Blocking Solution | Reduce non-specific antibody binding, lowering background signal. | Critical for primary human cells like MSCs. Incubate before adding antibody cocktail. |
| Cell Staining Buffer | Provide an isotonic, protein-rich medium for antibody incubation and washing. | Typically PBS with 1-5% FBS or BSA. Sodium azide can be added to prevent capping. |
| Fixation & Permeabilization Buffers | Preserve cell structure and allow antibody access to intracellular targets. | Required for transcription factors (OCT4, NANOG). Use commercial kits for best results. |
| Calibration & QC Beads | Standardize instrument performance and track sensitivity over time. | Use daily for laser alignment. Include in experiments for performance tracking (Levey-Jennings). |
| Single-Stain Control Particles | Generate reference spectra for each fluorophore for spectral unmixing. | Must be brighter than sample and use identical fluorochrome-antibody conjugate. |
The paradigm shift from conventional to spectral flow cytometry marks a new era in stem cell research, transforming our ability to perform deep phenotyping of MSC and iPSC populations. By enabling the simultaneous assessment of dozens of parameters from limited biological samples, spectral technology provides a comprehensive, high-resolution view of cellular heterogeneity, functional states, and differentiation trajectories that was previously fragmented across multiple assays. As the field progresses toward more complex stem cell-based therapeutics and sophisticated in vitro models, the integration of spectral flow cytometry with other advanced technologies like artificial intelligence for data analysis and optogenetics for fate control will undoubtedly unlock deeper insights into stem cell biology, accelerating the development of safe and effective clinical applications. [2] [37] [38]
Identifying and Isulating Rare Cancer Stem Cells (CSCs)
Cancer stem cells (CSCs) represent a rare, therapy-resistant subpopulation within tumors that drive tumor initiation, progression, metastasis, and relapse [39] [40]. Their identification and isolation are paramount for developing effective cancer treatments but are complicated by their phenotypic plasticity, heterogeneity, and lack of universal surface markers [39] [41]. For years, conventional flow cytometry (CFC) has been a cornerstone technology for CSC analysis, yet its utility is constrained by its limited multiplexing capability and reliance on pre-defined markers [40]. The emergence of spectral flow cytometry (SFC) represents a paradigm shift, enabling high-dimensional analysis that captures the full complexity and dynamic functional states of CSCs [5] [2]. This guide provides a objective comparison of these technologies, detailing their performance in identifying and isolating rare CSCs and providing the experimental protocols to implement these analyses in research and drug development.
Technology Showdown: Conventional vs. Spectral Flow Cytometry
The fundamental difference between conventional and spectral flow cytometry lies in their optical detection systems and data processing approaches. Understanding these core principles is key to selecting the appropriate technology for CSC research.
Core Principles and Detection Systems
Conventional Flow Cytometry (CFC) operates on a "one detector–one fluorophore" principle. It uses a complex system of optical filters—dichroic mirrors and bandpass filters—to separate and direct narrow bands of emitted light (typically 20-50 nm wide) to specific detectors, usually photomultiplier tubes (PMTs). This approach severely limits the number of parameters that can be simultaneously analyzed due to significant spectral overlap between fluorochromes, which requires mathematical compensation and often reduces resolution [5]. Advanced conventional cytometers may have up to 50 detectors and over 40 optical filters, increasing both cost and complexity [5].
Spectral Flow Cytometry (SFC) captures the full fluorescence emission spectrum (from 350–850 nm) for each fluorophore using a prism or diffraction grating to scatter the light, which is then detected by an array of highly sensitive detectors (on average 40 or more) [5] [2]. This entire spectral signature acts as a unique fingerprint for each fluorophore. Sophisticated linear unmixing algorithms then deconvolute the composite signal from each cell into its individual fluorophore components, even when their emission peaks heavily overlap [2]. This makes SFC instruments less optically complex and cheaper to manufacture despite their advanced capabilities [5].
Table 1: Fundamental Technical Comparison of Conventional and Spectral Flow Cytometry
| Feature | Conventional Flow Cytometry | Spectral Flow Cytometry |
|---|---|---|
| Detection Principle | Optical filters (dichroic mirrors, bandpass filters) | Prism or diffraction grating |
| Signal Measurement | Narrow band (20-50 nm) around emission peak | Full emission spectrum (e.g., 350-850 nm) |
| Data Processing | Compensation for spectral overlap | Linear unmixing of full spectra |
| Typical Detectors | Photomultiplier Tubes (PMTs) | PMT arrays or semiconductor detectors |
| Multiplexing Capacity | Limited (typically 10-20 parameters) | High (30-50 parameters) |
Direct Performance Comparison for CSC Analysis
The technological differences translate into distinct performance outcomes critical for CSC research, where researchers often work with limited sample material and need to detect rare, heterogenous cell populations.
Panel Size and Marker Flexibility: CFC is typically limited to analyzing about 10-12 markers per panel due to spectral overlap, posing challenges for comprehensive CSC profiling from small tumor biopsies [40]. In contrast, SFC enables the use of 30-50 markers in a single panel, allowing for a much deeper immunophenotyping of CSCs and their microenvironment without splitting the sample [2] [40]. This is crucial given the lack of exclusive CSC markers; identification often relies on a combination of several surface and intracellular markers [40].
Resolution and Sensitivity: SFC provides superior resolution for distinguishing between cell populations with similar phenotypes. A key advantage is its ability to identify and subtract autofluorescence background, which is common in dissociated solid tumor samples, thereby enhancing the signal-to-noise ratio and revealing subtle biological differences [2]. Furthermore, on a spectral cytometer, fluorochromes like Pacific Blue and Brilliant Violet 421 (BV421)—which cannot be separated in CFC due to near-identical emission peaks—can be used together because their full spectral profiles are distinct enough for the unmixing algorithm to resolve them clearly [42].
Sample Consumption and Throughput: For rare and precious clinical samples like tumor biopsies, bone marrow aspirates, or pediatric samples, SFC offers a significant advantage. Its high-parameter capability means that a single tube can replace multiple tubes required in CFC, conserving sample material and providing more data from a limited cell count [2].
Table 2: Performance Comparison for Key CSC Research Applications
| Performance Metric | Conventional Flow Cytometry | Spectral Flow Cytometry |
|---|---|---|
| Max Panel Size | Up to ~28 parameters [42] | Up to 40-50 parameters [5] [42] |
| Signal Resolution | Limited by spectral overlap; compensation can spread error | High; resolves dyes with overlapping peaks (e.g., Pac Blue & BV421) [42] |
| Autofluorescence Handling | Difficult to separate from specific signal | Can be unmixed and subtracted as a separate component [2] |
| Ideal for Rare Sample | Limited; requires sample splitting for broad panels | Excellent; maximal data from minimal sample [2] |
| MRD/CSC Detection Sensitivity | Good (e.g., ~0.01% for leukemia) | Excellent (e.g., <0.001% for B-ALL; 0.02% for AML) [2] |
Experimental Protocols for CSC Identification and Isolation
This section provides detailed methodologies for detecting and isolating CSCs using both conventional and spectral flow cytometry, with a focus on practical implementation.
Protocol 1: Conventional Flow Cytometry for CSC Side Population Analysis
The Side Population (SP) assay is a classical functional method to identify CSCs based on their high activity of ATP-binding cassette (ABC) transporters, which efflux DNA-binding dyes like Hoechst 33342 [40].
Workflow Overview:
Diagram: Side Population Assay Workflow
Detailed Methodology:
- Sample Preparation: Create a single-cell suspension from tumor tissue or cell culture. Ensure high viability (>90%). Adjust cell concentration to 1 x 10^6 cells/mL in pre-warmed culture medium [40].
- Staining:
- Divide the cell suspension into two tubes.
- Label one tube as the test sample and the other as the control.
- Add Hoechst 33342 dye to both tubes at a final concentration of 5 µg/mL.
- To the control tube only, add an ABC transporter inhibitor like Verapamil at 50-100 µM.
- Incubation: Incubate the cells for 90 minutes at 37°C in a water bath, with gentle mixing every 20 minutes. Protect the tubes from light.
- Reaction Stop: After incubation, immediately place the tubes on ice. Wash the cells twice with ice-cold PBS containing 2% FBS.
- Propidium Iodide (PI) Staining: Resuspend the cell pellet in ice-cold buffer and add PI (1-2 µg/mL) to exclude dead cells.
- Analysis and Sorting: Analyze the cells using a flow cytometer equipped with a UV laser. Plot Hoechst Blue (450 nm) against Hoechst Red (675 nm). The Side Population appears as a distinct, verapamil-sensitive dim tail of cells. These SP cells can be sorted for downstream functional assays like tumor initiation [40].
Protocol 2: High-Parameter Immunophenotyping of CSCs with Spectral Flow Cytometry
This protocol leverages the multiplexing power of SFC to profile CSCs based on a combination of surface and intracellular markers, providing a more comprehensive picture than the SP assay alone.
Workflow Overview:
Diagram: Spectral Immunophenotyping Workflow
Detailed Methodology:
- Panel Design: Design a high-parameter panel (e.g., 30-40 colors) incorporating known CSC markers (e.g., CD44, CD133, EpCAM), lineage markers, and markers for functional states (exhaustion, activation). Prioritize bright fluorochromes for dimly expressed CSC markers [2] [42].
- Viability Staining: Resuspend the single-cell suspension in PBS and stain with a viability dye (e.g., Zombie NIR) for 15-20 minutes at room temperature, protected from light.
- Surface Staining: Wash cells and resuspend in FACS buffer. Add the pre-titrated cocktail of surface marker antibodies. Incubate for 30 minutes at 4°C, protected from light.
- Fixation and Permeabilization: Wash cells and fix using a commercial fixation/permeabilization kit (e.g., FoxP3/Transcription Factor Staining Buffer Set).
- Intracellular Staining: Wash cells with permeabilization buffer and incubate with antibodies against intracellular CSC markers (e.g., SOX2, OCT4, NANOG) for 30-60 minutes at 4°C in the dark [40].
- Data Acquisition: Acquire data on a spectral flow cytometer (e.g., Cytek Aurora). Record the full emission spectrum for every cell.
- Data Analysis:
- Use the instrument's software (e.g., SpectroFlo) to perform spectral unmixing, applying pre-recorded reference spectra for each fluorochrome to deconvolute the signals [5] [2].
- Extract the autofluorescence signal to reduce background.
- Analyze the high-dimensional data using visualization tools like t-SNE or UMAP to identify rare, complex CSC populations that might be missed with traditional gating strategies [42].
Successful execution of these protocols requires careful selection of reagents and tools. The table below details key solutions for setting up these experiments.
Table 3: Research Reagent Solutions for CSC Flow Cytometry
| Reagent/Material | Function/Purpose | Example Products/Targets |
|---|---|---|
| Viability Dyes | Distinguishes live from dead cells to ensure analysis accuracy. | Zombie Dye, Fixable Viability Stain eFluor, Propidium Iodide (PI) |
| CSC Surface Marker Antibodies | Identifies putative CSC populations based on known surface antigens. | Anti-CD44, Anti-CD133, Anti-CD24, Anti-EpCAM, Anti-CD34 [40] |
| CSC Intracellular Marker Antibodies | Detects expression of core pluripotency and stemness factors. | Anti-SOX2, Anti-OCT4, Anti-NANOG, Anti-ALDH [40] |
| Functional State Antibodies | Profiles T-cell exhaustion, activation, and memory subsets within the TME. | Anti-PD-1, Anti-LAG3, Anti-TIM3, Anti-TIGIT, Anti-Ki-67 [42] |
| Fixation/Permeabilization Kits | Enables intracellular staining by making the cell membrane permeable. | FoxP3/Transcription Factor Staining Buffer Set, Intracellular Staining Kits |
| Spectral Flow Cytometers | Instruments that capture full emission spectra for high-parameter analysis. | Cytek Aurora, Sony ID7000, BD FACSymphony A5 SE [5] |
| Data Analysis Software | Tools for spectral unmixing, visualization, and analysis of high-parameter data. | SpectroFlo, FCS Express, FlowJo (with spectral plugins), OMIQ |
The transition from conventional to spectral flow cytometry marks a significant evolution in the capacity to dissect the complexity of Cancer Stem Cells. While conventional methods like the Side Population assay remain valuable for specific functional studies, their limitations in multiplexing and resolution are evident. Spectral flow cytometry, with its ability to run 40+ color panels, resolve difficult fluorochrome combinations, and extract autofluorescence, provides an unparalleled tool for the precise identification and deep phenotypic characterization of rare CSCs. This high-resolution view is critical for advancing our understanding of CSC biology in drug discovery and development, ultimately paving the way for more effective therapies that target this treatment-resistant cell population.
Role in Organoid Analysis and 3D Cell Culture Models
The adoption of three-dimensional (3D) organoid and spheroid cultures represents a paradigm shift in biomedical research, providing model systems that more accurately mimic the structural complexity, cellular heterogeneity, and pathophysiological conditions of native tissues compared to traditional two-dimensional (2D) monolayers [43] [44]. However, the very attributes that make 3D models biologically relevant—their intricate spatial architecture, diverse cellular compositions, and internal microenvironmental gradients—also present significant analytical challenges. Conventional flow cytometry, while powerful for single-cell analysis of dissociated tissues, fundamentally disrupts the critical spatial context and cellular interactions within intact organoids. Spectral flow cytometry has emerged as a transformative technology that bridges this analytical gap, enabling high-dimensional single-cell analysis within the context of 3D culture systems without sacrificing the spatial information essential for interpreting multicellular phenomena.
The limitations of conventional flow cytometry in 3D analysis are particularly evident in pharmacodynamic studies and tumor microenvironment research, where cellular positioning and neighbor interactions directly influence drug sensitivity and resistance mechanisms [44]. As organoids incorporate multiple cell lineages—including immune, stromal, and parenchymal components—the demand for high-parameter immunophenotyping beyond the practical limits of conventional cytometry (typically 10-18 parameters) has become increasingly pressing [3] [45]. Spectral flow cytometry addresses these limitations through a fundamentally different approach to fluorescence detection and analysis, enabling researchers to deconstruct the cellular complexity of 3D systems while preserving critical functional and spatial information.
Technical Comparison: Spectral vs. Conventional Flow Cytometry
Fundamental Detection Mechanisms
The fundamental distinction between conventional and spectral flow cytometry lies in their approaches to fluorescence detection and signal separation:
Conventional Flow Cytometry employs a system of dichroic mirrors and bandpass filters to direct specific wavelength ranges to discrete detectors (typically photomultiplier tubes). This "one detector–one fluorophore" approach requires careful manual compensation to correct for spectral overlap between fluorochromes with adjacent emission spectra, a process that becomes increasingly complex and error-prone as panel size expands [5] [3].
Spectral Flow Cytometry captures the full emission spectrum (typically 400-800+ nm) of each fluorophore across an array of detectors (often 32-64 channels) using diffraction gratings or prisms. Advanced algorithms then deconvolute these composite spectra into individual fluorophore contributions based on previously established reference signatures, a process known as spectral unmixing [5] [3] [46].
Table 1: Technical Comparison of Conventional vs. Spectral Flow Cytometry
| Feature | Conventional Flow Cytometry | Spectral Flow Cytometry |
|---|---|---|
| Detection System | Dichroic mirrors & bandpass filters | Prism/diffraction grating & detector array |
| Signal Separation | Electronic compensation | Spectral unmixing algorithms |
| Detector:Fluorophore Ratio | ~1:1 | Many detectors per fluorophore |
| Autofluorescence Handling | Background subtraction | Active unmixing as separable signal |
| Maximum Practical Parameters | ~18-28 colors [3] [42] | 40-50+ colors [3] [42] [46] |
| Resolution of Similar Fluorochromes | Limited | Excellent (e.g., Pacific Blue & BV421) [42] |
Impact on 3D Organoid Analysis
These technical differences translate into distinct practical capabilities for organoid research:
Increased Parameter Capacity: Spectral cytometry enables the simultaneous assessment of 30-50 markers from limited organoid samples, which is particularly valuable for comprehensive cellular phenotyping within complex 3D structures [3] [42]. This high-dimensional analysis can resolve intricate immune cell subsets (e.g., exhausted T cells, macrophage polarization states), stromal subpopulations, and multiple differentiation lineages in a single tube, conserving precious organoid material [42].
Enhanced Resolution of Rare Events: The ability to resolve rare cell populations within organoids—such as cancer stem cells, transient progenitor states, or infiltrating immune cells—is significantly improved through reduced background and improved signal-to-noise ratios [5] [3]. This sensitivity is further enhanced by spectral unmixing of cellular autofluorescence, which conventional cytometry typically treats as undifferentiated background [46].
Fluorophore Flexibility: Spectral systems support the use of fluorochromes with highly overlapping emission spectra (e.g., Pacific Blue and Brilliant Violet 421) that would be incompatible on conventional platforms, providing greater flexibility in panel design, especially for challenging targets where antibody choice is limited [42] [46].
Figure 1: Comparative Workflow of Organoid Analysis by Conventional vs. Spectral Flow Cytometry. While both methods begin with single-cell suspension preparation, their detection capabilities yield substantially different analytical outcomes.
Experimental Approaches for 3D Model Analysis
Organoid Processing and Single-Cell Preparation
The transition from 3D organoids to single-cell suspensions suitable for flow analysis requires careful optimization to preserve cellular viability, surface epitopes, and functional states:
Mechanical Dissociation: Gentle pipetting or trituration through progressively smaller gauge needles can disperse cell aggregates while minimizing cellular stress and death [47]. For more robust organoids, spring-loaded mechanical dissociators provide standardized dissociation forces.
Enzymatic Digestion: Enzyme selection must be validated for target antigen preservation. Trypsin-EDTA, accutase, collagenase, and tumor dissociation enzymes each offer distinct advantages for specific organoid types [47]. For example, trypsin may cleave certain surface epitopes, while milder enzymes like accutase may better preserve antigen integrity.
Quality Control: Following dissociation, filtration through 30-70μm nylon meshes removes persistent aggregates that could cause instrument clogs or generate analytical artifacts [47]. DNase addition (10-100μg/mL) and calcium chelation with EDTA (1-5mM) further reduce clumping by preventing DNA-mediated and cadherin-dependent cell adhesion, respectively [47].
Staining Strategies for High-Parameter Analysis
Effective immunostaining of organoid-derived cells demands consideration of several factors:
Antibody Validation: For high-parameter panels, rigorous validation of each antibody-clone-fluorochrome combination is essential [47]. Recombinant antibodies offer advantages for spectral cytometry due to their lack of Fc-mediated binding, reducing nonspecific background [47].
Viability Discrimination: Fixable viability dyes (e.g., Zombie dyes, Live/Dead fixable stains) are critical for excluding dead cells from analysis, as organoid dissociation typically generates higher mortality rates than peripheral blood samples [42].
Intracellular Staining: For transcription factors, cytokines, and other intracellular targets, optimized fixation and permeabilization buffers must preserve both epitope recognition and spectral properties of tandem fluorophores, which can be sensitive to fixation conditions [45].
Table 2: Essential Research Reagent Solutions for Organoid Analysis by Spectral Flow Cytometry
| Reagent Category | Specific Examples | Function in Organoid Analysis |
|---|---|---|
| Dissociation Reagents | Accutase, Trypsin-EDTA, Collagenase IV, DNase I | Generate single-cell suspensions from 3D structures while preserving antigen integrity and cell viability [47]. |
| Viability Indicators | Fixable viability dyes (Zombie, Live/Dead), Propidium iodide | Distinguish live cells from dead/dying cells critical for accurate analysis of dissociation-sensitive organoid cells [42]. |
| Surface Marker Antibodies | CD45, CD3, CD4, CD8, CD19, CD11b, EpCAM | Identify major cellular lineages present within heterogenous organoids (immune, epithelial, stromal) [42]. |
| Intracellular/TF Antibodies | FoxP3, Ki-67, Cytokines, Transcription factors | Probe functional states, proliferation, and differentiation status of organoid subpopulations [45] [42]. |
| Activation/Exhaustion Markers | PD-1, TIM-3, LAG-3, TIGIT, CD25, CD69 | Characterize functional immune states within tumor organoids or inflammatory disease models [42]. |
| Fluorochrome-Conjugated Reagents | Brilliant Violet, Spark, eFluor, PE/Cyanine tandems | Enable high-parameter detection through spectrally distinct signatures for spectral unmixing [5] [46]. |
Integrated Workflow for Comprehensive Organoid Characterization
The Cellos pipeline exemplifies an advanced integrated approach that couples 3D organoid imaging with spectral cytometry analysis [44]. This methodology enables correlation of spatial information with high-dimensional immunophenotyping:
Volumetric Organoid Imaging: High-content imaging systems (e.g., PerkinElmer Opera Phenix) capture 3D structural data before dissociation, preserving information about organoid size, morphology, and spatial relationships [44].
Computational Segmentation: Custom algorithms (e.g., Stardist-3D convolutional neural network) identify individual nuclei within organoids, enabling quantification of cellular density, nuclear morphology, and neighbor interactions [44].
Spectral Cytometry Analysis: Following dissociation, cells are stained with a high-parameter antibody panel (30-40 colors) and analyzed by spectral flow cytometry to generate comprehensive immunophenotypic data [44] [42].
Data Integration: Computational integration of spatial and single-cell data reveals relationships between cellular positioning within organoids and phenotypic states, enabling insights into microenvironmental regulation of cell function [44].
Figure 2: Integrated Workflow Combining 3D Imaging with Spectral Flow Cytometry for Comprehensive Organoid Analysis. This approach preserves critical spatial information while enabling high-dimensional single-cell phenotyping.
Applications in Preclinical and Clinical Translation
Drug Screening and Pharmacological Profiling
Spectral flow cytometry has transformed organoid-based drug discovery by enabling multiplexed functional assessment beyond simple viability readouts. In a case study profiling cisplatin response in triple-negative breast cancer (TNBC) organoids, spectral analysis revealed distinct subclonal responses undetectable by conventional luminescence assays [44]. The resistant clone (A50) exhibited an IC~50~ of 10.51µM compared to 2.94µM for the more sensitive clone (B), yet the sensitive clone demonstrated a "dormancy" phenotype with enhanced survival at high drug concentrations (>IC~80~) [44]. These differential response patterns—only resolvable through high-parameter analysis—have profound implications for combination therapy design and resistance management.
Tumor Microenvironment Deconstruction
The ability to simultaneously profile immune, stromal, and malignant compartments within tumor organoids makes spectral cytometry particularly valuable for tumor microenvironment (TME) studies. Commercial panels like the Spectral Human CompLeukocyte (24 antibodies) and Spectral Human CompLymphocyte (29 antibodies) enable deep immunophenotyping of lymphoid and myeloid subsets, including exhaustion markers (PD-1, TIM-3, LAG-3, TIGIT), activation states, and differentiation profiles [42]. When applied to patient-derived tumor organoids co-cultured with autologous immune cells, these panels can identify mechanisms of immune evasion and predict immunotherapy responses.
Stem Cell and Differentiation Research
In normal and cancer stem cell research within organoid systems, spectral cytometry enables the identification of rare stem and progenitor populations through simultaneous assessment of multiple surface markers, transcription factors, and functional reporters. The technology can track differentiation trajectories in real time by monitoring the co-expression of lineage-specific markers across developmental intermediates, providing insights into normal tissue development and disease pathogenesis [48].
Comparative Experimental Data
Performance Metrics in Complex Organoid Systems
Direct comparisons of conventional and spectral flow cytometry performance in organoid analysis reveal significant differences in resolution and data quality:
Sensitivity Enhancement: Spectral cytometry demonstrates 3-5 fold improvement in signal-to-noise ratios for dim markers like transcription factors (e.g., TCF7) and low-abundance cytokine receptors, enabling more accurate quantification of expression levels in heterogenous organoid populations [42].
Population Resolution: In mixed clone experiments, spectral cytometry achieved 99% accuracy in distinguishing differentially labeled subpopulations (EGFP vs. mCherry) under drug treatment conditions where conventional cytometry showed 15-20% misclassification due to spectral overlap and autofluorescence interference [44].
Data Completeness: Analysis of ~100,000 organoids containing ~2.35 million cells demonstrated that spectral cytometry with computational integration (Cellos pipeline) captured multidimensional parameters—including nuclear morphology, spatial relationships, and 40-color immunophenotyping—that were unattainable by conventional methods [44].
Table 3: Quantitative Performance Comparison in Organoid Drug Response Studies
| Performance Metric | Conventional Flow Cytometry | Spectral Flow Cytometry |
|---|---|---|
| Maximum Resolvable Populations | 4-6 distinct subclones [45] | 10+ distinct subclones [44] |
| Detection of Rare Populations | 0.1-0.5% detection limit [45] | 0.01-0.05% detection limit [5] |
| Drug Response Accuracy | IC~50~ variability: 15-25% [44] | IC~50~ variability: 5-8% [44] |
| Autofluorescence Impact | High background in epithelial organoids | Minimal after spectral unmixing [46] |
| Multiplexed Functional Readouts | 3-5 simultaneous functions [45] | 8-12 simultaneous functions [42] |
Spectral flow cytometry represents a significant advancement over conventional flow cytometry for the analysis of 3D organoid and cell culture models, offering unprecedented capabilities for high-dimensional cellular characterization. By overcoming the spectral limitations of conventional systems, this technology enables researchers to deconstruct the complex cellular ecosystems within organoids while capturing rare populations, subtle phenotypic states, and multiplexed functional information that were previously inaccessible.
The integration of spectral cytometry with advanced computational approaches—including high-dimensional clustering, spatial analysis, and machine learning—creates a powerful framework for interrogating organoid biology in health and disease [44] [42]. As 3D model systems continue to increase in complexity and physiological relevance, spectral flow cytometry will play an increasingly vital role in translating organoid-based discoveries into clinical applications, particularly in the realms of personalized medicine, drug development, and regenerative therapy.
For researchers implementing these technologies, success depends on careful experimental design, rigorous validation of staining panels, and appropriate computational infrastructure for managing the rich, high-dimensional data generated by spectral analysis. When these elements are aligned, spectral flow cytometry provides an unmatched window into the cellular complexity of 3D model systems, accelerating both basic research and translational applications.
In the fields of clinical oncology and immunology, the precise monitoring of cell therapies and the sensitive detection of Minimal Residual Disease (MRD) are critical for patient management and treatment success. MRD refers to the small number of cancer cells that remain in a patient after treatment, which can lead to relapse if undetected. For years, conventional flow cytometry (CFC) has been a cornerstone technology for these applications. However, its limitations in simultaneously analyzing multiple parameters have restricted its resolution and sensitivity. The emergence of spectral flow cytometry (SFC) represents a significant technological shift, enabling high-dimensional analysis that is reshaping clinical diagnostics and therapy monitoring [3] [2]. This guide provides an objective comparison of both technologies, focusing on their performance in monitoring cell therapies and MRD, supported by experimental data and detailed methodologies.
Technical Comparison: Conventional vs. Spectral Flow Cytometry
The fundamental difference between conventional and spectral flow cytometry lies in their approach to capturing and interpreting fluorescent signals.
Detection Mechanisms: Filters vs. Full Spectrum
Conventional Flow Cytometry (CFC) relies on a system of optical filters and dichroic mirrors to direct specific wavelengths of light to individual detectors, typically photomultiplier tubes (PMTs). This "one detector–one fluorophore" approach is limited by spectral overlap between fluorochromes, which necessitates mathematical compensation. This process can introduce errors and ultimately restricts the number of parameters that can be reliably measured simultaneously to typically less than 20 [3] [5].
In contrast, Spectral Flow Cytometry (SFC) captures the entire emission spectrum of each fluorochrome across a wide range of wavelengths. Using a prism or diffraction grating, the emitted light is scattered and recorded by an array of detectors. Advanced algorithms then deconvolute these full spectral signatures to identify each fluorochrome, even those with highly overlapping emissions. This process, known as spectral unmixing, minimizes the need for compensation and allows for the simultaneous analysis of up to 40 parameters from a single cell [3] [5] [2].
Operational Advantages and Challenges
The table below summarizes the core operational differences and their practical implications.
Table 1: Core Technical and Operational Comparison between Conventional and Spectral Flow Cytometry
| Feature | Conventional Flow Cytometry | Spectral Flow Cytometry |
|---|---|---|
| Detection Principle | Discrete optical filters and photomultiplier tubes (PMTs) [5] | Full spectrum capture via prism/grating and detector arrays [5] |
| Spectral Resolution | Limited to peak emission; requires compensation for overlap [3] | High; uses full spectral signature for unmixing, reducing spillover [3] [2] |
| Maximum Parameters (per cell) | ~18-20 colors practically [3] [5] | Up to 40-45 colors [3] [5] |
| Autofluorescence Handling | Can obscure signals, limiting resolution [2] | Can be computationally extracted, improving signal clarity [2] |
| Panel Design Complexity | High, due to compensation challenges and limited channel space [3] | More flexible, but requires careful fluorochrome selection and reference controls [49] [2] |
| Data Output | Listmode data for pre-defined channels [5] | Full spectrum data for every cell, enabling re-analysis [5] |
Diagram 1: Workflow comparison of Conventional versus Spectral Flow Cytometry.
Performance Benchmarking in Key Clinical Applications
Minimal Residual Disease (MRD) Detection
MRD detection is a cornerstone of modern hematologic malignancy management, requiring extreme sensitivity and specificity. Studies directly comparing CFC and SFC for MRD demonstrate SFC's superior performance.
A landmark study on B-cell Acute Lymphoblastic Leukemia (B-ALL) developed a single-tube 23-color SFC panel and compared it to a standard 8-color CFC panel. The SFC panel achieved a reproducible sensitivity of 0.001% (1-in-100,000 cells) after acquiring 4.8 million cells. In contrast, the conventional 8-color MRD panel has a typical reliable sensitivity of 0.01% (1-in-10,000 cells). Crucially, in cases where results were discordant, relapse occurred only in patients with SFC MRD-positive/CFC MRD-negative results, not the reverse, indicating SFC's higher predictive power for relapse [50].
Another validation study on pediatric B-ALL confirmed the feasibility of integrating a 24-color SFC panel into a clinical workflow. The study highlighted that SFC allowed the integration of all necessary backbone and aberrant markers into a single tube, reducing sample consumption and tube-to-tube variability compared to multi-tube conventional panels [49].
Table 2: Performance Comparison in MRD Detection for B-ALL
| Performance Metric | Conventional FC (8-color) | Spectral FC (23-24 color) |
|---|---|---|
| Demonstrated Sensitivity | 0.01% (1-in-10,000) [50] | 0.001% (1-in-100,000) [50] |
| Panel Integration | Requires multiple tubes (e.g., 2-3) for full marker set [49] | Single-tube comprehensive panel [49] [50] |
| Key Advantage | Standardized, widely available | Higher sensitivity and specificity for relapse prediction [50] |
| Clinical Impact | Standard for risk stratification | Enables ultra-sensitive monitoring; detects antigen-loss clones [2] |
Monitoring Cell Therapies (e.g., CAR-T)
The monitoring of Cellular Immunotherapies, such as Chimeric Antigen Receptor T-cell (CAR-T) therapy, demands simultaneous analysis of CAR-T cell kinetics, patient immune reconstitution, and residual disease. SFC is uniquely positioned for this multi-faceted challenge.
In CD19-directed CAR-T therapy for B-cell malignancies, SFC allows for the deep phenotyping of CAR-T products and the tracking of persistence and exhaustion markers. For instance, high-dimensional SFC panels have identified cellular phenotypes associated with therapeutic response, such as an enrichment of PD-1+ CD8+ CAR-T subsets in responders and infusion products rich in CCR7+ early-memory cells predicting favorable outcomes [2].
A key advantage of SFC in this context is its ability to handle volume-limited samples (e.g., post-chemotherapy bone marrow aspirates) where comprehensive multi-tube conventional panels are not feasible. SFC's single-tube, high-parameter panels provide a complete picture from a minimal sample volume, which is critical for pediatric patients and longitudinal monitoring [2].
Experimental Protocols for Validation
For researchers seeking to implement or validate these technologies, the following protocols from cited studies provide a framework.
Protocol: Validation of a High-Parameter SFC MRD Panel
This protocol is adapted from the 23-color B-ALL MRD panel study [50] and the 24-color panel validation [49].
1. Panel Design:
- Marker Selection: Combine backbone markers (CD19, CD45, CD34, CD10) with markers for aberrant expression (e.g., CD9, CD123, CD66c) and lineage infidelity markers (CD13, CD33, CD56).
- Fluorochrome Assignment: Assign bright fluorochromes (e.g., Spark NIR, PE) to low-abundance antigens and dimmer ones (e.g., FITC, Pacific Blue) to highly expressed antigens. Use pre-design software (e.g., Cytek Cloud) to simulate panel complexity and avoid fluorochrome combinations with excessive similarity (>0.95) [49].
2. Antibody Titration and Validation:
- Perform serial dilution of each antibody (e.g., 6-point titration) using patient-derived primary cells.
- Calculate the Stain Index (SI) for each dilution using the formula:
SI = (MFI_positive - MFI_negative) / (2 × rSD_negative), where MFI is median fluorescence intensity and rSD is the robust standard deviation. - Select the antibody volume that provides the highest Stain Index for optimal signal-to-noise ratio [49].
3. Sample Staining and Acquisition:
- Use an erythrocyte bulk-lysis protocol.
- Incubate 100 µL of sample with the antibody cocktail for 20 minutes at room temperature in the dark.
- Wash with PBS, resuspend in buffer, and acquire on the spectral cytometer.
- Acquire a high number of events (e.g., 3-5 million) for MRD detection to achieve a low LOD [49] [50].
4. Data Analysis:
- Manually gate to remove doublets, debris, and dead cells.
- Identify leukemic populations based on established Leukemia-Associated Immunophenotypes (LAIPs), such as asynchronous antigen expression, overexpression, or underexpression compared to normal precursors.
- Back-gate potential MRD events on FSC/SSC and CD45/SSC plots to confirm a uniform cellular cluster [49] [50].
Protocol: SFC for CAR-T Cell Monitoring
This protocol is synthesized from reviews on SFC in pharmaceutical and clinical trial settings [2].
1. Panel Design for CAR-T Monitoring:
- Design a panel that simultaneously captures:
- CAR-T Cell Identity and Phenotype: Include CAR detection reagent, T-cell lineage markers (CD3, CD4, CD8), memory/differentiation markers (CD45RA, CCR7, CD62L), and exhaustion markers (PD-1, LAG-3, TIM-3).
- Immune Context: Include B-cell markers (CD19, CD20) to monitor target cells and innate immune markers.
- Viability: Include a live/dead stain.
2. Sample Processing:
- Apply the panel to peripheral blood mononuclear cells (PBMCs) or bone marrow aspirates from patients pre- and post-CAR-T infusion.
- For longitudinal studies, use cryopreserved samples, as SFC has been validated for use with archived specimens [2].
3. Data Analysis and Biomarker Discovery:
- Use high-dimensional analysis techniques (e.g., t-SNE, UMAP) to visualize complex cellular subsets.
- Correlate specific CAR-T cell phenotypes (e.g., early-memory vs. exhausted subsets) in the infusion product or post-infusion with clinical outcomes like response and toxicity [2].
The Scientist's Toolkit: Essential Research Reagent Solutions
Successful implementation of high-parameter SFC relies on carefully selected reagents and tools. The following table details key solutions for panel design and validation.
Table 3: Essential Research Reagent Solutions for Spectral Flow Cytometry
| Reagent / Solution | Function / Description | Example Fluorochromes & Technologies |
|---|---|---|
| Bright Tandem Dyes | For detecting low-density antigens; provides intense fluorescence. | Spark & Spark PLUS dyes (BioLegend); Brilliant Violet dyes [5] [2] |
| Small Organic Dyes | Classic, well-characterized fluorochromes for highly expressed antigens. | Vio dyes (Miltenyi); eFluor dyes (Thermo Fisher) [5] |
| Fluorescent Proteins | Used in genetically engineered cell models, such as CAR-T cells. | GFP, RFP, and their variants [5] |
| Viability Stains | Distinguish live cells from dead cells to improve data quality. | Fixable viability dyes (e.g., Zombie NIR) [49] |
| Antibody Titration Kits | Pre-packaged kits to streamline the optimization of antibody volumes. | Available from various manufacturers (e.g., Cytek, BioLegend) [49] |
| Reference Controls | Essential for building spectral libraries for unmixing algorithms. | Single-stained controls, unstained cells, and negative/positive population controls [49] [2] |
Diagram 2: A generalized workflow for clinical sample analysis using Spectral Flow Cytometry.
The transition from conventional to spectral flow cytometry marks a significant evolution in clinical cellular analysis. Objective comparison of experimental data confirms that SFC provides tangible advantages in sensitivity, multiplexing capability, and efficiency for critical applications like MRD detection and cell therapy monitoring. While CFC remains a robust and standardized technology, SFC's ability to deliver high-dimensional data from a single tube, especially with limited sample volumes, positions it as a powerful tool for advancing personalized medicine. The initial challenges of panel design and data complexity are being addressed through improved software and standardized protocols, facilitating its growing integration into clinical and pharmaceutical workflows.
Overcoming Challenges in High-Parameter Stem Cell Analysis
Addressing Spectral Unmixing Errors and Autofluorescence
Spectral flow cytometry represents a significant evolution from conventional flow cytometry, enabling deep cellular characterization through full-spectrum fluorescence analysis. Unlike conventional flow cytometry, which uses filters to measure a small portion of emission and requires compensation to correct spillover, spectral flow cytometry captures the entire emission spectrum across all lasers and employs mathematical unmixing algorithms to distinguish fluorophores [51] [52]. This technological shift allows for panels of up to 40 colors but introduces new challenges, particularly in spectral unmixing accuracy and autofluorescence management [51] [53]. Spectral unmixing errors manifest as 'swooping data,' non-round negative populations, and false positives, ultimately compromising data reliability [51]. Simultaneously, cellular autofluorescence—the inherent background fluorescence from intracellular molecules—can obscure specific signals and introduce errors if not properly handled [53] [54]. This guide systematically addresses these critical issues through experimental comparisons and optimized protocols, providing researchers with actionable strategies to enhance data integrity in spectral flow cytometry, with particular relevance to stem cell research where population resolution is paramount.
Technological Comparison: Conventional vs. Spectral Flow Cytometry
The fundamental difference between conventional and spectral flow cytometry lies in their approach to detecting and resolving fluorescent signals. Conventional flow cytometry utilizes a series of mirrors and bandpass filters to direct specific wavelength ranges to dedicated detectors, typically measuring only the peak emission of each fluorophore [52] [7]. This approach creates a direct correspondence where one detector identifies one fluorophore. However, the broad emission spectra of fluorophores often cause "spillover" into neighboring detectors, requiring mathematical compensation to subtract this overlapping signal [52] [7]. This compensation process becomes increasingly complex with larger panels and can limit conventional cytometry to approximately 15-20 parameters [52].
In contrast, spectral flow cytometry employs array detectors to measure the complete fluorescence emission spectrum across many wavelengths for each cell [52] [53]. Rather than assigning fluorophores to specific detectors, the system captures a full spectral signature for every fluorescent molecule. Sophisticated algorithms then "unmix" the combined signal from multicolor samples by comparing them to reference spectra from single-color controls [51] [7]. This holistic approach enables several key advantages: it allows differentiation of fluorophores with highly overlapping emissions, supports larger panels (up to 40+ colors), and provides the unique capability to extract and subtract cellular autofluorescence [7] [53].
Table 1: Fundamental Differences Between Conventional and Spectral Flow Cytometry
| Feature | Conventional Flow Cytometry | Spectral Flow Cytometry |
|---|---|---|
| Signal Detection | Narrow bandpass filters measure peak emission | Full spectrum acquisition across multiple detectors |
| Spillover Correction | Compensation mathematically subtracts overlap | Unmixing algorithms separate complete spectral signatures |
| Fluorophore Identification | One primary detector per fluorophore | All detectors contribute to identifying all fluorophores |
| Panel Size Limit | ~15-20 colors | ~30-40+ colors |
| Autofluorescence Handling | Limited to standard compensation | Can be extracted as a separate component |
| Key Mathematical Process | Compensation matrix calculation | Least squares unmixing algorithms |
Understanding and Identifying Spectral Unmixing Errors
Spectral unmixing errors occur when the algorithm inaccurately separates the contributions of individual fluorophores in a multicolor sample. These inaccuracies typically stem from mismatches between the reference controls and the actual spectral signatures present in the experimental samples [51]. Visually, these errors manifest as distinct patterns in the data that deviate from expected distributions. Common indicators include 'swooping' positive populations that curve unnaturally, non-spherical negative populations that should be round, and the appearance of 'ultra-negative' events that fall below baseline levels [51]. These artifacts suggest that fluorescence is being incorrectly assigned between channels.
The root causes of unmixing errors are often traced to suboptimal reference controls. According to core facility experts, the secret to accurate unmixing lies in the quality of single-color controls [51]. Specific issues include reference controls with insufficient brightness, where the positive peak is dimmer than in the multicolor sample; mismatched autofluorescence between positive and negative control populations; using different fluorophore lots between controls and experimental samples, particularly problematic for tandem dyes; and applying different staining or fixation conditions that alter fluorescence properties [51]. Each of these factors introduces discrepancies that the unmixing algorithm cannot correct, leading to propagated errors throughout the dataset.
Table 2: Common Spectral Unmixing Errors and Their Causes
| Error Type | Visual Manifestation | Primary Cause |
|---|---|---|
| Swooping Populations | Positive populations curve or bend unnaturally | Mismatched autofluorescence between reference control and sample |
| Non-Round Negatives | Negative populations appear elongated or irregular | Incorrect reference spectrum, often from control beads instead of cells |
| Ultra-Negative Events | Events appear below the baseline axis | Contaminated reference control or breakdown of tandem dyes |
| Increased Spread | Broader distribution in histogram plots | High similarity index between fluorophores in the panel |
| Multiple Positive Peaks | Unexpected peaks in reference controls | Tandem dye degradation or contamination of control |
The similarity index and complexity index are crucial metrics for predicting potential unmixing challenges. The similarity index quantifies how similar the spectra of two fluorophores are on a scale from 0 (completely unique) to 1 (identical), with values <0.98 generally required for successful unmixing [51]. The complexity index measures the overall similarity of all fluorophores in a panel, where lower values indicate better panel design [51]. Panels with high complexity indices are more prone to unmixing errors, particularly when highly similar fluorophores are assigned to antigens expressed on the same cell population [7].
Spectral Unmixing Error Pathways: This diagram illustrates the primary causes and manifestations of spectral unmixing errors, highlighting how suboptimal controls, autofluorescence mismatches, and poor panel design contribute to data artifacts.
Best Practices for Accurate Spectral Unmixing
Reference Control Fundamentals
The foundation of accurate spectral unmixing lies in implementing rigorous protocols for reference control preparation. Based on core facility expertise, reference controls must adhere to five fundamental rules to ensure they properly represent the spectral signatures in experimental samples [51]:
- Bright is Better: The positive peak in reference controls must be at least as bright as in the multicolor sample. Dim controls fail to accurately represent the full spectral signature, leading to incomplete unmixing [51].
- Like-With-Like Autofluorescence: The autofluorescence of the positive and negative populations must be identical. This is particularly critical for viability dyes, where dead cells are inherently more autofluorescent than live cells. For such markers, heat-kill cells and stain half for the positive control while using the unstained half as the autofluorescence-matched negative [51].
- Matched Fluorophore: The identical fluorophore must be used in controls and experiments. Substitutions such as GFP for FITC are not acceptable despite similar emission profiles [51].
- Same Tandem Dye Lot: Tandem dyes exhibit significant lot-to-lot variation. The same manufacturing lot must be used for controls and experimental samples to ensure consistent spectral signatures [51].
- Identical Staining Conditions: Fluorophores must be exposed to the same buffers, fixatives, and permeabilization reagents in controls as in experimental samples, as these treatments can alter fluorescence properties [51].
Beads Versus Cells for Reference Controls
The choice between compensation beads and cells for reference controls requires careful consideration, as each approach offers distinct advantages and limitations. While beads provide convenience and a strong positive signal, they may not always accurately replicate the spectral signature when fluorophores are bound to cellular proteins [51] [7]. The recommended practice is to initially compare both beads and cells for each fluorophore by overlaying their normalized spectra [51]. If the spectra differ significantly, cellular controls are necessary for that specific fluorophore. This is particularly important for tandem dyes, which may exhibit stability issues, and for antigens that undergo internalization or conformational changes when bound by antibodies [51].
Advanced Autofluorescence Management
Autofluorescence extraction represents a powerful feature of spectral flow cytometry, but its effectiveness depends on appropriate implementation. A common mistake is setting the autofluorescence extraction gate on all cellular events, including debris, dead cells, and multiple cell types [54]. Since the algorithm calculates a median autofluorescence signature from the gated population, a heterogeneous gate produces a composite signature that does not accurately represent any specific cell type [54]. Instead, researchers should apply the same gating strategy used for their final analysis when defining autofluorescence extraction. For heterogeneous samples containing cell types with distinct autofluorescence profiles (such as microglia versus lymphocytes in brain tissue), cell type-specific gating for autofluorescence extraction yields superior results [54]. Additionally, including unstained controls for each tissue type processed identically to experimental samples is essential for accurate autofluorescence extraction [7].
Experimental Protocols for Error Resolution
Protocol 1: Validation of Reference Controls
This protocol ensures that reference controls accurately represent spectral signatures in experimental samples, forming the foundation of reliable unmixing.
Materials:
- Single-color stained cells (test sample)
- Single-color stained compensation beads (comparison)
- Multicolor stained experimental sample
- Unstained cells/beads
- Spectral flow cytometer
Methodology:
- Prepare single-color controls using both cells and beads for each fluorophore in the panel, following the "five rules" outlined in Section 4.1 [51].
- Acquire all single-color controls and the multicolor experimental sample on the spectral cytometer.
- In analysis software, normalize and overlay the spectral signatures from cellular versus bead-based controls for each fluorophore.
- Quantitatively compare the spectral shapes by examining peak locations, relative intensities across detectors, and overall profile.
- For any fluorophore where the bead and cell signatures differ significantly (assessed by visual inspection or similarity index calculation), use cellular controls for unmixing that specific fluorophore [51].
- Compare the histogram of each fluorophore from the single stain versus the multicolor sample. Increased spread in the multicolor sample indicates potential unmixing issues requiring panel optimization [51].
Protocol 2: Diagnosis of Unmixing Errors
This systematic approach identifies and troubleshoots unmixing errors in acquired data.
Materials:
- Acquired spectral data file with unmixing errors
- Analysis software (e.g., SpectroFlo, FlowJo)
- Reference control data
Methodology:
- Create NxN plots displaying all fluorophore combinations in the panel to identify populations with abnormal patterns [51].
- Identify specific error types: swooping positive populations, non-round negative populations, or ultra-negative events [51].
- Correlate errors with potential causes from Table 2, focusing on fluorophores with high similarity indices or problematic reference controls.
- Check reference controls for contamination by gating on negative populations and verifying they remain negative across all channels [51].
- Examine single-color controls for multiple positive peaks, which may indicate tandem dye breakdown or contamination [51].
- Implement iterative correction by replacing problematic reference controls or applying limited compensation only as a last resort [51].
Protocol 3: Autofluorescence Extraction Optimization
This protocol optimizes autofluorescence extraction for different sample types, particularly relevant for stem cell research involving heterogeneous tissues.
Materials:
- Unstained control samples for each tissue type
- Spectral flow cytometer with autofluorescence extraction capability
- Viability dye
Methodology:
- Process unstained controls for each tissue type identically to experimental samples [7].
- Acquire unstained controls using the same instrument settings as experimental samples.
- Apply standard gating to exclude debris, doublets, and dead cells [54].
- For heterogeneous samples (e.g., whole tissue digests), create multiple autofluorescence gates for distinct cell populations with different autofluorescence properties (e.g., microglia versus lymphocytes in brain tissue) [54].
- Extract separate autofluorescence signatures for each major population rather than using a composite signature from all cells [54].
- Validate extraction quality by comparing population resolution before and after autofluorescence subtraction, aiming for improved separation of positive and negative populations without introducing distortion [53] [54].
The Scientist's Toolkit: Essential Research Reagents
Table 3: Essential Research Reagents for Spectral Flow Cytometry
| Reagent/Category | Function | Special Considerations |
|---|---|---|
| Single-Color Controls | Determine reference spectral signatures for unmixing | Must follow the "five rules": brightness, matched autofluorescence, identical fluorophore, same tandem dye lot, identical conditions [51] |
| Compensation Beads | Provide consistent positive signal for antibody capture | Validate against cellular controls; may not be suitable for all fluorophores due to potential spectral distortion upon antibody binding [51] [7] |
| Viability Dyes | Distinguish live/dead cells | Required for excluding dead cells with higher autofluorescence; use autofluorescence-matched controls [51] |
| Tandem Dyes | Expand panel possibilities | Prone to lot-to-lot variation and breakdown; always use the same lot for controls and experiments [51] [7] |
| UltraPure Buffers | Maintain consistent staining conditions | Identical buffer composition between controls and experiments prevents fluorescence alterations [51] |
| Reference Library | Archive validated control spectra | Enables control reuse; validate stability monthly [51] |
Autofluorescence Extraction Workflow: This workflow illustrates the recommended approach for targeted autofluorescence extraction, emphasizing the importance of population-specific gating rather than using composite signatures from heterogeneous cell mixtures.
Spectral unmixing errors and autofluorescence present significant challenges in spectral flow cytometry, particularly as researchers push the boundaries of panel complexity in stem cell research. The strategies outlined in this guide—emphasizing rigorous reference control preparation, appropriate bead versus cell control selection, and optimized autofluorescence extraction—provide a systematic approach to addressing these challenges. By implementing these protocols and utilizing the essential research reagents detailed in our toolkit, researchers can significantly improve unmixing accuracy and data reliability. As spectral technology continues to evolve, with emerging applications in minimal residual disease detection and high-dimensional immune monitoring, mastering these fundamental principles becomes increasingly critical for generating robust, reproducible data in both basic research and clinical applications [53].
Optimizing Protocols for Solid Tissue Dissociation and Rare Cell Detection
The evolution of single-cell analysis in stem cell research demands robust methods for solid tissue dissociation and high-sensitivity rare cell detection. This guide compares conventional and spectral flow cytometry approaches, providing detailed protocols and data to inform your experimental design.
Effective single-cell analysis, a cornerstone of modern stem cell and immunology research, hinges on two critical steps: the gentle yet efficient dissociation of solid tissues into viable single-cell suspensions, and the high-resolution detection of rare cell populations within those suspensions. Traditional enzymatic and mechanical dissociation methods often face significant challenges, including reduced cell viability, long processing times, and the loss of rare cell populations [55]. Similarly, conventional flow cytometry (CFC) is limited by spectral overlap, restricting the number of parameters that can be analyzed simultaneously and impairing the ability to resolve rare cells, such as minimal residual disease (MRD) in leukemias or rare stem cell subtypes [3].
The emergence of spectral flow cytometry (SFC) represents a paradigm shift. By capturing the full emission spectrum of each fluorochrome instead of isolated wavelengths, SFC enables high-dimensional analysis of up to 40 parameters in a single tube. This dramatically improves the resolution of complex cell populations and rare cell phenotypes [3] [5] [2]. This guide objectively compares dissociation protocols and analytical platforms, providing the experimental data and methodologies needed to optimize your workflow for the most challenging applications in stem cell research and drug development.
Solid Tissue Dissociation Protocol Comparison
The process of dissociating solid tissues into single-cell suspensions is a major source of technical variability. The ideal method maximizes cell yield and viability while preserving cell surface markers and rare populations. The table below summarizes the performance of current state-of-the-art technologies.
Table 1: Performance Comparison of Modern Tissue Dissociation Technologies
| Technology | Dissociation Type | Tissue Type (Example) | Cell Viability | Time | Key Advantage |
|---|---|---|---|---|---|
| Hypersonic Levitation & Spinning (HLS) [56] | Ultrasound (Non-contact) | Human Renal Cancer | 92.3% | 15 min | Exceptional rare cell preservation; contactless |
| Optimized Chemical-Mechanical [55] | Enzymatic & Mechanical | Bovine Liver Tissue | >90% | 15 min | High speed and high viability |
| Automated Mechanical Grinder [55] | Mechanical & Enzymatic | Mouse Lung/Kidney | 50%-80% | ~1 hr | Automated workflow |
| Mixed Modal Microfluidic [55] | Microfluidic & Enzymatic | Mouse Kidney/Breast Tumor | 50%-95% (varies by cell type) | 20-60 min | Precise control; integrated workflow |
| Electric Field Dissociation [55] | Electrical | Bovine Liver, Glioblastoma | ~80% | 5 min | Rapidest processing time |
Detailed Experimental Protocol: Hypersonic Levitation and Spinning (HLS)
The HLS method represents a revolutionary, non-contact approach. The following protocol is adapted from comprehensive experiments on human renal cancer tissue [56].
- Principle: A uniquely designed triple-acoustic resonator probe generates GHz-frequency acoustic waves. This causes the target tissue sample to levitate and execute a 'press-and-rotate' operation within a confined flow field. The process generates microscale 'liquid jets' that exert precise hydrodynamic forces, enhancing shear stress to dissociate the tissue without direct physical contact [56].
- Apparatus Setup: The automated HLS apparatus integrates a dissociation chamber with a conical confinement structure, an acoustic resonator probe, and modules for fluid replacement, filtration, and single-cell output [56].
- Step-by-Step Workflow:
- Sample Preparation: Place a freshly harvested tissue sample (e.g., up to 1 cm³) into the digestion chamber of the HLS apparatus.
- Buffer Addition: Fill the chamber with an appropriate enzyme solution (e.g., collagenase-based) to submerge the tissue.
- Acoustic Activation: Activate the hypersonic probe. The tissue will begin to levitate and spin rapidly (e.g., at several hundred RPMs).
- Dissociation: Run the system for 15 minutes. The combined effect of hydrodynamic shear and enhanced enzyme penetration dissociates the tissue.
- Cell Collection: The automated system flushes the dissociated single-cell suspension through a filter into a collection chamber, ready for washing and downstream analysis.
- Validation: Post-dissociation analysis via flow cytometry, primary cell culture, and scRNA-seq confirmed a 92.3% cell viability and a 90% tissue utilization rate, significantly outperforming traditional methods. Crucially, it excelled at preserving fragile and rare cell populations [56].
The following diagram illustrates the core operational principle of the HLS technology.
Detailed Experimental Protocol: Optimized Chemical-Mechanical Workflow
For labs without access to specialized acoustic equipment, a well-optimized chemical-mechanical workflow remains a highly effective choice [55].
- Principle: This method combines controlled enzymatic digestion to break down the extracellular matrix with gentle mechanical agitation to disperse the tissue. The synergy allows for shorter enzyme exposure times, preserving cell surface epitopes [55].
- Reagents:
- Collagenase: Degrades collagen, a primary component of the ECM.
- Hyaluronidase: Degrades hyaluronic acid in the ECM.
- EDTA: A chelating agent that disrupts cell adhesion by binding calcium ions.
- PBS/Buffered Saline: Provides a physiologically compatible environment.
- Step-by-Step Workflow:
- Tissue Mincing: Using a sterile scalpel, mince the tissue into fine fragments (∼1-2 mm³) in a petri dish on ice.
- Enzyme Incubation: Transfer the minced tissue to a tube containing a pre-warmed enzyme cocktail (e.g., Collagenase IV 1-2 mg/mL, Hyaluronidase 0.5 mg/mL, 50 µM EDTA in PBS).
- Incubation with Agitation: Incubate the tube at 37°C for 15 minutes with constant, gentle agitation on a tube rotator or orbital shaker.
- Mechanical Disruption: After incubation, pipet the tissue suspension up and down 10-15 times using a serological pipette to further dissociate clumps.
- Reaction Termination & Filtration: Add a cold buffer containing serum or a protease inhibitor to stop the enzymatic reaction. Pass the suspension through a 70 µm cell strainer to remove debris and obtain a single-cell suspension.
- Washing: Centrifuge the cell suspension and resuspend the pellet in a suitable buffer (e.g., FACS buffer) for analysis or culture.
- Validation: This optimized protocol achieved over 90% viability with bovine liver tissue and MDA-MB-231 breast cancer cells, processing samples in just 15 minutes [55].
Instrumentation Face-Off: Spectral vs. Conventional Flow Cytometry
The choice of analytical platform is paramount for rare cell detection. The core difference lies in the detection system, which fundamentally impacts multiplexing capability and data accuracy.
Table 2: Spectral vs. Conventional Flow Cytometry: A Technical Comparison
| Feature | Conventional Flow Cytometry (CFC) | Spectral Flow Cytometry (SFC) |
|---|---|---|
| Detection Principle | Bandpass filters & dichroic mirrors; "one detector-one fluorophore" [3] [5] | Prism/grating disperses light; full spectrum captured by detector array [3] [5] |
| Spectral Overlap | Managed via compensation, introduces errors [3] | Managed via spectral unmixing, higher accuracy [5] [2] |
| Max Practical Parameters | ~18-28 colors [3] [42] | 40+ colors in a single tube [3] [2] [42] |
| Autofluorescence | Can obscure signals, hard to separate [2] | Can be characterized and subtracted using algorithms [2] |
| Best For | Lower-parameter panels, routine immunophenotyping | High-dimensional immunophenotyping, rare cell detection, complex samples |
Key Instrument Models and Specifications
The following table summarizes the capabilities of several state-of-the-art spectral flow cytometers available on the market, illustrating the rapid advancement in this field.
Table 3: Current Spectral Flow Cytometry Instrumentation (2025)
| Instrument Model | Lasers | Detection Channels | Max Colors in Panel | Key Feature |
|---|---|---|---|---|
| BD FACSDiscover A8 [15] | 5 (349-637 nm) | 86 (78 spectral fluorescence) | 50+ | Integrated real-time spectral imaging |
| Cytek Aurora Evo [15] | 5 (355-640 nm) | 64 fluorescent | 40 | Enhanced throughput & built-in nanoparticle detection |
| Invitrogen Attune Xenith [15] | 6 (349-781 nm) | 51 fluorescent | 32 | Acoustic focusing for high-throughput, clog-resistant |
| Sony ID7000 [5] | 7 (320-808 nm) | 184 fluorescent | 44 or more | High laser count for maximum flexibility |
The Scientist's Toolkit: Essential Reagent Solutions
Building a successful high-parameter panel requires careful selection of reagents. The following table details key components for a spectral flow cytometry experiment focused on deep immunophenotyping.
Table 4: Key Research Reagent Solutions for Spectral Flow Cytometry
| Reagent / Material | Function / Description | Example Use Case |
|---|---|---|
| Spark PLUS Dyes [5] | Bright, photostable small organic fluorochromes | Ideal for detecting dimly expressed surface markers |
| Brilliant Violet Dyes [5] | Polymer-based dyes with high signal intensity | Backbone markers (e.g., CD45, CD3) in high-parameter panels |
| Tandem Dyes (e.g., PE-Cy7) [5] | Fluorescence resonance energy transfer (FRET)-based dyes | Expanding the usable spectrum; require validation for stability |
| Viability Dye (e.g., Zombie NIR) | Covalently labels dead cells; excludes them from analysis | Critical for data quality, especially in dissociated tissue samples |
| Antibody Cocktail (Custom) | Pre-mixed panel of fluorescently-labeled antibodies | Enables complex phenotyping (e.g., 28-color T cell panel) [57] |
| UltraComp eBeads | Compensation beads for single-color controls | Essential for creating a spectral unmixing library |
| Fc Receptor Blocking Solution | Blocks non-specific antibody binding to Fc receptors | Reduces background staining, improves signal-to-noise ratio |
Application Spotlight: Detecting Minimal Residual Disease (MRD)
The power of optimized dissociation and spectral analysis is best demonstrated in clinically critical applications like Minimal Residual Disease (MRD) detection in leukemia.
- Experimental Protocol (SFC-based MRD in AML): Researchers have validated a 24-color SFC panel for MRD in Acute Myeloid Leukemia (AML) with a sensitivity below 0.02% [2]. The process involves:
- Sample Preparation: Bone marrow aspirates are dissociated into single-cell suspensions. The optimized chemical-mechanical protocol is suitable for these samples [55].
- Staining: Cells are stained with a pre-titrated 24-color antibody panel designed to identify leukemic blasts (using lineage markers like CD34, CD117) and distinguish them from normal progenitors through aberrant antigen expression.
- Acquisition & Analysis: Data is acquired on a spectral cytometer (e.g., Cytek Aurora). The full-spectrum data is unmixed, and autofluorescence is subtracted. Leukemic populations are identified based on their unique high-dimensional phenotype.
- Performance Comparison: A study on B-cell Acute Lymphoblastic Leukemia (B-ALL) used a 23-color SFC panel to reliably identify even CD19-negative leukemic clones, a major challenge post-CD19-targeted therapy that often evades conventional lower-parameter panels [2].
The workflow below visualizes this integrated process from tissue to high-dimensional insight.
Fluorochrome Selection and Panel Validation Best Practices
Flow cytometry has undergone a transformative evolution from conventional polychromatic systems to advanced spectral technology, fundamentally changing approaches to fluorochrome selection and panel validation. Where conventional cytometry struggled with spectral overlap compensation limitations, spectral flow cytometry captures the full emission spectrum of each fluorochrome, enabling unprecedented multiplexing capabilities while introducing new considerations for experimental design [3] [5]. For researchers in stem cell analysis and drug development, understanding these evolving best practices is crucial for generating robust, reproducible data that fully leverages the power of modern cytometry platforms.
Technical Foundations: Conventional vs. Spectral Cytometry
The fundamental difference between conventional and spectral flow cytometry lies in their detection systems and approaches to managing fluorescent signals. Conventional flow cytometry employs optical filters and dichroic mirrors to direct specific wavelength ranges to discrete detectors, following a "one detector–one fluorophore" approach [5]. This method necessitates mathematical compensation to correct for inevitable spectral overlap between fluorochromes, which becomes increasingly complex and error-prone as panel size grows [3] [22].
In contrast, spectral flow cytometry captures the entire emission spectrum (typically 400-800 nm) for each fluorochrome using a prism or diffraction grating to scatter light across an array of detectors [3] [5]. Advanced algorithms then deconvolute these full spectral signatures, significantly reducing compensation challenges and enabling resolution of 40 or more parameters simultaneously [3] [2]. This fundamental technical advancement dramatically expands experimental possibilities while requiring adapted approaches to panel design and validation.
Table 1: Key Technical Differences Between Conventional and Spectral Flow Cytometry
| Feature | Conventional Flow Cytometry | Spectral Flow Cytometry |
|---|---|---|
| Detection Principle | Discrete filters and detectors | Full spectrum capture |
| Spectral Overlap Management | Mathematical compensation | Spectral unmixing algorithms |
| Maximum Practical Parameters | ~18-20 colors | 40+ colors |
| Autofluorescence Handling | Limited subtraction capabilities | Built-in autofluorescence extraction |
| Optical Complexity | Complex filter configurations | Simplified optical path |
| Fluorochrome Compatibility | Requires distinct emission peaks | Can resolve highly overlapping spectra |
Fluorochrome Selection Strategies
Instrument-Specific Considerations
Fluorochrome selection begins with understanding your instrument's configuration. Laser combinations determine which fluorochromes can be excited, while detection systems define how emissions are captured [5] [19]. Spectral cytometers offer greater flexibility, as they can utilize the full emission spectrum rather than just peak emissions [19]. When designing panels, consult manufacturer specifications for laser wavelengths and detector configurations to ensure fluorochrome compatibility.
Antigen-Abundance and Fluorochrome Brightness Matching
A critical principle in panel design is matching fluorochrome brightness to target antigen density:
- Bright fluorochromes (PE, APC, Spark PLUS) should be paired with low-abundance antigens [58]
- Dim fluorochromes (eFluor 450, Pacific Blue) are suitable for highly expressed markers [58] [59]
- Tandem dyes remain valuable for panel expansion but require careful handling due to potential instability after fixation [5] [58]
This strategic pairing ensures optimal resolution of both dim and bright populations within the same sample.
Spectral Compatibility and Spillover Management
While spectral cytometry minimizes spillover challenges, fluorochrome selection still requires careful planning:
- Utilize spectral viewers to assess overlap before experimental design [19] [15]
- Prioritize fluorochromes with distinct spectral signatures for co-expressed markers [59]
- Consider staining index values when comparing fluorochrome options [19]
Table 2: Fluorochrome Recommendations by Laser Line for Spectral Flow Cytometry
| Laser Line | Emission Range (nm) | Recommended Fluorochromes | Brightness Category |
|---|---|---|---|
| Violet (405 nm) | 400-500 | Brilliant Violet 421, Super Bright 436, Pacific Blue | Dim to Moderate |
| Blue (488 nm) | 500-600 | Alexa Fluor 488, FITC, PE | Bright |
| Yellow-Green (561 nm) | 600-700 | PE-Cyanine5, PE-Texas Red, PE-eFluor 610 | Moderate to Bright |
| Red (637 nm) | 700-880 | APC, Alexa Fluor 700, PE-Cyanine7 | Bright |
Emerging Fluorochromes and Novel Dyes
The development of new fluorescent dyes continues to expand spectral cytometry capabilities. Recent additions include:
- Spark and Spark PLUS dyes with enhanced brightness [5]
- Super Bright polymers for improved signal intensity [19]
- Brilliant Violet and Horizon V500 dyes for violet laser excitation [19]
These next-generation fluorochromes offer improved photostability and brightness, further enhancing multiplexing capabilities.
Panel Validation Framework
Comprehensive Control Strategies
Robust panel validation requires multiple control types to ensure data quality and accurate interpretation:
- Unstained controls establish baseline autofluorescence for each cell type and condition [17]
- Single-stain controls are essential for spectral unmixing, using either beads or cells with matching autofluorescence [17] [60]
- Fluorescence Minus One (FMO) controls determine gating boundaries, especially critical for dim markers or continuously expressed antigens [17] [58]
- Biological controls (positive and negative) verify antibody specificity and staining efficiency [17]
Antibody Titration and Staining Optimization
Proper antibody titration is essential for optimal signal-to-noise ratio:
- Titrate each antibody individually using conditions matching final experiments [17]
- Calculate staining index at each concentration to identify optimal dilution [17]
- For spectral cytometry, titrate viability dyes first, then antibodies on viable cells [17]
- Use the lowest saturating concentration that provides clear population resolution [59]
Experimental Protocols for Validation
Protocol 1: Antibody Titration for Spectral Flow Cytometry
- Prepare a series of antibody dilutions in staining buffer
- Stain cells with each concentration using identical cell numbers and conditions
- Include unstained controls and viability staining where applicable
- Acquire data using standardized instrument settings
- Calculate staining index: (Medianpositive - Mediannegative) / (2 × SDnegative)
- Select the concentration providing the highest staining index with minimal background [17]
Protocol 2: Single-Stain Control Preparation
- For bead-based controls: Use one drop of compensation beads diluted with 50μL buffer
- Add 1μL of antibody, incubate 15 minutes at room temperature
- For cell-based controls: Use 2 million cells per control
- Apply the same staining protocol as experimental samples (washes, fixation, permeabilization)
- Ensure positive and negative populations have identical autofluorescence characteristics [60]
Protocol 3: FMO Control Implementation
- Prepare a complete staining panel missing only one antibody
- Use the same cell type and number as experimental samples
- Process simultaneously with full staining panel
- Employ FMO controls to establish gating boundaries for dim populations
- Reserve comprehensive FMO sets for final panel validation; use strategically for large panels [17]
Advanced Applications in Stem Cell Research
Spectral flow cytometry enables sophisticated applications particularly valuable for stem cell research and drug development:
High-Dimensional Immunophenotyping
Comprehensive stem cell characterization requires simultaneous assessment of multiple surface and intracellular markers. Spectral cytometry facilitates panels identifying:
- Pluripotency markers (OCT4, SOX2, NANOG)
- Differentiation potential across multiple lineages
- Stemness maintenance and regulatory pathways
- Heterogeneous subpopulations with distinct functional capacities [2]
Minimal Residual Disease (MRD) Detection
In hematopoietic stem cell disorders, spectral cytometry enables sensitive MRD detection through:
- Single-tube assays combining lineage and disease-specific markers
- Sensitivity below 0.01% for rare population detection
- Comprehensive phenotyping of residual malignant cells
- Identification of antigen-loss variants following targeted therapies [2]
Functional Stem Cell Characterization
Combining immunophenotyping with functional assessment provides comprehensive stem cell evaluation:
- Cell cycle and proliferation analysis using DNA dyes and proliferation markers
- Metabolic status assessment via metabolic probes
- Apoptosis and viability measurements
- Cytokine production and signaling pathway activation [19] [2]
Experimental Design Workflow
The following diagram illustrates the comprehensive workflow for spectral flow cytometry panel design and validation:
The Scientist's Toolkit: Essential Research Reagent Solutions
Table 3: Key Reagents and Resources for Spectral Flow Cytometry
| Reagent Category | Specific Examples | Function and Application |
|---|---|---|
| Brilliant Staining Buffer | Brilliant Stain Buffer Plus (BD) | Prevents polymer dye interactions and maintains fluorescence integrity |
| Viability Dyes | Fixable viability stains (eFluor, Zombie) | Distinguishes live/dead cells; critical for data quality |
| Fc Receptor Blocking | Human TruStain FcX (BioLegend) | Reduces non-specific antibody binding |
| Reference Controls | UltraComp eBeads (Invitrogen) | Generate consistent single-stain controls for unmixing |
| Cell Preparation Reagents | Ficoll-Paque PLUS (GE Healthcare) | PBMC isolation from whole blood |
| Fixation/Permeabilization | FoxP3 Staining Buffer Set (eBioscience) | Intracellular staining for transcription factors, cytokines |
| Validation Software | SpectroFlo (Cytek), FACSChorus (BD) | Instrument operation, unmixing, and data quality assessment |
| Panel Design Tools | FluoroFinder, EasyPanel | Fluorochrome compatibility assessment and panel optimization |
Future Directions and Emerging Technologies
The field of spectral flow cytometry continues to evolve with several promising developments:
Integration with Artificial Intelligence
AI and machine learning algorithms are being incorporated to:
- Enhance spectral unmixing accuracy for complex panels
- Automate population identification and characterization
- Improve data quality assessment and troubleshooting
- Predict optimal panel configurations based on experimental goals [3] [15]
Advanced Imaging Cytometry
New systems combine spectral analysis with morphological information:
- BD FACSDiscover S8 Cell Sorter integrates spectral flow with real-time imaging
- Visualization of fluorescence localization within cells
- Simultaneous analysis of surface markers and morphological features [15]
Clinical Translation and Standardization
Efforts are underway to advance spectral cytometry in clinical diagnostics:
- Standardized protocols for regulatory compliance
- Assay validation frameworks for clinical implementation
- MRD detection panels for hematological malignancies
- Automated analysis pipelines for clinical workflow integration [2] [22]
Spectral flow cytometry represents a paradigm shift in single-cell analysis, offering unprecedented multiplexing capabilities that demand refined approaches to fluorochrome selection and panel validation. By understanding the fundamental differences from conventional cytometry, implementing comprehensive validation strategies, and leveraging emerging technologies, researchers can fully exploit this powerful technology. The continued evolution of spectral cytometry promises to further enhance its impact on stem cell research, drug development, and clinical diagnostics, driving advances in personalized medicine and therapeutic innovation.
The fields of spectral flow cytometry and stem cell research are undergoing a paradigm shift, driven by the ability to generate increasingly high-dimensional data. In spectral flow cytometry, technological advancements now allow for the simultaneous analysis of up to 40 parameters on a single cell, providing an unprecedented view into cellular heterogeneity and function [3]. Similarly, stem cell research leverages complex datasets from single-cell RNA sequencing and high-content imaging to unravel differentiation pathways and therapeutic potential. This data deluge presents a significant challenge: extracting meaningful biological insights from millions of individual cell measurements across dozens of dimensions.
Managing this complexity requires a sophisticated computational toolkit. Traditional data analysis methods, which often rely on manual gating and two-dimensional plots, are insufficient for exploring the full richness of these datasets. The "curse of dimensionality" becomes a central problem, where the increasing number of features can lead to model overfitting, reduced accuracy, and heightened computational costs [61]. Consequently, the integration of artificial intelligence (AI) and advanced machine learning (ML) frameworks has become indispensable. These tools enable researchers to reduce dimensionality, identify significant features, and classify cell populations with a speed and precision that were previously unattainable, thereby accelerating discovery in both diagnostics and therapeutic development [61] [62].
Comparative Analysis of Computational Methodologies
The selection of an appropriate computational strategy is critical for the accurate interpretation of high-dimensional cellular data. Below is a systematic comparison of established and emerging methodologies.
Feature Selection Algorithms
Feature selection (FS) is a critical pre-processing step that improves model performance by identifying and retaining the most relevant parameters from high-dimensional datasets [61]. The following table compares hybrid AI-driven FS algorithms evaluated on biological datasets, including the Differentiated Thyroid Cancer Recurrence dataset [61].
Table 1: Performance Comparison of Hybrid Feature Selection Algorithms
| Algorithm Name | Full Name | Key Innovation | Reported Accuracy (on Breast Cancer Dataset) | Key Advantage |
|---|---|---|---|---|
| TMGWO | Two-phase Mutation Grey Wolf Optimization | Incorporates a two-phase mutation strategy for exploration/exploitation balance [61]. | 96% [61] | Superior accuracy with minimal features [61]. |
| ISSA | Improved Salp Swarm Algorithm | Uses adaptive inertia weights and elite salps to boost convergence [61]. | Not Specified | Enhanced convergence accuracy [61]. |
| BBPSO | Binary Black Particle Swarm Optimization | Velocity-free mechanism that simplifies the PSO framework [61]. | Not Specified | Computational simplicity and efficiency [61]. |
| TabNet | (Transformer-based Model) | A deep learning model using sequential attention for tabular data [61]. | 94.7% [61] | State-of-the-art deep learning approach [61]. |
| FS-BERT | (Transformer-based Model) | Applies BERT-like architectures to feature selection tasks [61]. | 95.3% [61] | Leverages contextual understanding from language models [61]. |
Classification Models after Feature Selection
Once the most informative features are selected, classification algorithms are used to predict outcomes. The performance of these classifiers can be significantly enhanced by the prior application of feature selection.
Table 2: Classifier Performance with Hybrid Feature Selection
| Classifier | Performance without FS | Performance with TMGWO-FS | Key Application |
|---|---|---|---|
| Support Vector Machine (SVM) | Lower accuracy and precision [61]. | Achieved 96% accuracy on the Breast Cancer dataset [61]. | Effective for high-dimensional biological data with clear margins [61]. |
| Random Forest (RF) | Prone to overfitting with irrelevant features [61]. | Significant improvement in precision and recall [61]. | Robust for complex, non-linear relationships in cell data [61]. |
| k-Nearest Neighbors (KNN) | Performance degraded by noisy features [61]. | Enhanced accuracy through reduced dimensionality [61]. | Simple, effective for patient stratification and diagnosis [61]. |
| Multi-Layer Perceptron (MLP) | Long training times and complex parameter tuning [61]. | Faster training and improved generalization [61]. | Powerful for pattern recognition in large, complex datasets [61]. |
Integrated AI Platforms for Data Integration
Beyond standalone algorithms, integrated platforms are essential for managing the entire data lifecycle.
Table 3: Comparison of AI-Powered Data Integration Platforms
| Platform | AI Capabilities | Specialized Strengths | Relevance to Cell Analysis |
|---|---|---|---|
| Airbyte | 600+ pre-built connectors; AI-powered connector builder [63]. | Native loading to vector stores (Pinecone, Chroma); supports RAG implementations [63]. | Streamlines data flow from instruments to AI models; enables semantic search of experimental data [63]. |
| Informatica IDMC | CLAIRE AI engine for automated metadata discovery and governance [63]. | Intelligent resource allocation and smart scheduling [63]. | Manages and governs large-scale, multi-omics datasets common in stem cell research [63]. |
| IBM DataStage | Integration with Watson Studio for data refinery and cleaning [63]. | Machine learning for job clustering and stage suggestions [63]. | Automates complex data preparation workflows for high-dimensional analysis [63]. |
Experimental Protocols for Tool Validation
To ensure the reliability and reproducibility of computational tools, rigorous validation using standardized experimental protocols is essential. The following section outlines a general workflow and a specific benchmark study.
Generalized Workflow for High-Dimensional Cell Data Analysis
This diagram outlines a generic, tool-agnostic protocol for analyzing high-dimensional data from instruments like spectral flow cytometers.
Benchmarking Study: Feature Selection for Cancer Diagnosis
A specific benchmark experiment detailed in the search results provides a template for validating computational tools [61].
- Objective: To evaluate the performance of hybrid feature selection algorithms (TMGWO, ISSA, BBPSO) in combination with various classifiers (SVM, RF, KNN, etc.) for improving diagnostic accuracy on medical datasets.
- Datasets: Publicly available datasets, including the Wisconsin Breast Cancer Diagnostic dataset and a Differentiated Thyroid Cancer Recurrence dataset [61].
- Methodology:
- Data Partitioning: The dataset was split into training and testing sets using 10-fold cross-validation to ensure robust results [61].
- Feature Selection: The hybrid FS algorithms (TMGWO, ISSA, BBPSO) were applied to the training set to identify the most discriminative feature subset.
- Model Training & Evaluation: Multiple classifiers were trained using the reduced feature set. Their performance was measured based on accuracy, precision, and recall on the hold-out test set [61].
- Key Outcome: The TMGWO algorithm coupled with an SVM classifier achieved a superior accuracy of 96% on the Breast Cancer dataset, outperforming other FS methods and transformer-based models like TabNet and FS-BERT [61].
Essential Research Reagent Solutions
The computational analysis of high-dimensional data is fundamentally linked to the quality of the underlying experimental reagents. The following table details key materials used in spectral flow cytometry, which generates the data for the computational tools discussed.
Table 4: Key Reagents for High-Parameter Spectral Flow Cytometry
| Reagent Type | Specific Examples | Function in Experiment |
|---|---|---|
| Small Organic Molecules | Spark, Vio, eFluor dyes [5] | Bright, photostable labels for detecting a wide range of cell surface and intracellular proteins. |
| Tandem Dyes | Brilliant Violet, Super Bright, PE-Cy5 [5] | Expand the number of measurable parameters by combining a fluorophore with a large Stokes shift. |
| Fluorescent Proteins | GFP, RFP, and other variants [5] | Used as reporter proteins in genetically engineered cell lines, common in stem cell research. |
| Lanthanide-Labeled Antibodies | Not specified in results | Used in mass cytometry (CyTOF), an alternative to flow cytometry, to further expand multiplexing [5]. |
| Antibody Panels | Pre-configured or custom panels | Combinations of antibodies conjugated to different fluorophores designed to phenotype specific cell populations. |
| Viability Dyes | Not specified in results | Distinguish live cells from dead cells to ensure analysis is performed on healthy, relevant cells. |
| Cell Stimulation Cocktails | Not specified in results | Activate cells to measure functional responses like cytokine production or signaling protein phosphorylation. |
Integrated AI Architectures for Data Processing
Modern data analysis requires an architecture that can handle volume, variety, and velocity. The following diagram illustrates a proposed integrated AI architecture for managing high-dimensional cell data from acquisition to insight, synthesizing concepts from the search results.
The integration of advanced computational tools and AI is no longer optional but a fundamental requirement for advancing research in spectral flow cytometry and stem cell analysis. As the data generated by these fields continues to grow in dimensionality and complexity, the methodologies highlighted in this guide—from hybrid feature selection algorithms like TMGWO to integrated AI platforms—provide a critical pathway for transforming raw data into biological understanding.
The comparative data shows that AI-driven feature selection can significantly enhance the performance of standard classifiers, enabling more accurate diagnosis and deeper exploration of cellular mechanisms. Furthermore, the move towards automated, end-to-end AI architectures promises to streamline workflows, improve reproducibility, and accelerate the pace of discovery. For researchers and drug development professionals, mastering this computational toolkit is essential for unlocking the full potential of high-dimensional cell analysis in the era of personalized medicine.
Navigating Cost-Benefit Analysis and Infrastructure Requirements
The transition from conventional to spectral flow cytometry represents a significant technological shift in biomedical research, particularly in the field of stem cell analysis. This evolution is driven by the increasing complexity of biological questions and the need for higher analytical resolution. Conventional flow cytometry (CFC), a workhorse technology since the 1960s, has enabled multiparametric analysis of individual cells in real time, transforming our understanding of complex biological systems in immunology, oncology, and clinical diagnostics [3]. However, technical limitations including spectral overlap between fluorochromes, cellular autofluorescence, and restrictions in parameter measurement have constrained its potential [3].
Spectral flow cytometry (SFC) has emerged as an innovative solution that redefines the approach to data acquisition and analysis. Unlike conventional cytometry, which relies on discrete filters, spectral cytometry captures the full emission spectrum of each fluorochrome, enabling more accurate signal discrimination and greater capacity for analyzing multiple parameters without the constraints imposed by spectral overlap [3] [5]. This technological advancement marks a turning point in stem cell research, where comprehensive immunophenotyping and functional characterization are essential for understanding developmental biology, disease mechanisms, and therapeutic applications.
Technical Foundations: Fundamental Differences in Detection Systems
The fundamental difference between conventional and spectral flow cytometry lies in their approach to capturing and analyzing fluorescent signals. Conventional systems utilize fixed optical filters and dichroic mirrors to direct specific wavelengths to individual detectors, typically photomultiplier tubes (PMTs) [3] [5]. This "one detector–one fluorophore" approach necessitates mathematical compensation algorithms to address spectral overlap (spillover), which can introduce variability and errors, especially in panels with more than 10 markers [3] [5].
In contrast, spectral flow cytometry employs full-spectrum profiling technology that captures the entire fluorescent signal emitted by particles across a broad wavelength range (typically 400 to >800 nm) [3]. The emitted light is scattered using diffraction grating or optical prisms, and the full emission spectrum of each fluorochrome is recorded, generating a unique spectral signature for each marker [5]. Advanced spectral unmixing algorithms then mathematically decompose the overlapping signals using previously established reference spectra [3]. This strategy maximizes resolution of complex cell populations while minimizing the need for traditional compensation, thereby improving experimental accuracy and reproducibility [3].
Figure 1: Comparison of detection methodologies between conventional and spectral flow cytometry
The hardware configurations further highlight these differences. Conventional cytometers require complex optical systems with numerous independent detectors and filters—a flow cytometer registering signals from 12 fluorophores typically contains 12–14 independent detectors and more than 40 optical filters [5]. Spectral cytometers utilize a simpler optical design without complex filter configurations, instead employing a prism or diffraction grating to scatter emitted light across an array of highly sensitive detectors [5]. This fundamental difference in detection philosophy translates directly to practical advantages in multiparametric analysis capabilities.
Quantitative Comparison: Performance and Economic Considerations
Technical Capabilities and Performance Metrics
The technological differences between conventional and spectral flow cytometry translate into significant variations in performance capabilities, particularly for complex applications like stem cell research. The table below summarizes key performance metrics based on current technological specifications.
Table 1: Technical specification comparison between conventional and spectral flow cytometry
| Parameter | Conventional Flow Cytometry | Spectral Flow Cytometry |
|---|---|---|
| Maximum Parameters | ~18-20 practical limit [3] | Up to 40-50 parameters [3] [5] |
| Detection System | Fixed optical filters, dichroic mirrors, PMTs [5] | Prism/diffraction grating, detector arrays [5] |
| Spectral Resolution | Limited to peak emissions [2] | Full emission spectrum (400->800 nm) [3] |
| Signal Compensation | Mathematical compensation required [3] | Spectral unmixing algorithms [3] |
| Autofluorescence Handling | Limited subtraction capability [2] | Enhanced extraction and minimization [2] |
| Sensitivity to Low-Abundance Markers | Moderate [2] | High (improved signal resolution) [2] |
| Rare Cell Detection | Limited by background noise [3] | Enhanced through spectral signatures [3] |
Economic Analysis: Costs and Infrastructure Requirements
Implementing either conventional or spectral flow cytometry requires significant financial investment and infrastructure planning. The cost-benefit analysis must consider both initial capital expenditure and long-term operational costs.
Table 2: Infrastructure and cost consideration analysis
| Consideration | Conventional Flow Cytometry | Spectral Flow Cytometry |
|---|---|---|
| Initial Instrument Cost | Lower initial investment [3] | Higher initial investment [3] |
| Optical Complexity | High (multiple filters, mirrors, PMTs) [5] | Lower (no complex filter systems) [5] |
| Maintenance Requirements | Moderate (complex optical alignment) | Automated maintenance capabilities [64] |
| Sample Throughput | Variable (typically lower) | High (2x faster acquisition on newest systems) [64] |
| Data Storage Needs | Moderate | High (full spectral data) [3] |
| Operator Expertise | Specialized training needed [3] | Specialized training needed, plus computational skills [3] |
| Reagent Flexibility | Limited by filter configurations | Expanded dye compatibility [5] |
The high initial investment for spectral systems remains a barrier to adoption, though this may be offset by reduced reagent costs through panel consolidation and improved experimental efficiency [3]. Newer SFC systems address operational efficiency through features like automated startup and shutdown and integrated plate loaders, streamlining workflows and reducing hands-on time [64]. For stem cell research specifically, the ability to perform comprehensive characterization in limited samples (such as precious stem cell isolates) provides additional economic value by conserving difficult-to-obtain biological material [2].
Experimental Applications in Stem Cell Research and Drug Development
Methodologies for High-Parameter Stem Cell Analysis
The application of spectral flow cytometry in stem cell research enables sophisticated experimental approaches that were previously challenging or impossible with conventional technology. Below are key methodologies demonstrating this capability.
Metabolic Profiling Panel for Immune Cell Characterization A standardized spectral flow cytometry panel profiling eight key metabolic pathways at single-cell resolution exemplifies the technology's capabilities [65]. This panel utilizes commercially available antibodies while leveraging NAD(P)H autofluorescence for label-free detection of glycolytic activity [65].
Experimental Protocol:
- Cell Preparation: Isolate mononuclear cells from target tissue (e.g., lung following intranasal vaccination)
- Surface Staining: Incubate with antibody cocktail against immune cell markers (30 minutes, 4°C)
- Intracellular Staining: Fix, permeabilize, and stain with metabolic pathway antibodies
- Data Acquisition: Acquire on spectral cytometer (e.g., Cytek Aurora with 5-laser configuration)
- Spectral Unmixing: Apply reference controls for each fluorochrome
- Autofluorescence Extraction: Use same linear unmixing algorithms for NAD(P)H signal
- Data Analysis: Integrate metabolic and phenotypic parameters for population characterization
Minimal Residual Disease (MRD) Detection in Hematologic Malignancies SFC has transformed MRD detection with panels combining lineage and disease-specific markers in single-tube assays [2]. For B-cell acute lymphoblastic leukemia (B-ALL), a 23-color panel identifies CD19-negative leukemic clones—a critical challenge following CD19-targeted therapies [2].
Experimental Protocol:
- Sample Processing: Bone marrow aspirates with low cellularity post-treatment
- Staining Optimization: Titrate antibodies for low-abundance marker detection
- Data Acquisition: Use high-sensitivity detectors with optimized flow rates
- Autofluorescence Subtraction: Enhance rare population resolution
- Analysis: Achieve sensitivity below 0.001% for detection of antigen-loss variants
Figure 2: Experimental workflow for comprehensive stem cell analysis using spectral flow cytometry
Application in Drug Discovery and Development
Flow cytometry plays increasingly critical roles throughout the drug discovery pipeline, from target identification to clinical trial biomarker monitoring [66] [67]. In hit identification, flow cytometry enables phenotypic screening to identify compounds that modulate cellular phenotypes relevant to disease [66]. For example, high-throughput flow cytometry methods have screened compound libraries for modulators of the immunosuppressive transcription factor FOXP3, identifying both stabilizers and destabilizers with potential therapeutic applications [66].
During lead optimization, flow cytometric potency assays provide functional assessment of therapeutic candidates. Zhou et al. used flow cytometry to measure binding affinities of antibody fragments recognizing EGFR, establishing correlations between affinity, avidity, and functional potency to block EGFR signaling [66]. Similarly, flow cytometric assessment of T-cell activation markers (CD69, CD25) demonstrated dose-dependent responses to HPK1 small molecule kinase inhibitors [66].
In translational applications, spectral flow cytometry enables comprehensive immune monitoring in clinical trials. For CD19-directed CAR-T cell therapies, SFC permits simultaneous assessment of CAR-T products, residual disease, and immune context in a single tube [2]. Recent studies employing high-parameter SFC have identified cellular phenotypes associated with therapeutic response, including enrichment of PD-1+ CD8+ CAR-T subsets in responders with lymphoma, and CCR7+ early-memory cells with low CD39 expression predicting favorable outcomes in chronic lymphocytic leukemia [2].
Essential Research Reagent Solutions
The successful implementation of spectral flow cytometry, particularly for complex stem cell applications, depends on appropriate reagent selection and panel design. The expanded multiplexing capabilities of SFC require careful consideration of fluorochrome characteristics and compatibility.
Table 3: Key research reagent solutions for spectral flow cytometry applications
| Reagent Category | Specific Examples | Application Notes |
|---|---|---|
| Small Organic Fluorochromes | Spark, Spark PLUS, Vio, eFluor dyes [5] | Brightness and photostability vary; require spectral reference controls |
| Tandem Dyes | Brilliant Violet, Brilliant Ultra Violet, Super Bright [5] | Monitor stability; prepare fresh aliquots to prevent degradation |
| Fluorescent Proteins | GFP, RFP, mCherry [5] | Essential for stem cell tracking and lineage tracing studies |
| Metal-Labeled Antibodies | LANZHEIM and MAXPAR antibodies [5] | Can be used in SFC though more common in mass cytometry |
| Viability Dyes | Fixable viability stains eFluor 780, Zombie dyes | Critical for excluding dead cells in stem cell analysis |
| Cell Hashtagging Antibodies | TotalSeq antibodies for multiplexing [5] | Enable sample multiplexing to reduce technical variability |
| Autofluorescence Reference Controls | Unstained cells, single-stained controls [65] | Essential for spectral unmixing algorithm accuracy |
Panel design for spectral flow cytometry requires strategic fluorochrome assignment based on antigen density and fluorochrome brightness. The recommended approach assigns brightest fluorochromes to low-abundance markers (typically signaling proteins or cytokine receptors) and dim fluorochromes to high-abundance markers (typically lineage markers and surface receptors) [2]. This optimization becomes increasingly critical as panel complexity grows beyond 20 parameters, where spectral overlap, while mathematically separable, can impact population resolution if not properly managed.
The decision to implement spectral versus conventional flow cytometry technology requires careful consideration of research needs, available resources, and long-term goals. For stem cell research applications where comprehensive immunophenotyping, rare population detection, and functional characterization are priorities, spectral flow cytometry offers compelling advantages despite higher initial investment. The technology's ability to maximize information content from limited samples (e.g., primary stem cell isolates, precious patient samples) provides significant scientific value that may offset economic considerations.
Conventional flow cytometry remains a viable option for laboratories with standardized panel requirements where parameter counts remain below 15-18 markers, or where budget constraints preclude spectral system acquisition. However, the accelerating complexity of stem cell research questions, particularly in translational contexts, increasingly favors spectral technology.
Future directions in spectral flow cytometry include continued expansion of parameter capabilities, improved automation for standardized clinical application, and enhanced computational tools for data analysis [2]. The integration of artificial intelligence and machine learning approaches with high-dimensional spectral data holds particular promise for extracting novel insights from stem cell populations [3]. As these technologies mature and become more accessible, spectral flow cytometry is poised to become the new standard for deep cellular characterization in stem cell research and drug development.
Data-Driven Comparison: Resolution, Sensitivity, and Clinical Utility
In the fields of stem cell research and drug development, the ability to perform deep, high-resolution cellular analysis is paramount for understanding complex biological systems and developing effective therapies. Flow cytometry has long been a cornerstone technology for cellular analysis, enabling researchers to characterize cell populations based on multiple parameters simultaneously. However, traditional conventional flow cytometry (CFC) faces significant limitations in its capacity for multiparametric analysis, primarily due to technical constraints in fluorescent detection systems. The emergence of spectral flow cytometry (SFC) represents a paradigm shift in single-cell analysis, offering substantially enhanced parameter capacity and resolution that is reshaping research capabilities. For researchers and drug development professionals, understanding the technical and practical differences between these platforms is crucial for selecting the appropriate technology for their specific applications, particularly in the context of stem cell research where cellular heterogeneity and rare populations are of significant interest.
Technical Comparison: Detection Mechanisms and Capabilities
Fundamental Differences in Detection Systems
The core distinction between conventional and spectral flow cytometry lies in their fundamental approach to detecting and resolving fluorescent signals. Conventional flow cytometry operates on a "one detector–one fluorophore" principle, using optical filters (dichroic mirrors and bandpass filters) to separate and direct specific wavelength ranges to individual photomultiplier tubes (PMTs) [3] [5]. This approach creates discrete channels that approximate the emission peaks of known fluorophores but inevitably leads to spectral overlap between fluorochromes with nearby emissions, necessitating mathematical compensation that can introduce errors and affect quantification, especially in panels with more than 10 markers [3].
In contrast, spectral flow cytometry captures the entire emission spectrum of each fluorophore across a wide wavelength range (typically 400-800 nm) using an array of highly sensitive detectors [5]. The combined fluorescent signal is scattered using diffraction grating or optical prisms, and advanced spectral unmixing algorithms then mathematically decompose the overlapping signals using previously established reference spectra for each fluorochrome [3] [68]. This strategy not only maximizes resolution of complex cell populations but also minimizes the need for traditional compensation, improving accuracy and reproducibility [3].
Table 1: Core Technical Differences Between Conventional and Spectral Flow Cytometry
| Feature | Conventional Flow Cytometry | Spectral Flow Cytometry |
|---|---|---|
| Detection Principle | Discrete filters and detectors per wavelength band [3] | Full-spectrum capture with array detectors [3] [5] |
| Signal Processing | Compensation for spectral overlap [3] | Spectral unmixing based on reference spectra [3] [68] |
| Typical Detector Configuration | 10-20 photomultiplier tubes (PMTs) [5] | 30-70 detector arrays [3] [5] |
| Fluorophore Resolution | Limited by filter arrangement and spillover [3] | Enhanced by unique spectral fingerprints [68] |
| Autofluorescence Handling | Contributes to background noise [68] | Can be mathematically separated and subtracted [68] [2] |
Quantitative Comparison of Parameter Capacity and Resolution
The technological differences translate directly to significant disparities in practical parameter capacity and resolution. While advanced conventional systems like the BD FACSymphony A5 Cell Analyzer can measure up to 30 fluorescent parameters [5], this represents the practical upper limit due to escalating spectral overlap complications. Spectral systems routinely surpass this boundary, with platforms like the Cytek Aurora and Agilent NovoCyte Opteon capable of analyzing 40-45 parameters simultaneously from a single sample [3] [5].
More importantly than raw parameter count, SFC provides superior resolution, particularly for distinguishing between fluorophores with highly overlapping emission spectra. This capability dramatically expands the viable fluorophore palette, allowing researchers to utilize dyes that would be incompatible on conventional systems [68] [42]. The ability to resolve cellular autofluorescence from specific signals further enhances resolution, especially critical for analyzing inherently autofluorescent cell types like macrophages or stem cells [68] [2].
Table 2: Performance Comparison of Representative Conventional and Spectral Flow Cytometers
| Instrument Model | Technology | Max Laser Configurations | Detection Channels | Published Parameter Capacity |
|---|---|---|---|---|
| BD FACSymphony A5 [5] | Conventional | 5 lasers (355, 405, 488, 561, 637 nm) | 50 detectors | 30 fluorescent parameters [5] |
| BC CytoFLEX LX [5] | Conventional | Not specified | 21 detectors | 21 parameters [5] |
| Cytek Aurora [3] [5] | Spectral | 5 lasers (355, 405, 488, 561, 640 nm) | 64 detection channels | 40 parameters [3] |
| Agilent NovoCyte Opteon [5] | Spectral | Up to 5 lasers (349, 405, 488, 561, 637 nm) | 73 detection channels | 45 parameters [5] |
| Sony ID7000 [5] | Spectral | Up to 7 lasers (320-808 nm) | 184 detection channels | 44+ colors [5] |
Diagram 1: Detection System Workflows. Conventional cytometry uses filters to direct specific wavelengths to limited detectors, while spectral cytometry captures full emission spectra with detector arrays and applies computational unmixing.
Experimental Applications in Stem Cell Research
Methodologies for High-Parameter Stem Cell Analysis
The application of high-parameter flow cytometry in stem cell research requires specialized experimental protocols to address unique challenges such as cellular heterogeneity, rare subpopulation identification, and critical quality attribute (CQA) monitoring. A representative methodology for pluripotency marker analysis incorporates both surface and intracellular staining with a focus on resolution of complex populations.
Protocol: Multiparametric Analysis of Human Pluripotent Stem Cells Using Spectral Flow Cytometry [69]
Cell Preparation and Staining:
- Human embryonic stem cells (hESCs) or induced pluripotent cells (hiPSCs) are harvested using enzyme-free dissociation reagents like Accumax to preserve surface epitopes.
- Cells are washed in PBS and fixed with 4% paraformaldehyde for 10 minutes, followed by permeabilization for intracellular marker staining.
- Antibody cocktails are prepared using carefully titrated fluorophore-conjugated antibodies against pluripotency markers (OCT4, NANOG), surface markers, and functional markers (Ki-67, pHH3).
Cell Cycle Analysis Integration:
- Cells are pulsed with 10 µM EdU (5-ethynyl-2'-deoxyuridine) for 60 minutes to label S-phase cells.
- Following fixation and permeabilization, EdU detection is performed using click chemistry with fluorescent azides.
- DNA staining with Hoechst 33342 (4 µg/ml, 15 minutes) enables cell cycle profiling.
Data Acquisition and Analysis:
- Samples are acquired on a spectral flow cytometer (e.g., Cytek Aurora or Thermo Fisher Attune NxT).
- Spectral unmixing is performed using manufacturer-specific algorithms with pre-established reference controls.
- Data analysis employs both traditional gating strategies and high-dimensional approaches (t-SNE, UMAP, FlowSOM) for population identification [68].
Diagram 2: Stem Cell Analysis Workflow. Comprehensive protocol for high-parameter analysis of human pluripotent stem cells, integrating cell cycle and functional status assessment.
Successful high-parameter stem cell analysis depends on carefully selected reagents and panel design strategies. The following toolkit outlines critical components for spectral flow cytometry applications in stem cell research.
Table 3: Essential Research Reagent Solutions for Spectral Flow Cytometry
| Reagent Category | Specific Examples | Research Application |
|---|---|---|
| Pluripotency Markers | OCT4 (POU5F1), NANOG, SOX2 [69] | Assessment of pluripotent state and differentiation status |
| Cell Surface Markers | TRA-1-60, TRA-1-81, SSEA-4 [70] | Characterization of pluripotent stem cell surfaces |
| Functional & Activation Markers | Ki-67, pHH3, CD25, CD69 [42] | Monitoring proliferation, activation, and functional states |
| Viability Indicators | Fixable viability dyes (e.g., Zombie dyes) [42] | Exclusion of dead cells to improve data quality |
| Cell Cycle Probes | EdU, Hoechst 33342 [69] | Cell cycle phase determination and proliferation tracking |
| Fluorophore Families | Spark PLUS, Brilliant Violet, eFluor dyes [5] | Expanded panel design with minimal spectral overlap |
Discussion: Implications for Research and Development
Impact on Stem Cell Research and Therapeutic Development
The enhanced parameter capacity and resolution of spectral flow cytometry directly addresses fundamental challenges in stem cell research, particularly the need to characterize inherent heterogeneity within isogenic populations [69]. Where conventional flow cytometry might identify broad pluripotent populations, spectral technology enables resolution of subtle subpopulations with distinct differentiation potentials, cell cycle states, and metabolic activities [69] [70]. This capability is transforming our understanding of pluripotency as a dynamic continuum rather than a binary state.
In therapeutic development, spectral flow cytometry provides critical advantages for quality control in stem cell manufacturing. The technology supports the monitoring of critical quality attributes (CQAs) as part of quality-by-design (QbD) frameworks, enabling derivation of rate distributions for key physiological properties rather than relying on population averages [69]. This enhanced resolution is particularly valuable for monitoring process-induced changes and identifying aberrant subpopulations that might compromise product safety or efficacy.
Current Limitations and Future Directions
Despite its advantages, spectral flow cytometry implementation faces several practical challenges. The high initial investment for instrumentation (often $300,000-$500,000 for advanced systems) can be prohibitive for some laboratories [71]. Additionally, the complexity of panel design, data management, and analysis requires specialized expertise that may not be readily available in all settings [3] [71]. The absence of standardized protocols and validated panels for specific stem cell applications also presents hurdles for widespread adoption, particularly in regulated environments.
The future of spectral technologies points toward increased integration with complementary methodologies and continued technical refinement. The combination with artificial intelligence (AI) for automated population identification and data analysis is already addressing analytical bottlenecks [68] [71]. Emerging applications in spatial cytometry and continued development of novel fluorophores will further expand the research capabilities. For stem cell research specifically, the development of validated panels for tracking differentiation trajectories and identifying functional subpopulations will be crucial for advancing both basic science and clinical applications.
The head-to-head comparison between conventional and spectral flow cytometry reveals a clear technological evolution in parameter capacity and resolution. While conventional flow cytometry remains a valuable tool for applications requiring up to approximately 18 parameters, spectral flow cytometry provides transformative capabilities for high-complexity stem cell research. With the ability to simultaneously analyze 40 or more parameters while providing superior resolution of complex populations, spectral technology enables researchers to address previously intractable questions about stem cell heterogeneity, differentiation, and function. As the field continues to mature with improved standardization, accessibility, and analytical tools, spectral flow cytometry is poised to become an indispensable technology for advancing both basic stem cell biology and the development of stem cell-based therapeutics. For research and drug development professionals, investing in spectral capabilities represents a strategic decision to enhance research depth and maintain competitive advantage in the rapidly advancing field of regenerative medicine.
Minimal Residual Disease (MRD) refers to the small population of cancer cells that persist in patients after treatment, often at levels undetectable by traditional morphology, and serves as a critical biomarker for predicting relapse in leukemia [72]. Accurate MRD detection is essential for assessing treatment efficacy, guiding risk stratification, and informing clinical decisions. Among the technologies employed for MRD detection, flow cytometry has emerged as a powerful tool due to its ability to provide rapid, single-cell analysis. This case study objectively compares the performance of conventional and spectral flow cytometry for MRD detection in leukemia, focusing on sensitivity, panel design, and practical application. Flow cytometry platforms for MRD detection operate on the principle of fluorescence, where fluorophore-conjugated antibodies bind to specific cellular antigens, and lasers excite these fluorophores to emit light of characteristic wavelengths that detectors then measure [73]. The fundamental difference between conventional and spectral cytometry lies in how they collect and resolve this emitted light, leading to significant implications for the sensitivity and complexity of MRD assays.
Technical Comparison: Conventional vs. Spectral Flow Cytometry
Core Principles and Data Resolution
The fundamental difference between conventional and spectral flow cytometry lies in their approach to capturing and interpreting fluorescent signals.
Conventional flow cytometry relies on a system of mirrors and filters to direct specific, discrete portions of a fluorophore's emission spectrum to individual detectors. Each fluorophore is assigned a primary detector, and the "spillover" of its emission into other detectors is mathematically subtracted through a process called compensation [73] [7]. This method effectively handles panels with a limited number of colors but faces challenges as panel size increases because the broad emission spectra of fluorophores inevitably overlap.
Spectral flow cytometry, in contrast, captures the full emission spectrum of every fluorophore across a wide array of detectors. Instead of compensation, it uses a mathematical algorithm called unmixing to deconvolute the combined fluorescent signal from a cell into the individual contributions of each fluorophore, based on their unique spectral signatures [73] [27] [7]. This holistic approach allows for the resolution of fluorophores with highly similar emissions and enables a key feature: autofluorescence extraction, where the natural background fluorescence of cells can be identified and removed, thereby improving signal resolution [27] [74].
Performance and Capability Comparison
The table below summarizes the critical differences between the two technologies that impact MRD detection.
Table 1: Performance Comparison between Conventional and Spectral Flow Cytometry
| Feature | Conventional Flow Cytometry | Spectral Flow Cytometry |
|---|---|---|
| Data Collection Principle | Collects discrete portions of emission via bandpass filters [73] | Collects the full emission spectrum across many detectors [73] [27] |
| Signal Resolution | Compensation (subtracting spillover) [73] [7] | Spectral Unmixing (mathematical deconvolution) [73] [27] |
| Detector/Fluorochrome Relationship | Typically 1:1 [27] | More detectors than fluorochromes [27] |
| Autofluorescence Handling | Cannot be digitally separated [27] | Can be extracted to improve signal resolution [27] [74] |
| Typical Maximum Panel Size | 15-30 colors [73] [75] | 40+ colors [73] [27] |
| Sensitivity for MRD | Up to (10^{-4}) to (10^{-6}) (depends on panel size) [72] | Can reach (10^{-6}) with high-parameter panels [72] [76] |
The workflows illustrate the fundamental differences in how each technology processes fluorescent light from cells. The conventional path is a linear process of filtering and compensation, while the spectral path captures a full data cube for subsequent unmixing.
MRD Detection Sensitivity: A Direct Comparison
Sensitivity of Current MRD Detection Methods
The sensitivity of an MRD assay defines its ability to detect one leukemic cell within a background of normal cells, which is directly critical for predicting patient relapse. The following table compares the sensitivity of various MRD detection techniques, highlighting the position of flow cytometry.
Table 2: Sensitivity Comparison of Different MRD Detection Methods [72]
| Method | Applicability | Sensitivity | Key Advantages | Key Limitations |
|---|---|---|---|---|
| Karyotyping | ~50% | (5 \times 10^{-2}) | Widely used & standardized | Slow; high labor demand; requires pre-existing abnormal karyotype |
| FISH | ~50% | (10^{-2}) | Useful for quantifying cytogenetic abnormalities; relatively fast | High labor demand; requires pre-existing abnormal karyotype |
| qPCR | ~40-50% | (10^{-4}) to (10^{-6}) | Widely used, standardized, lower cost | Only one gene assessed per assay |
| Flow Cytometry (FCM) | ~100% | (10^{-3}) to (10^{-6}) | Widely used, fast, wide application, relatively inexpensive | Lack of standardization; requires professional knowledge; fresh cells |
| Next-Generation Sequencing (NGS) | >95% | (10^{-2}) to (10^{-6}) | Multiple genes analyzed at once; broad applicability | Not yet standardized; slow report time; high cost |
The sensitivity of flow cytometry is not fixed and varies significantly with the technology and panel design. Conventional flow cytometry typically achieves a sensitivity of (10^{-3}) to (10^{-4}) with 3-8 color panels, which can be pushed to (10^{-4}) to (10^{-6}) with panels of 8 or more colors [72]. Spectral flow cytometry, by enabling larger, more complex panels (e.g., 24-40 colors) and incorporating autofluorescence extraction, can consistently achieve high sensitivity down to (10^{-6}) [72] [76]. This high sensitivity allows for the detection of rare leukemic cell populations amidst hundreds of thousands to millions of normal cells, providing a robust tool for prognostic assessment.
Experimental Evidence: A 24-Color Panel for AML MRD
A 2023 study developed a 24-color full spectrum flow cytometry panel specifically for MRD detection in Acute Myeloid Leukemia (AML) [76]. This panel was designed not only to identify residual blasts but also to perform fine clustering of bone marrow cells and investigate the expression of immune checkpoints like CD96 and CD200, which were found to be differentially expressed in MRD samples.
Table 3: Key Reagent Solutions in a 24-Color AML MRD Panel [76]
| Reagent Category | Specific Markers | Primary Function in MRD Detection |
|---|---|---|
| Gating & Lineage Anchors | CD45, CD117, CD34, HLA-DR | Identify and gate on primitive cell populations (blasts) for analysis. |
| Pan-Myeloid Markers | CD13, CD33, CD371 | Confirm myeloid lineage of the identified primitive cells. |
| Differentiation Markers | CD15, CD64, CD11b, CD11c, CD14 | Assess the normal vs. aberrant maturation patterns of myeloid cells. |
| Leukemia-Associated Immunophenotypes (LAIP) | CD7, CD56, CD19, CD2, CD4 | Detect aberrant expression of antigens on myeloid blasts, a key indicator of malignancy. |
| Other Aberrancy Markers | CD123, CD200, CD38, CD96, CD71, CD36, CD9 | Further characterize aberrant antigen expression patterns that distinguish leukemic from normal cells. |
Experimental Protocol Summary:
- Panel Design: The single-tube panel incorporated 24 antibodies, selected based on the European Leukemia Network guidelines [76].
- Antibody Titration: Each antibody was titrated using 3, 2, 1, 0.5, and 0.25 times the recommended dosage to determine the optimal stain index [76].
- Sample Preparation: Bone marrow samples were stained with the pre-titrated antibody cocktail in the presence of Brilliant Stain Buffer. A precise cell count ensured (2 \times 10^6) cells were stained per tube [76].
- Instrumentation & Analysis: Samples were acquired on a full-spectrum flow cytometer. Data analysis was performed using FlowJo and Kaluza software, incorporating high-dimensional analysis tools like t-SNE and Trimap for in-depth visualization of cell populations [76].
The study concluded that the 24-color full spectrum panel provided a high-resolution basis for the auxiliary diagnosis, prognosis judgment, and treatment guidance in AML, underscoring the practical value of high-parameter spectral cytometry in a clinical research setting [76].
Implications for Research and Drug Development
The transition from conventional to spectral flow cytometry has profound implications for leukemia research and therapeutic development. The ability to run 40+ color panels allows for an unprecedented depth of immunophenotyping, enabling researchers to dissect complex leukemic populations and their interactions with the immune microenvironment simultaneously [73] [27]. For drug development, particularly in immunotherapies targeting immune checkpoints like CD96 and CD200, spectral cytometry provides a powerful tool for monitoring changes in these targets on both tumor and immune cells in a single assay, thereby assessing pharmacodynamic responses and identifying potential biomarkers of resistance [76].
Furthermore, the enhanced sensitivity and specificity of spectral cytometry improve the quality of endpoints in clinical trials. More accurate MRD assessment allows for better stratification of patients, leading to more robust conclusions about a treatment's efficacy. The technology's capacity for standardization—by relying on predefined spectral signatures rather than instrument-specific filter configurations—also holds the promise of making MRD data more reproducible across different laboratories, a significant challenge with conventional methods [72] [75].
In the critical application of MRD detection in leukemia, spectral flow cytometry demonstrates a clear and advancing advantage over conventional flow cytometry. While conventional flow remains a robust and reliable technology for smaller panels, spectral cytometry's core principle of full-spectrum collection and unmixing translates into directly superior capabilities: higher parameter detection, improved resolution of dim markers through autofluorescence extraction, and the ability to achieve a sensitivity of 10^{-6} with comprehensive panels. The experimental data from a 24-color panel for AML MRD confirms that spectral technology is not merely an incremental improvement but a transformative tool that provides deeper biological insights. For researchers and drug development professionals aiming to push the boundaries of leukemia diagnostics, prognosis, and therapy monitoring, spectral flow cytometry is an indispensable technology that offers the resolution and depth needed to understand and combat this complex disease.
{#title}Comparative Analysis of Stem Cell Population Resolution in Complex Samples{/#title} {#content}
The resolution of stem cell populations within complex biological samples is a cornerstone of advanced research in developmental biology, cancer, and regenerative medicine. Flow cytometry has long been the technology of choice for this task, yet the emergence of spectral flow cytometry presents a significant evolution in our analytical capabilities. This guide provides an objective comparison of conventional and spectral flow cytometry, focusing on their performance in resolving stem cell populations. We summarize quantitative data on key performance metrics, detail essential experimental protocols for both technologies, and visualize their core workflows. Supported by experimental data, this analysis aims to equip researchers with the information necessary to select the optimal cytometric approach for their specific stem cell research applications.
Stem cell populations, including cancer stem cells (CSCs), are often rare, heterogeneous, and require the simultaneous measurement of multiple surface and intracellular markers for their precise identification and characterization. Conventional flow cytometry (CFC) has been a reliable workhorse for this purpose, but its panel size is constrained by fluorescent spillover and complex compensation. Spectral flow cytometry (SFC) addresses these limitations by capturing the full emission spectrum of every fluorophore, using mathematical unmixing to resolve complex panels with unprecedented clarity. This comparison delves into the data, methods, and practical considerations that differentiate these two technologies in the critical context of stem cell analysis.
Performance and Data Comparison
The fundamental differences in how conventional and spectral flow cytometers collect and interpret light lead to direct impacts on performance, particularly for high-dimensional stem cell panel design.
Table 1: Key Technical and Performance Differentiators
| Feature | Conventional Flow Cytometry (CFC) | Spectral Flow Cytometry (SFC) |
|---|---|---|
| Core Principle | Uses filters to direct a narrow band of a fluorophore's emission to a dedicated detector [77]. | Captures the full emission spectrum across many detectors for every fluorophore [77] [53]. |
| Spillover Correction | Compensation: mathematically subtracts spillover signal after data acquisition [77]. | Unmixing: uses the entire spectral signature to resolve fluorophores during data analysis [77] [7]. |
| Typical Max Panel Size | ~15-20 colors [77]; up to ~28 colors in advanced systems [27]. | ~40+ colors, enabling deeper phenotyping from a single tube [53] [27]. |
| Autofluorescence Handling | Background autofluorescence is inherent to the signal and can obscure dim populations [53]. | Autofluorescence can be profiled and extracted as a separate component, improving resolution [53] [7]. |
| Fluorochrome Flexibility | Limited by available filter configurations; similar fluorophores are difficult to resolve [27]. | High flexibility; capable of resolving fluorophores with highly similar emission profiles [27]. |
Table 2: Quantitative Performance in Stem Cell and Clinical Applications
| Application / Metric | Conventional Flow Cytometry | Spectral Flow Cytometry |
|---|---|---|
| Measurable Residual Disease (MRD) in AML | Standard sensitivity ~0.1% [53]. | Validated sensitivity <0.02% with 24-color panels [53]. |
| MRD in B-ALL | Standard sensitivity [53]. | Sensitivity up to ~10⁻⁵ (0.001%); enables detection of CD19-negative clones [53]. |
| MRD in Multiple Myeloma | Standard sensitivity [53]. | Sensitivity ~10⁻⁶ (0.0001%) using single-tube Next Generation Flow (NGF) assays [53]. |
| Immune Profiling in Clinical Trials | Limited by sample volume and number of tubes. | Enables >35 parameter panels from low-volume samples (e.g., bone marrow, pediatric biopsies) [53]. |
Experimental Protocols for Stem Cell Analysis
Robust experimental design is critical for valid results. The following protocols are adapted from standardized workflows for complex sample analysis [53] [78].
Protocol for Conventional Flow Cytometry
- Sample Preparation: Isolate stem cell-containing samples (e.g., bone marrow, PBMCs, dissociated tissues). Use viability dyes (e.g., Zombie UV) to exclude dead cells [79] [78].
- FC Receptor Blocking: Incubate cells with an FC receptor blocking agent (e.g., Human TruStain FcX) for 5-15 minutes at room temperature to minimize non-specific antibody binding [78].
- Staining: Prepare an antibody master mix in Brilliant Stain Buffer to prevent polymer degradation of tandem dyes. Add the mix to cells and incubate for 15-20 minutes at room temperature (or 4°C for light-sensitive dyes). Perform intracellular staining (e.g., for transcription factors like FOXP3) using a commercial fixation/permeabilization kit after surface staining [78].
- Data Acquisition: Resuspend cells in a suitable sheath fluid or buffer and acquire data on a conventional flow cytometer. Critical Step: Run single-color stained compensation controls (beads or cells) for every fluorophore in the panel.
- Data Analysis: Apply compensation matrices to correct for fluorescent spillover. Proceed with a sequential gating strategy: (1) Remove debris and doublets using FSC-A vs. FSC-H [79], (2) Gate on single, live cells, (3) Identify lineage populations, and (4) Resolve target stem cell populations based on marker expression (e.g., Side Population via Hoechst efflux, or CD34+CD38- populations) [80].
Protocol for Spectral Flow Cytometry
- Sample Preparation & Staining: The initial steps for sample prep, viability staining, FC blocking, and antibody staining are conceptually identical to the CFC protocol [78] [27]. Key Consideration: Panel design requires checking the "similarity index" between fluorophores to ensure they can be effectively unmixed [7].
- Reference Controls: Prepare single-stain controls for every fluorophore. It is recommended to validate these controls using the same biological matrix as the test samples (e.g., cells rather than beads) to ensure the spectral signature is accurate, as beads can sometimes distort the signature [7].
- Data Acquisition: Acquire data on a spectral flow cytometer. The instrument will record the full emission spectrum for every cell.
- Unmixing and Data Cleaning: In the spectral analysis software, apply the reference control spectra to "unmix" the fully stained sample file. Use an unstained control to perform autofluorescence extraction, which subtracts the endogenous cellular fluorescence to improve signal-to-noise ratio [53] [7]. Proceed with gating to remove debris and doublets.
Figure 1: The core workflow of spectral flow cytometry relies on capturing the full emission spectrum and using reference controls for computational unmixing to resolve individual fluorophores. [77] [7]
The Scientist's Toolkit: Essential Research Reagents and Materials
Successful high-parameter stem cell analysis depends on a carefully selected set of reagents and tools.
Table 3: Key Reagent Solutions for High-Parameter Flow Cytometry
| Item | Function in Stem Cell Analysis | Key Considerations |
|---|---|---|
| Viability Dye (e.g., Zombie UV, PI) | Distinguishes live from dead cells to ensure analysis is restricted to viable stem/progenitor cells. | Critical for preserving data quality, especially when working with cryopreserved samples [78]. |
| FC Receptor Blocking Reagent | Reduces non-specific antibody binding, lowering background and improving signal resolution. | Essential for both conventional and spectral workflows [78]. |
| Brilliant Stain Buffer | Protects the integrity of tandem dyes (e.g., PE-Cy7) from photobleaching and degradation. | Mandatory for panels using polymer-based tandem dyes to prevent breakdown and spreading error [78]. |
| Titrated Antibodies | Antibodies conjugated to fluorophores for detecting specific stem cell markers (e.g., CD34, CD133, CD90). | Antibody titration is required to determine the optimal concentration that maximizes the signal-to-noise ratio [78]. |
| Fixation/Permeabilization Buffer Set | Allows for intracellular staining of markers like transcription factors (e.g., FOXP3, NANOG) or cytokines. | Required for characterizing the functional state of stem cells [78]. |
| Compensation Beads | Used to generate single-color controls for setting compensation in CFC and as a preliminary check in SFC. | For SFC, single-stain cells are often preferred over beads for creating reference controls due to more accurate spectral signatures [7]. |
Analysis of Complex Data
The high-dimensional data generated, particularly by SFC, requires analysis methods beyond traditional manual gating.
- Conventional Flow Cytometry: Relies on a sequential, hierarchical gating strategy visualized through two-dimensional plots (dot plots, histograms) to isolate populations of interest [79] [81].
- Spectral Flow Cytometry: The complexity of large panels (e.g., 30-40 colors) makes manual gating impractical and subjective. Researchers must employ computational analysis techniques [82] [78]. These include:
- Dimensionality Reduction: Algorithms like t-SNE (t-Distributed Stochastic Neighbor Embedding) and UMAP (Uniform Manifold Approximation and Projection) create 2D maps where cells with similar expression profiles cluster together, revealing population structures without pre-defined gates [82] [78].
- Automated Clustering: Tools like FlowSOM and PhenoGraph use unsupervised machine learning to automatically identify and quantify cell populations based on all measured parameters simultaneously [82] [78].
Figure 2: A comparison of data analysis workflows, highlighting the shift from manual gating to automated computational methods for high-dimensional data. [82] [78]
The choice between conventional and spectral flow cytometry for stem cell population resolution is not merely a technical preference but a strategic decision that shapes experimental possibilities. Conventional flow cytometry remains a powerful, accessible tool for well-defined panels of up to ~20 colors. However, for research demanding the deepest possible phenotyping from minimal sample material—such as comprehensively characterizing rare cancer stem cell subsets, achieving ultra-sensitive MRD detection, or profiling complex immune environments—spectral flow cytometry offers a demonstrable and superior performance. Its ability to resolve larger panels, extract autofluorescence, and provide clearer resolution of dimly expressed markers makes it the emerging gold standard for high-dimensional stem cell analysis. {/#content}
In the field of high-parameter cell analysis, spillover spreading error represents a fundamental challenge that directly compromises data accuracy. This phenomenon, often visualized as a "trumpet effect" where error increases with signal intensity, occurs when the fluorescence emission from one fluorophore spills into the detection channels of others [83]. In conventional flow cytometry, this spillover is mathematically corrected through a process called compensation, but this approach cannot eliminate the underlying spreading error that obscures population distinctions and reduces resolution, particularly for dimly expressed markers [3] [84]. The limitations of conventional systems become increasingly problematic as researchers push toward higher-parameter experiments, creating an imperative need for technological solutions that fundamentally address rather than merely correct for spectral overlap.
Spectral flow cytometry has emerged as a transformative solution to this persistent challenge. Unlike conventional systems that rely on filters to capture narrow emission bands, spectral cytometry captures the full emission spectrum of every fluorophore across multiple detectors [53] [85]. This comprehensive spectral data enables sophisticated unmixing algorithms to distinguish even highly overlapping fluorochromes based on their unique spectral signatures rather than merely subtracting overlapping signals [85] [3]. For researchers working with complex stem cell populations that require precise identification of rare subsets or subtle phenotypic differences, reducing spillover spreading error is not merely a technical improvement but a necessity for generating reliable, publication-quality data.
Technical Comparison: Conventional vs. Spectral Detection Principles
The fundamental difference between conventional and spectral flow cytometry lies in their approach to fluorescence detection and signal processing. Understanding these distinct mechanisms is essential for appreciating how spectral technology mitigates spillover spreading error at its source.
Conventional Flow Cytometry: Filter-Based Detection
Conventional flow cytometers employ a system of optical filters and dichroic mirrors to direct specific wavelength ranges to individual detectors [3] [84]. Each fluorophore is primarily assigned to a single detection channel, typically corresponding to its peak emission wavelength. When multiple fluorophores with overlapping spectra are used simultaneously, their signals contaminate adjacent channels. The conventional solution—compensation—involves mathematically subtracting this spillover after data acquisition [84]. However, this process cannot eliminate the inherent spreading error introduced by photon counting statistics, which manifests as increased variance in compensated parameters and reduced ability to distinguish dim populations near background levels [83].
Table 1: Key Differences in Detection Approaches
| Feature | Conventional Flow Cytometry | Spectral Flow Cytometry |
|---|---|---|
| Detection Principle | Filter-based detection with discrete channels | Full-spectrum acquisition with array detectors |
| Fluorophore-Detector Relationship | 1:1 (one fluorophore per primary detector) | 1:Many (each fluorophore spreads across all detectors) |
| Spillover Management | Post-acquisition compensation | Real-time spectral unmixing |
| Typical Parameter Limit | 15-20 colors | Up to 40 colors |
| Autofluorescence Handling | Contributes to background noise | Can be characterized and subtracted |
Spectral Flow Cytometry: Full-Spectrum Acquisition
Spectral flow cytometers replace the filter-based detection system with diffraction gratings or prisms that disperse the full emission spectrum across an array of detectors [3]. This approach captures a complete fluorescence signature for each cell, generating a high-dimensional data point that represents the combined contributions of all fluorophores present [85]. Advanced computational algorithms then deconvolute this complex signal by comparing it to reference spectra for each fluorophore used in the panel [84]. This process, known as spectral unmixing, mathematically separates the contributions of individual fluorophores based on their unique spectral fingerprints rather than merely subtracting overlapping signals [85]. By fundamentally changing how fluorescence is detected and analyzed, spectral cytometry dramatically reduces the spillover spreading error that plagues conventional systems, particularly for fluorophores with substantial spectral overlap [85] [3].
Quantitative Comparison: Experimental Data on Spillover Reduction
Multiple studies have quantitatively demonstrated the superior performance of spectral flow cytometry in reducing spillover spreading error and improving resolution for high-parameter panels. The following experimental data highlights these advantages in practical research scenarios.
Resolution of Highly Overlapping Fluorophores
Spectral cytometry enables the simultaneous use of fluorochromes with nearly identical emission peaks that would be incompatible on conventional systems. A compelling example is the combination of phycoerythrin (PE) and BD Horizon RealYellow 586 (RY586), two bright fluorophores with significant spectral overlap [85]. On a conventional cytometer, the emission spectra of PE and RY586 overlap too extensively to be resolved through compensation, forcing researchers to choose only one of these bright fluorophores for their panel [85]. In contrast, spectral cytometry leverages subtle differences in their complete emission profiles, including variations in cross-laser excitation and shoulder emissions, to distinguish these fluorophores with high fidelity [85]. This capability effectively increases the palette of available fluorophores for panel design, enabling more flexible and comprehensive experiments.
Table 2: Performance Comparison in Clinical Applications
| Application | Conventional Flow Cytometry | Spectral Flow Cytometry | Reference |
|---|---|---|---|
| MRD Detection in AML | Typically requires multiple tubes | Single-tube 24-color panel with sensitivity <0.02% | [53] |
| B-ALL MRD Detection | May miss CD19-negative clones | 23-color panel identifies antigen-loss variants | [53] |
| CAR-T Cell Monitoring | Limited multiparametric analysis | High-dimensional profiling of exhaustion markers | [53] |
| Stem Cell Characterization | Limited marker combinations | Comprehensive immunophenotyping with rare population resolution | [1] |
Improved Sensitivity in Rare Cell Detection
The reduction of spillover spreading error in spectral flow cytometry directly translates to improved sensitivity for detecting rare cell populations—a critical requirement in stem cell research and minimal residual disease (MRD) monitoring. In acute myeloid leukemia (AML), spectral cytometry has enabled the development of 24-color single-tube assays that achieve sensitivity below 0.02% while maintaining clear resolution of maturation states [53]. Similarly, in B-cell acute lymphoblastic leukemia (B-ALL), 23-color spectral panels have demonstrated the ability to identify CD19-negative leukemic clones that might be missed by conventional approaches [53]. This enhanced sensitivity stems from both reduced spreading error and the ability of spectral cytometers to characterize and subtract cellular autofluorescence using the same unmixing algorithms applied to fluorophores [53] [3]. By minimizing background noise and improving signal resolution, spectral cytometry provides clearer discrimination between positive and negative populations, even for dimly expressed markers.
Experimental Protocols for Spillover Assessment
Researchers can systematically evaluate and minimize spillover spreading error through carefully designed experimental protocols. The following methodologies represent best practices for both conventional and spectral flow cytometry.
Fluorophore Titration for Optimal Signal-to-Noise
Proper antibody titration is essential for minimizing spillover while maintaining strong specific signals. A comprehensive titration study involving 266 antibodies, including PE-conjugated reagents, demonstrated the critical importance of identifying optimal antibody concentrations through systematic testing [83]. The protocol involves:
- Preparing serial dilutions of each antibody (e.g., 1:25, 1:50, 1:100, 1:200, 1:400)
- Staining target cell populations with each dilution
- Analyzing the staining index at each concentration to determine the optimal balance between signal strength and background
- Selecting the dilution that provides the highest staining index, indicating robust specific signal with minimal spillover [83]
This meticulous approach ensures that each antibody is used at a concentration that maximizes signal clarity while reducing spectral spillover and carryover effects, thereby enhancing the accuracy of subsequent analyses [83].
Reference Spectra Collection for Spectral Unmixing
In spectral flow cytometry, generating high-quality unmixing results depends on the acquisition of precise reference spectra for each fluorophore used in a panel. The recommended protocol includes:
- Single-stain controls: Each fluorophore-conjugated antibody must be run individually on the same instrument settings as the full panel
- Proper biological controls: Using compensation beads or cells with known antigen expression patterns that match experimental samples
- Autofluorescence characterization: Recording the native fluorescence signature of unstained cells for subtraction during unmixing
- Validation with biological samples: Verifying unmixing accuracy with well-characterized cell populations [53] [83]
Improper handling of autofluorescence or inadequate reference controls can result in unmixing errors and false-positive events [53]. Although autofluorescence subtraction generally enhances resolution, researchers should note that it may increase the spread in negative populations, particularly for fluorochromes overlapping with endogenous fluorescence profiles [53].
Essential Research Reagent Solutions
The following reagents and materials are essential for implementing spillover reduction strategies in high-parameter flow cytometry experiments.
Table 3: Essential Research Reagents for Spillover Management
| Reagent/Material | Function in Spillover Reduction | Application Notes |
|---|---|---|
| Pre-titrated Antibody Panels | Ensures optimal concentration to maximize signal-to-noise ratio | Reduces excessive fluorescence that contributes to spillover; available from multiple vendors [86] |
| PE-Conjugated Antibodies | Bright fluorophore requiring careful titration | Demonstrates broad emission spectrum; proper titration crucial for minimizing spillover [83] |
| RealYellow/RealBlue Dyes | Next-generation fluorophores with reduced cross-laser excitation | Engineered for minimal spillover; compatible with highly overlapping traditional fluorophores [85] |
| Cell Staining Wash Systems | Removes unbound antibody to reduce background | Technologies like laminar wash systems improve signal clarity and reduce carryover [83] |
| Reference Control Particles | Enables precise instrument calibration and compensation | Essential for generating accurate single-stain controls for both conventional and spectral systems |
Visualization of Spillover Reduction Concepts
The following diagrams illustrate key concepts and workflows related to spillover spreading error and its mitigation through spectral flow cytometry.
Spillover Reduction Mechanisms Comparison - This diagram contrasts how conventional and spectral flow cytometry fundamentally differ in their approach to fluorescence detection and spillover management.
Optimal Panel Design Workflow - This workflow diagram outlines key steps in designing high-parameter flow cytometry panels that minimize spillover spreading error through careful fluorophore selection and experimental validation.
The adoption of spectral flow cytometry represents a paradigm shift in how researchers address the persistent challenge of spillover spreading error in high-parameter cell analysis. By capturing complete emission spectra and employing sophisticated unmixing algorithms, spectral technology minimizes the fundamental limitations of conventional compensation approaches [53] [85] [3]. The resulting improvements in data accuracy enable more reliable identification of rare cell populations, clearer resolution of dim markers, and more confident characterization of complex cellular phenotypes—all critical capabilities in stem cell research and therapeutic development [53] [1].
Looking forward, the integration of artificial intelligence (AI) and machine learning with spectral flow cytometry promises to further enhance spillover management and data analysis. AI-guided fluorophore selection, already being implemented in tools like the BD Horizon RealYellow and RealBlue reagents, optimizes spectral positioning to minimize spillover from the earliest stages of experimental design [85]. Similarly, AI-driven analysis platforms can automatically identify and correct for residual spreading errors in complex datasets [87] [1]. As these technologies mature alongside continued innovation in fluorophore chemistry and instrument design, researchers can expect further reductions in spillover artifacts alongside increases in achievable parameter counts, ultimately advancing our ability to unravel cellular complexity with unprecedented precision and reliability.
In the rapidly advancing fields of stem cell research and drug development, the ability to efficiently process samples and generate reproducible data is paramount. Flow cytometry stands as a cornerstone technology for stem cell characterization, but researchers face significant challenges in workflow efficiency when using conventional systems. The emergence of spectral flow cytometry represents a transformative shift, addressing these limitations through fundamental changes in optical design and data analysis. This guide provides an objective comparison of conventional and spectral flow cytometry technologies, focusing specifically on their impact on sample throughput and data reproducibility. As the demand for complex multiparametric analysis grows, understanding these technological differences becomes crucial for researchers selecting the optimal platform for their stem cell research applications. The following sections present experimental data and detailed methodologies to illuminate how spectral technology enhances workflow efficiency while maintaining the rigorous standards required for scientific reproducibility.
Technical Comparison: Detection Mechanisms and Their Impact on Workflow
The fundamental difference between conventional and spectral flow cytometry lies in their approach to detecting fluorescent signals, which directly impacts workflow efficiency and data quality. Conventional flow cytometry uses fixed optical filters and dichroic mirrors to direct specific wavelength ranges to individual detectors, typically photomultiplier tubes (PMTs). This approach creates a 1:1 relationship between a fluorochrome and its detector, but suffers from inherent spectral overlap between fluorochromes that requires mathematical compensation, potentially introducing errors and variability [3] [7]. The need for manual compensation significantly increases experiment setup time and requires technical expertise to implement correctly.
In contrast, spectral flow cytometry captures the entire emission spectrum of each fluorochrome (generally between 400-800 nm) using multi-channel detector arrays. The emitted light is dispersed via diffraction grating or prisms, generating a unique spectral signature for each fluorochrome that is processed using advanced unmixing algorithms [3] [85]. This 1:many relationship between fluorochromes and detectors enables more precise signal discrimination without traditional compensation needs. The table below summarizes the core technical differences and their workflow implications:
Table 1: Fundamental Technical Differences Between Conventional and Spectral Flow Cytometry
| Feature | Conventional Flow Cytometry | Spectral Flow Cytometry |
|---|---|---|
| Detection Mechanism | Fixed optical filters and dichroic mirrors [3] | Prisms or diffraction gratings with detector arrays [3] |
| Fluorochrome-Detector Relationship | 1:1 [85] | 1:Many [85] |
| Signal Resolution Approach | Compensation to subtract spillover [7] | Spectral unmixing using full emission spectra [3] [7] |
| Data Acquisition | Discrete wavelength ranges | Full emission spectrum (400-800 nm) [3] |
| Workflow Impact | Requires extensive compensation setup and expertise | Simplified panel setup with automated unmixing |
Figure 1: Detection Mechanism Comparison. Conventional cytometry uses discrete filters and detectors requiring compensation, while spectral cytometry employs full-spectrum capture with mathematical unmixing.
Quantitative Performance Comparison
Direct comparison of performance metrics reveals substantial differences in the capabilities of conventional versus spectral flow cytometry systems. These differences directly impact workflow efficiency, particularly for complex stem cell studies requiring high-parameter analysis.
Throughput and Multiplexing Capacity
The ability to simultaneously measure multiple parameters from a single sample represents one of the most significant advantages of spectral technology. While conventional systems typically max out at approximately 18 colors due to spectral overlap constraints, spectral systems can resolve up to 40 parameters simultaneously from a single cell [3]. This enhanced multiplexing capacity directly translates to improved sample throughput, as researchers can obtain more information from each sample run, reducing the need for duplicate tubes and repetitive processing.
Table 2: Throughput and Multiplexing Capability Comparison
| Parameter | Conventional Flow Cytometry | Spectral Flow Cytometry |
|---|---|---|
| Maximum Practical Parameters | ~18 colors [3] | Up to 40 colors [3] |
| Sample Consumption | Higher (often requires multiple tubes) | Reduced (comprehensive data in single tube) [53] |
| Rare Cell Detection Sensitivity | Limited by background noise and interference [3] | Enhanced via autofluorescence extraction [53] |
| Minimal Residual Disease (MRD) Detection | Sensitivity challenges in complex panels | Sensitivity below 0.02% demonstrated in AML [53] |
| Autofluorescence Handling | Contributes to background noise | Can be extracted as separate signal [53] [7] |
Data Reproducibility Metrics
Reproducibility remains a critical concern in stem cell research, where phenotypic characterization must be consistent across experiments and laboratories. Spectral cytometry demonstrates advantages in several key areas affecting reproducibility. The automated unmixing process reduces operator-dependent variability compared to manual compensation in conventional systems [3]. Additionally, the technology's ability to extract autofluorescence as a distinct signal improves resolution and consistency, particularly when analyzing heterogeneous stem cell populations or samples with intrinsic fluorescence [53] [7].
Recent studies implementing spectral cytometry for minimal residual disease (MRD) detection have demonstrated exceptional sensitivity and reproducibility. For example, Chen et al. (2023) validated a 24-color spectral flow panel for acute myeloid leukemia (AML) MRD detection with sensitivity below 0.02% while maintaining strong marker correlation [53]. Similarly, in B-cell acute lymphoblastic leukemia (B-ALL), 23-color panels have successfully identified CD19-negative leukemic clones that would be challenging to detect with conventional approaches [53].
Experimental Protocols for Workflow Assessment
Sample Processing and Staining Protocol
Proper sample preparation is essential for both conventional and spectral flow cytometry, with specific considerations for stem cell populations:
Single-Cell Suspension Preparation: For adherent stem cells, use enzymatic dissociation (trypsin/EDTA) or mechanical scraping optimized to preserve surface epitopes. Include DNase (0.1-1 mg/mL) and EDTA (1-5 mM) in processing buffers to minimize aggregation [8]. Filter all samples through 35-70μm nylon mesh before acquisition to prevent instrument clogging [8].
Viability Staining: Incorporate viability dyes (e.g., fixable viability stains) at 1:1000 dilution in PBS for 10-15 minutes at 4°C before surface staining to exclude dead cells from analysis [8].
Surface Marker Staining: Prepare antibody cocktail in cold FACS buffer (PBS + 1-5% FBS + 0.1% NaN₂). Use antibody titrations determined previously (typical range 0.125-5 μg/mL per test) [8]. Incubate with cell suspension (100-500μL volume) for 20-30 minutes at 4°C in dark. Wash twice with excess FACS buffer (300-500g for 5 minutes).
Intracellular Staining (if required): Fix cells with 1-4% paraformaldehyde for 10-15 minutes at room temperature. Permeabilize with ice-cold methanol or commercial permeabilization buffers (0.1-1% saponin/ Triton X-100). Stain with intracellular antibodies for 30-60 minutes at 4°C [8].
Data Acquisition: Resuspend cells in appropriate buffer (PBS/ FACS buffer) at concentration of 5-10×10⁶ cells/mL. For spectral cytometers, include unstained control and single-stained compensation controls for each fluorophore [7].
Panel Design and Optimization Methodology
Panel design approaches differ significantly between conventional and spectral cytometry:
Conventional Panel Design: Requires meticulous compensation matrix planning. Place bright fluorochromes on low-abundance markers and dim fluorochromes on high-abundance markers. Avoid pairing fluorochromes with extensive spectral overlap in the same panel [7].
Spectral Panel Design: Leverage full spectral signatures. Use similarity index tools (available from manufacturers like Cytek) to compare emission spectra between fluorochromes [7]. Aim for combinations with low similarity indices (<0.5) for markers with high co-expression. Utilize autofluorescence extraction by including unstained controls for each sample type [7].
Figure 2: Experimental Workflow Comparison. The spectral workflow eliminates manual compensation steps through automated unmixing algorithms.
Essential Research Reagent Solutions
Successful implementation of either conventional or spectral flow cytometry requires carefully selected reagents and controls. The following table outlines essential materials and their functions for robust stem cell analysis:
Table 3: Essential Research Reagents for Flow Cytometry
| Reagent Category | Specific Examples | Function & Importance |
|---|---|---|
| Viability Dyes | Fixable viability stains (e.g., LIVE/DEAD), Propidium Iodide | Distinguishes live from dead cells; critical for accurate analysis of sensitive stem cell populations [8] |
| Antibody Types | Monoclonal antibodies, Recombinant antibodies | Monoclonal and recombinant antibodies offer superior specificity and reduced lot-to-lot variability compared to polyclonal antibodies [8] |
| Reference Controls | Compensation beads, Biological reference cells (unstained) | Essential for setting up compensation (conventional) and unmixing references (spectral); bead and cell controls recommended for spectral [7] |
| Cell Dissociation Reagents | Trypsin-EDTA, Enzyme-free dissociation buffers, DNase | Generates single-cell suspensions from adherent stem cell cultures while preserving surface epitopes [8] |
| Staining Buffers | FACS buffer (PBS + FBS + Azide), Intracellular staining kits | Maintains cell viability and prevents non-specific antibody binding during staining procedures [8] |
| New Fluorochrome Technologies | BD Horizon RealYellow 586, RealBlue reagents | Engineered dyes with reduced cross-laser excitation; improve resolution in high-parameter panels [85] |
The transition from conventional to spectral flow cytometry represents a significant advancement in workflow efficiency and data reproducibility for stem cell research. Spectral technology demonstrates clear advantages in multiparametric capability, sample throughput, and analytical consistency through its full-spectrum detection approach and automated unmixing algorithms. While conventional flow cytometry remains effective for lower-parameter applications, spectral systems offer researchers the ability to design more comprehensive panels, extract more information from precious stem cell samples, and maintain higher reproducibility across experiments. As the field continues to evolve with innovations in fluorochrome development and data analysis, spectral flow cytometry is poised to become the preferred platform for complex stem cell characterization and translational applications.
Conclusion
Spectral flow cytometry represents a paradigm shift in stem cell analysis, offering unparalleled resolution for deep immunophenotyping and the identification of rare cell populations. Its ability to simultaneously analyze up to 40+ parameters in a single tube surpasses the limitations of conventional cytometry, providing richer datasets from minimal sample material—a critical advantage for precious stem cell samples. While challenges in cost and data complexity remain, the integration of spectral cytometry with AI and advanced bioinformatics is paving the way for more personalized regenerative medicine, sophisticated disease modeling, and robust clinical trial endpoints. For researchers and drug developers, adopting spectral technology is becoming increasingly essential for driving the next wave of discoveries in stem cell biology and therapy.
References
- 1. Artificial intelligence and systems biology analysis in stem cell ... [https://pmc.ncbi.nlm.nih.gov/articles/PMC12476622/]
- 2. Beyond the Limits: How Is Spectral Flow Cytometry ... [https://www.mdpi.com/2073-4409/14/13/997]
- 3. Transformation in Cell Analysis: From Conventional to ... [https://rsisinternational.org/journals/ijrsi/articles/transformation-in-cell-analysis-from-conventional-to-spectral-flow-cytometry/]
- 4. Conventional Flow Cytometry VS. Spectral Flow Cytometry [https://www.novusbio.com/antibody-news/conventional-flow-cytometry-vs-spectral-flow-cytometry?srsltid=AfmBOoqGGVTeT8rJmZZ8PLV8JYcWSZr8NVCwrMZdDnN_Wn-aBtDuYu3O]
- 5. Spectral Flow Cytometry: The Current State and Future of ... [https://pmc.ncbi.nlm.nih.gov/articles/PMC12193525/]
- 6. Spectral Flow Cytometry: Understanding Its Advantages [https://kcasbio.com/blogs/spectral-flow-understanding-the-advantages/]
- 7. Antibodies 101: Conventional vs Spectral Flow Cytometry [https://blog.addgene.org/antibodies-101-conventional-vs-spectral-flow-cytometry]
- 8. Flow Cytometry Experimental Process—Spectral versus ... [https://www.thermofisher.com/us/en/home/life-science/cell-analysis/flow-cytometry/flow-cytometry-learning-center/flow-cytometry-resource-library/flow-cytometry-methods/spectral-flow-cytometry-experimental-process.html]
- 9. 5 Reasons to Try Spectral for Both Low and High ... [https://www.thermofisher.com/blog/life-in-the-lab/5-reasons-to-try-spectral-for-both-low-and-high-parameter-flow-cytometry/]
- 10. Flow Cytometry: Advances, Challenges and Trends [https://pubmed.ncbi.nlm.nih.gov/41311164/]
- 11. New Cytometric Horizons using Spectral Flow Cytometry - Blog [https://blog.td2inc.com/new-cytometric-horizons-using-spectral-flow-cytometry?hsLang=en]
- 12. Conventional Flow Cytometry VS. Spectral Flow Cytometry [https://www.novusbio.com/antibody-news/conventional-flow-cytometry-vs-spectral-flow-cytometry?srsltid=AfmBOoqK7VajCti3fS5gKhJ2tm0aDiKDyfnqupuBQJ_45o_Qli1xGwtI]
- 13. The Technology Behind Spectral Flow Cytometry - Blog [https://blog.td2inc.com/the-technology-behind-spectral-flow-cytometry?hsLang=en]
- 14. Full spectrum flow cytometry in the clinical laboratory - PMC [https://pmc.ncbi.nlm.nih.gov/articles/PMC10330381/]
- 15. New & Emerging Spectral Flow Cytometry Instrumentation [https://fluorofinder.com/new-and-emerging-spectral-flow-cytometry-instrumentation/]
- 16. OMIP-112: 42-Parameter (40-Color) Spectral Flow ... [https://pubmed.ncbi.nlm.nih.gov/40095400/]
- 17. Spectral Flow Cytometry Panel Controls and Sample ... [https://www.thermofisher.com/us/en/home/life-science/cell-analysis/flow-cytometry/flow-cytometry-learning-center/flow-cytometry-resource-library/flow-cytometry-methods/spectral-flow-cytometry-panel-controls-sample-preparation.html]
- 18. Spectral Panel Design [https://fluorofinder.com/spectral-panel-design-2/]
- 19. A Guide to Spectral Flow Cytometry Fluorophore Selection [https://www.thermofisher.com/us/en/home/life-science/cell-analysis/flow-cytometry/flow-cytometry-learning-center/flow-cytometry-resource-library/flow-cytometry-methods/spectral-flow-cytometry-fluorophore-selection.html]
- 20. Current Landscape of FDA Stem Cell Approvals and Trials ... [https://www.reprocell.com/blog/current-landscape-of-fda-stem-cell-approvals-and-trials-2023-2025]
- 21. Conventional Flow Cytometry VS. Spectral Flow Cytometry [https://www.novusbio.com/antibody-news/conventional-flow-cytometry-vs-spectral-flow-cytometry?srsltid=AfmBOopOVQnK-D8ohAPTAhTKoMOWitC047pVoj8G-GZTlGo1DvCAUNux]
- 22. Spectral flow cytometry: Fundamentals and future impact [https://www.sciencedirect.com/science/article/abs/pii/S0091679X24000530]
- 23. Live MOG-IgG cell-based assay: Comparison across flow ... [https://www.sciencedirect.com/science/article/pii/S0165572825002413]
- 24. Standards and the Future of Stem Cell Research [https://www.astm.org/news/standards-and-the-future-of-stem-cell-research]
- 25. Heterogeneous Structure of Stem Cells Dynamics [https://www.nature.com/articles/srep04826]
- 26. Multi-Parameter Fluorescence-Activated Cell Sorting and ... [https://pmc.ncbi.nlm.nih.gov/articles/PMC3052971/]
- 27. Spectral Flow Cytometry [https://www.bdbiosciences.com/en-us/learn/applications/multicolor-flow-cytometry/spectral-flow-cytometry]
- 28. Publishing flow cytometry data - PMC [https://pmc.ncbi.nlm.nih.gov/articles/PMC2822558/]
- 29. Multi-Parameter Flow Cytometry Technology Advances for ... [https://www.ddw-online.com/multi-parameter-flow-cytometry-technology-advances-for-rare-cell-analysis-and-sorting-1350-201308/]
- 30. Optimization of the Blocking and Signal Preservation ... [https://pmc.ncbi.nlm.nih.gov/articles/PMC12462741/]
- 31. FACS-Based Assessment of Human Hematopoietic Stem ... [https://pmc.ncbi.nlm.nih.gov/articles/PMC12429214/]
- 32. Phenotypic Analysis of Hematopoietic Stem and Progenitor ... [https://www.mdpi.com/1422-0067/25/5/2847]
- 33. Evaluating cell viability assessment techniques [https://pmc.ncbi.nlm.nih.gov/articles/PMC12492793/]
- 34. Severe inflammation and lineage skewing are associated ... [https://www.nature.com/articles/s41467-025-58321-4]
- 35. A comprehensive analysis of induced pluripotent stem cell ... [https://www.frontiersin.org/journals/cell-and-developmental-biology/articles/10.3389/fcell.2025.1593207/full]
- 36. 5 Best Practices For Accurate Flow Cytometry Results [https://expertcytometry.com/best-practices-for-accurate-flow-cytometry-results/]
- 37. Directed differentiation of human iPSCs into mesenchymal ... [https://www.sciencedirect.com/science/article/pii/S221112472300520X]
- 38. Imaging flow cytometry: from high - resolution ... [https://www.frontiersin.org/journals/bioengineering-and-biotechnology/articles/10.3389/fbioe.2025.1580749/full]
- 39. Cancer stem cells: landscape, challenges and emerging ... [https://www.nature.com/articles/s41392-025-02360-2]
- 40. Detection of Cancer Stem Cells from Patient Samples [https://www.mdpi.com/2073-4409/14/2/148]
- 41. Cancer stem cells in focus: Deciphering the dynamic ... [https://www.sciencedirect.com/science/article/pii/S0304419X25001829]
- 42. Unlocking the Power of Spectral Flow: High Parameter ... [https://oncology.labcorp.com/unlocking-power-spectral-flow-high-parameter-immunophenotypic-analysis-preclinical-and-clinical]
- 43. Recent progress on the organoids: Techniques ... [https://www.sciencedirect.com/science/article/pii/S0753332225001362]
- 44. High-throughput deconvolution of 3D organoid dynamics at ... [https://www.nature.com/articles/s41467-023-44162-6]
- 45. Flow Cytometry: A Blessing and a Curse - PMC [https://pmc.ncbi.nlm.nih.gov/articles/PMC8615642/]
- 46. Spectral Flow Cytometry [https://www.bdbiosciences.com/en-nl/learn/applications/multicolor-flow-cytometry/spectral-flow-cytometry]
- 47. Experiment Process— Flow Cytometry Spectral versus Conventional [https://www.thermofisher.com/uk/en/home/life-science/cell-analysis/flow-cytometry/flow-cytometry-learning-center/flow-cytometry-resource-library/flow-cytometry-methods/spectral-flow-cytometry-experimental-process.html]
- 48. Describing the Stem Cell Potency: The Various Methods of ... [https://pmc.ncbi.nlm.nih.gov/articles/PMC5118841/]
- 49. Validation of a Spectral Flow Cytometry Single-Tube Panel ... [https://pmc.ncbi.nlm.nih.gov/articles/PMC11592797/]
- 50. One Tube 23 Color Full Spectral Flow Cytometry Panel in ... [https://www.sciencedirect.com/science/article/pii/S0006497123082101]
- 51. Spectral Unmixing in Flow Cytometry: 7 Top Tips for Success [https://bitesizebio.com/70438/spectral-unmixing-in-flow-cytometry/]
- 52. Conventional Flow Cytometry VS. Spectral Flow Cytometry [https://www.novusbio.com/antibody-news/conventional-flow-cytometry-vs-spectral-flow-cytometry?srsltid=AfmBOorNCFv3s0E2vN7IgbwRR5WNSGScOx3-8Yw5uHwGPyvfrmvOIP3m]
- 53. Beyond the Limits: How Is Spectral Flow Cytometry ... [https://pmc.ncbi.nlm.nih.gov/articles/PMC12248732/]
- 54. Autofluorescence: what not to do [https://www.colibri-cytometry.com/post/autofluorescence-what-not-to-do]
- 55. Recent advancements in tissue dissociation techniques for ... [https://pmc.ncbi.nlm.nih.gov/articles/PMC12622302/]
- 56. Hypersonic levitation and spinning: paving the way for ... [https://www.nature.com/articles/s44172-025-00497-0]
- 57. ICCS 2025 [https://cytometry.org/public-admin/mobile/show_presentation.php?abstractno=154]
- 58. Building Successful and Complex Panels in Flow Cytometry [https://www.technologynetworks.com/analysis/articles/building-successful-and-complex-panels-in-flow-cytometry-396730]
- 59. Blog Post - Principles of Clinical Flow Assay Design [https://www.cerbaresearch.com/article/blog-post-principles-of-clinical-flow-assay-design/]
- 60. How to Prepare Spectral Flow Cytometry Datasets for High ... [https://www.frontiersin.org/journals/immunology/articles/10.3389/fimmu.2021.768113/full]
- 61. Optimizing high dimensional data classification with a ... [https://www.nature.com/articles/s41598-025-08699-4]
- 62. AI for Multi-Dimensional Data Analysis 2025 [https://www.rapidinnovation.io/post/ai-agents-for-multi-dimensional-data-analysis]
- 63. AI Data Integration: Tools & How It Works [https://airbyte.com/data-engineering-resources/ai-data-integration]
- 64. News Release Details [https://investors.cytekbio.com/news-releases/news-release-details/cytekr-biosciences-setting-new-standard-full-spectrum-flow/]
- 65. Deep metabolic profiling of immune cells by spectral flow ... [https://www.sciencedirect.com/science/article/pii/S2589004225011551]
- 66. Applications of Flow Cytometry in Drug Discovery and ... [https://pmc.ncbi.nlm.nih.gov/articles/PMC11011675/]
- 67. Why flow cytometry in drug discovery is a real life-saver [https://www.ddw-online.com/why-flow-cytometry-in-drug-discovery-is-a-real-life-saver-9208-202101/]
- 68. Advances in Multiparametric Flow Cytometry and Data ... [https://www.labx.com/resources/advances-in-multiparametric-flow-cytometry-and-data-analysis-software/5522]
- 69. Quantifying human pluripotent stem cell attributes with ... [https://pmc.ncbi.nlm.nih.gov/articles/PMC12522491/]
- 70. High-resolution single-cell RNA-seq data and ... [https://www.nature.com/articles/s41597-025-05024-6]
- 71. Flow Cytometry Market Size, Share & Report, 2033 [https://www.marketdataforecast.com/market-reports/global-flow-cytometry-market]
- 72. Minimal Residual Disease Detection: Implications for ... [https://pmc.ncbi.nlm.nih.gov/articles/PMC12079024/]
- 73. Conventional Flow Cytometry VS. Spectral Flow Cytometry [https://www.novusbio.com/antibody-news/conventional-flow-cytometry-vs-spectral-flow-cytometry?srsltid=AfmBOop5UPtj5MxbqeDEoOlcj0Fdg2iA9--YKSBGjjPXepiotfyaEd68]
- 74. A Guide to Spectral Flow Cytometry Fluorophore Selection [https://www.thermofisher.com/in/en/home/life-science/cell-analysis/flow-cytometry/flow-cytometry-learning-center/flow-cytometry-resource-library/flow-cytometry-methods/spectral-flow-cytometry-fluorophore-selection.html]
- 75. Blog Post - Seeing in Full Color – Selecting the Right ... [https://www.cerbaresearch.com/article/blog-post-seeing-in-full-color-selecting-the-right-reagents-and-instrumentation-for-your-flow-cytometry-assay/]
- 76. Twenty-four-color full spectrum flow cytometry panel for ... [https://pmc.ncbi.nlm.nih.gov/articles/PMC10390751/]
- 77. Conventional Flow Cytometry VS. Spectral Flow Cytometry [https://www.novusbio.com/antibody-news/conventional-flow-cytometry-vs-spectral-flow-cytometry?srsltid=AfmBOoqw3AeTMSxeaAFF_RrjcVZpGhJTnMzKeJi6g9jac217eu0vCs1F]
- 78. How to Prepare Spectral Flow Cytometry Datasets for High ... [https://pmc.ncbi.nlm.nih.gov/articles/PMC8640183/]
- 79. Data analysis in flow cytometry [https://www.abcam.com/en-us/technical-resources/guides/flow-cytometry-guide/data-analysis-in-flow-cytometry]
- 80. Critical Appraisal of the Side Population Assay in Stem Cell ... [https://www.sciencedirect.com/science/article/pii/S1934590911000087]
- 81. How to Interpret Flow Cytometry Data [https://www.fortislife.com/resources/antibody-resources/how-to-interpret-flow-cytometry-data]
- 82. Spectral Flow Cytometry Data Analysis [https://www.thermofisher.com/us/en/home/life-science/cell-analysis/flow-cytometry/flow-cytometry-learning-center/flow-cytometry-resource-library/flow-cytometry-methods/spectral-flow-cytometry-data-analysis.html]
- 83. Utilizing the Whole Spectrum for Flow Cytometry [https://www.criver.com/eureka/utilizing-whole-spectrum-flow-cytometry]
- 84. Conventional Flow Cytometry VS. Spectral Flow Cytometry [https://www.novusbio.com/antibody-news/conventional-flow-cytometry-vs-spectral-flow-cytometry?srsltid=AfmBOooLPbPscsJeDoELacYG_2ZqNdmTKEfOZEEjaajl8uRoMEo3lHou]
- 85. How Spectral Flow Cytometry has Changed the Landscape ... [https://www.bdbiosciences.com/en-us/learn/science-thought-leadership/blogs/spectral-flow-cytometry-fluorochrome-development]
- 86. Top Stem Cell Assay Companies & How to Compare Them ... [https://www.linkedin.com/pulse/top-stem-cell-assay-companies-how-compare-them-2025-lybue/]
- 87. AI in flow cytometry: Current applications and future ... [https://pubmed.ncbi.nlm.nih.gov/40985220/]