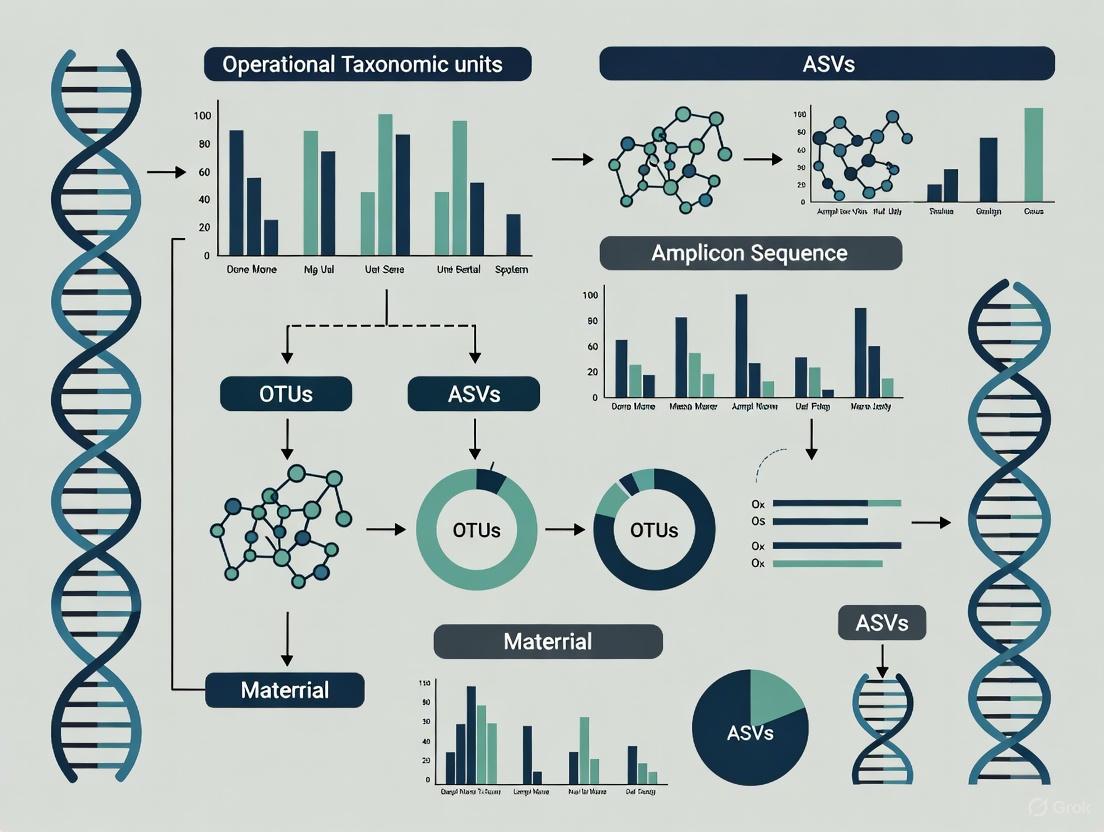
OTUs vs. ASVs: A Researcher's Guide to Microbiome Data Analysis
This article provides a comprehensive guide for researchers and drug development professionals on the critical choice between Operational Taxonomic Units (OTUs) and Amplicon Sequence Variants (ASVs) in marker-gene sequencing analysis.
OTUs vs. ASVs: A Researcher's Guide to Microbiome Data Analysis
Abstract
This article provides a comprehensive guide for researchers and drug development professionals on the critical choice between Operational Taxonomic Units (OTUs) and Amplicon Sequence Variants (ASVs) in marker-gene sequencing analysis. We cover foundational concepts, technical principles, and practical applications, drawing on current scientific literature to compare the performance, advantages, and limitations of each method. The content addresses key considerations for methodological selection, troubleshooting common issues, and validating findings, with a specific focus on implications for biomedical and clinical research, including biomarker discovery, translational applications, and study reproducibility.
OTUs and ASVs Explained: Core Concepts and Technical Foundations
In the field of microbial ecology, the accurate characterization of community diversity relies on defining discrete units from sequencing data. For years, Operational Taxonomic Units (OTUs) served as the foundational method for grouping sequences and estimating taxonomic abundance. However, a paradigm shift is underway with the rise of Amplicon Sequence Variants (ASVs), which offer single-nucleotide resolution. This guide provides an in-depth technical examination of both approaches, framing them within the broader context of modern microbiome research for scientists and drug development professionals.
Core Concepts: From Clustering to Exact Variants
What Are OTUs (Operational Taxonomic Units)?
An Operational Taxonomic Unit (OTU) is a cluster of similar marker gene sequences, typically defined by a 97% similarity threshold [1] [2]. This method groups sequences that are at least 97% identical into a single unit, which historically was believed to approximate species-level differences in microbial communities [1]. The primary purpose of OTU clustering is to reduce the complexity of sequencing data by grouping together similar sequences, which also helps smooth out minor variations caused by sequencing artifacts [1] [2].
The standard process for generating OTUs involves:
- Sequence Preprocessing: Quality filtering of raw sequencing reads.
- Clustering: Using algorithms like UCLUST, VSEARCH, or mothur to group sequences based on pairwise similarity [3] [2].
- Chimera Removal: Filtering out artificially fused sequences generated during PCR amplification [2].
- Representative Sequence Selection: Picking one sequence to represent the entire cluster for downstream taxonomic annotation [2].
What Are ASVs (Amplicon Sequence Variants)?
An Amplicon Sequence Variant (ASV) is a unique, error-corrected sequence read obtained through a process called "denoising" [1] [3]. Unlike OTUs, ASVs are not clustered based on arbitrary similarity thresholds. Instead, they represent biological sequences inferred from the data after accounting and correcting for sequencing errors [1]. ASVs provide single-nucleotide resolution, allowing researchers to distinguish between closely related microbial strains [1].
The generation of ASVs relies on sophisticated denoising algorithms:
- DADA2: Models and corrects Illumina sequencing errors to infer real biological sequences [1] [3].
- Deblur: Uses error profiles to subtract sequencing errors from the data [4].
- UNOISE3: A algorithm within the USEARCH package that also performs denoising, with its results sometimes referred to as ZOTUs [3].
OTUs vs. ASVs: A Technical Comparison
The choice between OTUs and ASVs involves trade-offs between resolution, error handling, and computational demand. The table below provides a structured comparison of their core features.
Table 1: A Comparative Overview of OTUs and ASVs
| Feature | OTU | ASV |
|---|---|---|
| Resolution | Clusters sequences at ~97% similarity [1] | Single-nucleotide precision [1] |
| Basis of Definition | Similarity-based clustering [3] | Denoising and error-correction [1] [3] |
| Error Handling | Errors can be absorbed into clusters [1] | Explicitly models and removes sequencing errors [1] |
| Reproducibility | Can vary between studies and parameters [1] | Highly reproducible across studies (exact sequences) [1] |
| Computational Cost | Generally lower [1] | Higher due to complex denoising algorithms [1] |
| Primary Tool Examples | UPARSE, VSEARCH, mothur [3] [4] | DADA2, Deblur, UNOISE3 [1] [4] |
Advantages and Disadvantages
- OTU Advantages & Disadvantages: The OTU approach is computationally efficient and somewhat tolerant of sequencing errors [1]. Its main drawback is the loss of biological resolution due to clustering, which can merge distinct but closely related species or strains [1]. Furthermore, the 97% threshold is arbitrary and may not hold true for all microbial taxa [1].
- ASV Advantages & Disadvantages: The key advantage of ASVs is their high resolution and reproducibility, facilitating direct comparison between different studies [1]. The main disadvantages are increased computational requirements and a potential for "over-resolution," where biologically insignificant variants (e.g., resulting from PCR errors) are retained, though algorithms are designed to mitigate this [1].
Methodological Workflows
The analytical pipelines for deriving OTUs and ASVs from raw sequencing data involve distinct steps and algorithms. The following workflows illustrate the standard procedures for each approach.
OTU Clustering Workflow
ASV Denoising Workflow
Algorithm Performance and Experimental Insights
A comprehensive study published in Environmental Microbiome compared the performance of four ASV denoising methods (DADA2, Deblur, MED, UNOISE3) and four OTU clustering methods (UPARSE, average neighborhood, Opticlust, VSEARCH) using defined mock microbial communities [4]. This provides a quantitative framework for evaluating these tools.
Table 2: Performance Comparison of Common OTU and ASV Algorithms
| Algorithm | Type | Microbial Composition Accuracy | Error Rate | Tendency | Computational Demand |
|---|---|---|---|---|---|
| DADA2 | ASV (Denoising) | High [4] | Low [4] | Some over-splitting [4] | Moderate [4] |
| UPARSE | OTU (Clustering) | High [4] | Low [4] | Balanced merging/splitting [4] | Lower [4] |
| Deblur | ASV (Denoising) | Good for diversity [4] | Low [4] | - | Long execution time [4] |
| UNOISE3 | ASV (Denoising) | Lower accuracy [4] | Higher [4] | More errors [4] | - |
| MED | ASV (Denoising) | Lower accuracy [4] | Higher [4] | More errors [4] | High memory & time [4] |
Key Findings from Comparative Studies
- Accuracy and Error Profile: DADA2 and UPARSE consistently demonstrated high accuracy in reconstructing the known composition of mock communities, with low overall error rates [4]. In contrast, MED and UNOISE3 showed higher error rates and poorer performance in correctly assigning sequences [4].
- Diversity Estimation: In alpha and beta diversity analyses, DADA2 and Deblur produced results most similar to the theoretical expectations of the mock communities. Among clustering methods, UPARSE also showed high similarity to expected diversity metrics [4].
- Practical Recommendations: The study suggests that ASV algorithms like DADA2 are excellent for providing consistent sequence variants across studies, making them suitable for meta-analyses. However, their default parameters can sometimes lead to over-splitting. OTU methods like UPARSE, while potentially less resolved, can be more robust for studying poorly characterized microbial environments where major community shifts are expected, as they effectively balance the merger and split of sequences [4].
Successful implementation of OTU or ASV-based analysis requires a suite of reliable software, databases, and reagents.
Table 3: Essential Tools and Reagents for Amplicon Sequence Analysis
| Category | Item | Function / Application | Example / Source |
|---|---|---|---|
| Analysis Pipelines | QIIME 2 | Integrated pipeline for processing raw data to diversity analysis, supports both OTUs and ASVs [5]. | https://qiime2.org/ |
| EasyAmplicon 2 | Modular Snakemake pipeline optimized for Illumina, PacBio, and Nanopore long-read amplicon data [6]. | https://github.com/YongxinLiu/EasyAmplicon | |
| DNA Extraction | Commercial Kits | High-yield, stable DNA extraction from complex samples (soil, roots). | FastDNATM SPIN Kit [7] |
| PCR Amplification | High-Fidelity Polymerase | Reduces PCR errors during library preparation. | Thermo Scientific Phusion Polymerase [7] |
| Reference Databases | SILVA / Greengenes | Curated 16S rRNA gene databases for taxonomic annotation [5] [8]. | https://www.arb-silva.de/ |
| MaarjAM | Specialized database for the identification of Arbuscular Mycorrhizal (AM) fungi [7]. | https://maarjam.botany.ut.ee/ | |
| Statistical & Visualization | R Package: vegan |
Performs essential ecological analyses like alpha/beta diversity [7]. | https://cran.r-project.org/package=vegan |
R Package: edgeR |
Identifies differentially abundant features between sample groups [9]. | https://bioconductor.org/packages/edgeR/ |
The evolution from OTUs to ASVs marks a significant advancement in microbial bioinformatics, driven by the demand for higher resolution, greater reproducibility, and improved data sharing across studies [1]. While OTU-based approaches remain valuable for analyzing legacy datasets, conducting broad-scale ecological surveys, or working with limited computational resources, ASV-based methods are now largely considered the preferred standard for most contemporary studies [1] [4].
The choice between OTU and ASV should be guided by the specific research question, the availability of computational resources, and the required level of taxonomic discrimination. For strain-level analysis or when integrating data from multiple studies, ASVs provide a clear advantage. However, for projects focused on high-level taxonomic trends or with computational constraints, OTU clustering can still yield robust ecological insights. As the field continues to evolve, the adoption of standardized, high-resolution units like ASVs will be crucial for deepening our understanding of microbial communities in health, disease, and the environment.
The analysis of microbial communities through marker gene sequencing, such as the 16S rRNA gene, is a cornerstone of modern microbial ecology. The bioinformatic processing of this data has undergone a significant paradigm shift, moving from the clustering of sequences into Operational Taxonomic Units (OTUs) to the generation of exact Amplicon Sequence Variants (ASVs). This evolution is driven by the pursuit of greater resolution, reproducibility, and accuracy in characterizing microbiomes. This whitepaper details the historical context, methodological foundations, and quantitative outcomes of this transition, providing a technical guide for researchers and drug development professionals navigating this evolving landscape. Understanding the operational differences between these methods is crucial for the correct interpretation of microbial data in both basic research and applied therapeutic development [10] [11].
The Era of OTU Clustering: Rationale and Methods
2.1 The Problem of Sequencing Error The initial adoption of OTU clustering was a pragmatic solution to a technical challenge. Early high-throughput sequencing technologies were prone to errors in base calling. In targeted amplicon sequencing, where the goal is to differentiate between closely related organisms based on a small number of nucleotide variations, even a low error rate could lead to the misattribution of a sequence. A few erroneous single-nucleotide variants (SNVs) could falsely suggest the presence of a new organism or cause a misclassification [11]. OTU clustering was developed to minimize this risk by grouping similar sequences, thereby "smoothing out" minor technical variations [10].
2.2 Clustering Methodologies and Workflows OTUs are clusters of sequences defined by a percent identity threshold, historically set at 97%, which was intended to approximate the species-level boundary in bacteria [10] [12]. The implementation of OTU clustering can be achieved through several approaches, each with distinct advantages and drawbacks.
- De Novo Clustering: This reference-free method clusters sequences based solely on their similarity to each other within a dataset. While it avoids biases from reference databases, it is computationally intensive, and results are not directly comparable across studies because the same sequence may cluster differently in different datasets [11].
- Closed-Reference Clustering: This method clusters sequences against a pre-defined reference database. It is computationally efficient and allows for easy comparison between studies using the same database. However, its major drawback is that sequences not found in the reference database are discarded, leading to a loss of novel diversity [11].
- Open-Reference Clustering: A hybrid approach that first uses closed-reference clustering and then clusters the remaining, unmatched sequences de novo. This aims to balance computational efficiency with the retention of novel taxa [11].
The following diagram illustrates a generalized OTU clustering workflow, as implemented in pipelines like MOTHUR.
Table 1: Key Characteristics of OTU Clustering Methodologies.
| Method | Principle | Advantages | Disadvantages |
|---|---|---|---|
| De Novo Clustering [11] | Clusters sequences based on pairwise similarity within the dataset. | Retains all sequences, including novel taxa; no reference database bias. | Computationally intensive; results are study-dependent and not directly comparable. |
| Closed-Reference Clustering [10] [11] | Clusters sequences against a reference database. | Computationally fast; results are comparable across studies. | Discards novel sequences not in the database; subject to database errors and biases. |
| Open-Reference Clustering [11] | Combines closed-reference and de novo methods. | Balances efficiency and retention of novel diversity. | Intermediate computational cost; complexity of hybrid approach. |
The Shift to ASV Denoising: Principles and Drivers
3.1 Overcoming the Limitations of Clustering The OTU clustering approach, while useful, introduced several biases. The 97% threshold is arbitrary and does not consistently correspond to a specific taxonomic level [10]. More critically, clustering inherently underestimates true biological diversity by grouping distinct sequences together. As noted in a 2024 study, clustering 100-nucleotide reads at 97% identity theoretically has room to obscure up to 64 distinct sequence variants within a single OTU, potentially leading to a massive underestimation of genetic biodiversity [10].
3.2 The Denoising Principle The ASV approach represents a fundamental shift in philosophy. Instead of clustering sequences to minimize errors, denoising employs a model to distinguish true biological sequences from sequencing errors [13] [14]. ASVs are exact, error-corrected sequences that provide single-nucleotide resolution. Key algorithms in this field include:
- DADA2: Uses a parametric error model trained on the entire sequencing run to infer true sequences [13].
- Deblur: Uses an algorithm that employs an upper error rate bound and a constant probability of indels to remove predicted error-derived reads in a sample-by-sample manner [13].
- UNOISE3: A one-pass clustering strategy that does not depend on quality scores but uses pre-set parameters to generate "zero-radius OTUs" (synonymous with ASVs) [13].
A primary advantage of ASVs is their reproducibility. Because they represent exact sequences, the same biological variant will always result in the same ASV, enabling direct comparison across different studies [11]. The following workflow outlines the core steps in an ASV-based pipeline like DADA2.
Quantitative Comparative Analyses: OTUs vs. ASVs
Independent evaluations and comparative studies have quantified the performance differences between these two approaches across various metrics and sample types.
4.1 Impact on Diversity Metrics A 2022 study comparing DADA2 (ASV) and MOTHUR (OTU) pipelines on freshwater microbial communities found that the choice of pipeline significantly influenced alpha and beta diversity metrics, more so than other methodological choices like rarefaction or the specific OTU identity threshold (97% vs. 99%). The effect was most pronounced on presence/absence indices like richness and unweighted UniFrac [14].
A separate 2018 independent evaluation of denoising tools using mock communities found that while different pipelines (DADA2, UNOISE3, Deblur) produced similar microbial community compositions, the number of ASVs identified varied drastically, directly impacting alpha diversity metrics. DADA2 tended to find more ASVs than other denoising pipelines, suggesting a higher sensitivity for rare organisms, potentially at the expense of more false positives [13].
Table 2: Comparative Effects on Ecological Metrics Based on Empirical Studies [10] [14].
| Ecological Metric | OTU Clustering Effect | ASV Denoising Effect |
|---|---|---|
| Alpha Diversity (Richness) | Underestimates true sequence diversity; can overestimate taxonomic richness due to spurious OTUs [10] [14]. | Provides higher, more accurate resolution; more sensitive to rare taxa but may infer false positives [13] [14]. |
| Beta Diversity | Can distort community similarity measurements [10]. | Results in more robust and coherent multivariate patterns [10] [14]. |
| Dominance & Evenness Indexes | Leads to distorted behavior of indexes due to sequence aggregation [10]. | Reflects more accurate biological distribution due to exact variants [10]. |
| Taxonomic Composition | Identification of major classes and genera can show significant discrepancies compared to ASV methods [14]. | Higher precision in identification at species level and beyond [11]. |
4.2 Performance in Detecting Novelty and Handling Contamination ASV-based methods provide a significant advantage in studies focusing on novel or poorly characterized environments. Since ASV generation does not rely on a reference database for the denoising step, it avoids the reference bias inherent in closed-reference OTU clustering, ensuring that novel taxa are not lost [11]. Furthermore, in the context of contamination, a study using a dilution series of a microbial community standard demonstrated that ASV-based methods were better able to differentiate sample biomass from contaminant biomass [11].
The Scientist's Toolkit: Key Reagents and Computational Tools
The implementation of OTU and ASV pipelines relies on a suite of well-established bioinformatic tools and reference materials.
Table 3: Essential Research Reagents and Tools for Metabarcoding Analysis.
| Item Name | Type | Function / Application |
|---|---|---|
| ZymoBIOMICS Microbial Community Standard [13] [11] | Mock Community | A defined mix of microbial genomes used as a positive control to benchmark the accuracy (specificity and sensitivity) of bioinformatics pipelines. |
| Silva / Greengenes / RDP [13] [14] [15] | Reference Database | Curated databases of 16S rRNA gene sequences used for taxonomic assignment of OTUs or ASVs, and for positive filtering in some pipelines. |
| DADA2 [13] [16] [14] | Software Package (R) | A widely used pipeline for inferring ASVs from amplicon data via a parametric error model. |
| MOTHUR [16] [14] [15] | Software Package | A comprehensive, all-in-one software suite for processing sequence data, with a strong legacy in OTU clustering. |
| USEARCH/VSEARCH [13] [17] | Software Tool | Tools used for a variety of sequence processing tasks, including dereplication, chimera filtering, and implementing the UNOISE3 denoising algorithm. |
| QIIME 2 [13] | Software Pipeline | A powerful, plugin-based platform that supports both OTU and ASV (via Deblur) analysis workflows. |
Detailed Experimental Protocol: A Representative Comparison
The following protocol is synthesized from methodologies used in key comparative studies [13] [14].
6.1 Sample Preparation and Sequencing
- DNA Extraction: Extract genomic DNA from samples (e.g., soil, host-associated, or mock communities) using a standardized kit (e.g., PowerSoil Pro Kit).
- PCR Amplification: Amplify the target marker gene (e.g., the V4 region of the 16S rRNA gene) using dual-indexed barcoded primers.
- Sequencing: Pool and sequence the amplicons on an Illumina MiSeq platform (or equivalent) to generate paired-end reads (e.g., 2x250 bp or 2x300 bp).
6.2 Bioinformatic Processing: Parallel OTU and ASV Pipelines Process the raw FASTQ files from Step 1 through two parallel pipelines.
ASV Pipeline (DADA2):
- Filter and Trim: Trim forward and reverse reads to a fixed length to remove low-quality bases (e.g., 270F/210R). Filter reads based on quality scores and maximum expected errors.
- Learn Error Rates: Learn the specific error rates from the dataset.
- Dereplicate: Collapse identical reads.
- Infer ASVs: Apply the core DADA2 algorithm to correct errors and infer true biological sequences.
- Merge Reads: Merge paired-end reads and remove chimeric sequences.
- Generate Table: Construct an ASV abundance table and assign taxonomy using a reference database.
OTU Pipeline (MOTHUR):
- Assemble & Filter: Merge paired-end reads. Screen sequences for length and ambiguous bases.
- Align: Align sequences to a reference alignment (e.g., SILVA database).
- Pre-cluster: Pre-cluster sequences to reduce noise.
- Chimera Removal: Remove chimeras using a tool like VSEARCH.
- Cluster: Cluster sequences into OTUs using the average neighbor algorithm at 97% and 99% identity.
- Generate Table: Construct an OTU abundance table and assign taxonomy.
6.3 Downstream Statistical Comparison
- Alpha Diversity: Calculate richness (e.g., Chao1) and diversity (e.g., Shannon) indices from the OTU and ASV tables and compare.
- Beta Diversity: Calculate both taxonomic (e.g., Bray-Curtis) and phylogenetic (e.g., Weighted/Unweighted UniFrac) dissimilarity matrices. Compare the outcomes using ordination (e.g., PCoA) and statistical tests (e.g., PERMANOVA).
- Taxonomic Composition: Compare the relative abundances of major taxa (e.g., at the phylum, family, and genus levels) identified by each method.
- Accuracy Assessment (Mock Communities): For mock community data, compare the inferred sequences (OTUs/ASVs) against the known, expected sequences to calculate metrics like sensitivity and specificity.
The evolution from OTU clustering to ASV denoising marks a maturation of microbiome bioinformatics, driven by the core scientific principles of accuracy, resolution, and reproducibility. While OTU methods laid the foundation for the field and remain useful for specific contexts like comparing legacy datasets, evidence from rigorous methodological comparisons strongly supports the adoption of ASV-based approaches for most contemporary and future studies [10] [1] [11]. The higher resolution of ASVs enables a more precise investigation of microbial ecology, including strain-level dynamics that are critical for understanding microbial function in health, disease, and drug development. As the field progresses, the reproducibility of ASVs will further facilitate the creation of large, unified datasets and meta-analyses, accelerating our understanding of the microbial world.
The analysis of marker-gene sequencing data, a cornerstone of modern microbial ecology and genetic taxonoy, rests on the fundamental step of grouping sequencing reads into discrete units. For years, the scientific community relied primarily on Operational Taxonomic Units (OTUs) clustered by similarity thresholds [18]. Recently, however, a paradigm shift has occurred toward Amplicon Sequence Variants (ASVs) inferred through statistical error models [19]. This transition represents more than a mere technical improvement; it constitutes a fundamental change in the philosophical approach to data analysis, with far-reaching implications for the reproducibility, resolution, and cross-study comparability of research findings. Within the broader thesis of understanding OTU and ASV methodologies, examining their underlying principles—similarity thresholds versus statistical error models—is crucial for researchers, scientists, and drug development professionals who depend on accurate biological interpretation of genetic data. This technical guide delves into the core mechanisms of both approaches, providing a detailed comparison of their methodologies, performance, and appropriate applications.
Core Principles: A Comparative Foundation
The fundamental difference between OTUs and ASVs lies in their approach to handling sequence variation. The following table summarizes the core principles that distinguish these two methodologies.
Table 1: Fundamental Differences Between OTU and ASV Approaches
| Feature | OTU (Similarity Threshold) | ASV (Statistical Error Model) |
|---|---|---|
| Defining Principle | Clusters sequences based on a fixed identity percentage (e.g., 97%) [18] [20] | Distinguishes sequences using a statistical model to correct errors, identifying true biological variation [18] [20] |
| Similarity Threshold | Arbitrary, user-defined (typically 97-99%) [20] | Effectively 100%; even single-nucleotide differences are resolved [20] |
| Primary Goal | Reduce data complexity and impact of sequencing errors by clustering [18] | Recover the exact biological sequences present in the sample prior to errors [19] |
| Resolution | Species or genus level (clusters similar sequences) [18] | Single-nucleotide (sub-species or strain level) [20] |
| Nature of Output | Emergent property of a dataset; cluster composition is sample-dependent [19] | Consistent biological label; has intrinsic meaning independent of the dataset [19] |
The OTU Methodology: Similarity Thresholds in Practice
Technical Workflow and Clustering Strategies
The OTU approach is predicated on the concept that sequences originating from related organisms will be similar, and that rare sequencing errors will have a minimal impact on the consensus sequence of the resulting cluster [18]. The process typically involves clustering sequencing reads that demonstrate a sequence identity above a fixed threshold, most commonly 97%, which has been conventionally used as a proxy for species-level demarcation [21] [20].
There are three primary methods for generating OTUs, each with distinct advantages and limitations:
- De novo Clustering: This method constructs OTU clusters entirely from observed sequences without a reference database. While it avoids reference bias and retains novel sequences, it is computationally expensive, and the resulting OTUs are emergent properties of the specific dataset. This means they cannot be directly compared between different studies [18] [19].
- Closed-Reference Clustering: This method compares discovered sequences to a pre-existing reference database. Reads are assigned to an OTU if they are sufficiently similar to a reference sequence. This method is computationally efficient and allows for easy comparison between studies using the same database. However, it discards sequences not represented in the reference database, leading to a loss of novel biological variation [18] [19].
- Open-Reference Clustering: This hybrid approach first clusters sequences against a reference database (like closed-reference) and then clusters the remaining, unassigned sequences de novo. It seeks to balance computational efficiency with the retention of novel diversity [18].
Limitations of the Similarity Threshold
The reliance on a fixed similarity threshold introduces several critical limitations. First, it fails to capture subtle biological sequence variations, such as single nucleotide polymorphisms (SNPs), which can be biologically significant but are collapsed into a single OTU [20]. Second, the choice of a 97% threshold, while conventional, is subjective; different thresholds can lead to inconsistent results [20]. Furthermore, the clustering process itself can be influenced by the relative abundances of sequences in the sample, meaning that the delineation of OTUs is not just a practical concern but a data-dependent one, even with infinite sequencing depth [19].
The ASV Methodology: Statistical Error Models in Practice
Technical Workflow and Denoising Algorithms
In contrast to the clustering approach, the ASV methodology employs a denoising process to distinguish biological sequences from sequencing errors. This process uses a statistical model of the sequencing errors incurred during the high-throughput sequencing process [18] [20]. Algorithms like DADA2 implement a divisive amplicon denoising algorithm that uses a parameterized error model to determine if the differences between sequence reads are more likely to be due to technical errors or true biological variation [16] [20].
The process can be broken down into key steps:
- Error Model Learning: The algorithm first learns the specific error rates for each type of substitution (e.g., A→C, A→G, etc.) from the sequence data itself.
- Partitioning Sequences: It then partitions the sequence reads into partitions, or "cores," that are consistent with having been generated from a unique biological sequence plus the known error model.
- Chimera Removal: The identified sequences are further scrutinized to remove chimeras, which are artifactual sequences formed from two or more biological parent sequences during PCR amplification [18].
The output is a table of amplicon sequence variants (ASVs), which are exact sequences inferred to be truly present in the original sample.
The DADA2 Algorithm: A Closer Look
DADA2 is a prominent algorithm for ASV inference. Its key technical features include [20]:
- Statistical Learning of Variation Probabilities: It uses a Poisson distribution-based probability model to analyze each base position, accurately calculating the likelihood that an observed sequence variant is real versus the product of a sequencing error.
- Divisive Clustering Algorithm: Through an iterative algorithm, DADA2 separates noise from real sequences, enabling the isolation of true sequence variations without relying on manually set similarity thresholds.
This method overcomes the limitations of fixed thresholds by providing single-nucleotide resolution and generating ASVs that are consistent, reproducible labels that can be directly compared across studies [19].
Comparative Analysis: Performance and Biological Interpretation
Quantitative and Qualitative Comparisons
Numerous studies have quantitatively compared the performance of OTU and ASV methods, revealing significant differences in their outputs and the subsequent biological conclusions.
Table 2: Performance Comparison of OTU vs. ASV Methods from Empirical Studies
| Study Context | Key Findings | Implication |
|---|---|---|
| 5S-IGS in Beech Species (Fagus spp.) [16] | Over 70% of processed reads were shared. DADA2-ASVs achieved a strong reduction (>80%) of representative sequences yet identified all main known variants. MOTHUR generated large proportions of rare variants that complicated phylogenies. | ASVs provided a more efficient and computationally simpler data set without losing phylogenetic signal. |
| 16S rRNA of Freshwater Communities [21] | The choice of pipeline (OTU vs. ASV) had stronger effects on alpha and beta diversity measures than other methodological choices (e.g., rarefaction). The discrepancy was most pronounced for presence/absence indices like richness. | The biological signal detected can be fundamentally influenced by the choice of analysis method. |
| Soil and Plant Microbiomes [22] | The ASV method outperformed the OTU method in estimating community richness and diversity, especially for fungal sequences and when sequencing depth was high. Differences in methods affected the number of differentially abundant families detected. | Can lead researchers to draw different biological conclusions; performance is related to community diversity and sequencing depth. |
| Mock Communities [18] [22] | ASV-based methods were better able to infer sample from contaminant biomass and provided more precise identification. In culture-based mocks, ASVs detected a richness much closer to the known number of strains than OTUs did. | ASVs offer higher sensitivity and specificity in controlled conditions, improving accuracy. |
Impact on Downstream Analysis
The choice between OTUs and ASVs significantly impacts downstream ecological and evolutionary analyses. ASVs have been shown to better discriminate ecological patterns [19]. In phylogenetic studies, ASVs effectively captured all main genetic variants with a much-reduced and more manageable set of sequences, leading to cleaner and more robust phylogenies, whereas OTU methods often produced redundant and complicated trees with many rare variants [16]. Furthermore, the consistent labeling of ASVs makes them ideal for meta-analysis and forward prediction, as biomarkers or features identified in one study can be directly applied and tested in new data sets, a process that is problematic with de novo OTUs [19].
Experimental Protocols and Methodologies
Detailed Protocol: OTU Clustering with Mothur
The following protocol is adapted from studies comparing OTU and ASV methods on 16S rRNA gene amplicon datasets [21]:
- Sequence Pre-processing: Perform quality filtering on raw paired-end Illumina reads (e.g., using the
make.contigscommand in Mothur). Remove sequences with ambiguous bases or longer than a specified length. - Alignment: Align the quality-filtered sequences against a reference alignment database (e.g., SILVA database).
- Chimera Removal: Identify and remove chimeric sequences using algorithms like UCHIME.
- Clustering: Cluster the pre-processed sequences into OTUs using the
clustercommand with a predefined identity threshold (e.g., 97% or 99%). - Taxonomic Classification: Classify the representative sequence of each OTU against a reference taxonomy database.
- Generate Feature Table: Construct a sample-by-OTU feature table that records the abundance of each OTU in every sample for downstream diversity analysis.
Detailed Protocol: ASV Inference with DADA2
The following protocol is adapted from studies using DADA2 for 16S rRNA analysis [21] and 5S-IGS analysis [16]:
- Filter and Trim: Quality filter and trim raw forward and reverse reads based on quality profiles (
filterAndTrim). Typically, truncate reads at the position where quality drops significantly. - Learn Error Rates: Learn the specific error rates from the sequence data itself (
learnErrors). This creates the error model that will be used for denoising. - Dereplication: Dereplicate the sequences to combine identical reads (
derepFastq), which reduces computation time. - Infer ASVs: Apply the core sample inference algorithm to the dereplicated data (
dada). This uses the learned error model to distinguish true biological sequences from errors. - Merge Paired Reads: Merge the denoised forward and reverse reads (
mergePairs) to create the full-length denoised sequences. - Construct Sequence Table: Construct an amplicon sequence variant (ASV) table, which is a higher-resolution analogue of the OTU table (
makeSequenceTable). - Remove Chimeras: Remove chimeric sequences identified by comparing each sequence to more abundant "parent" sequences (
removeBimeraDenovo).
Workflow Visualization
The following diagram illustrates the core logical and procedural differences between the OTU clustering and ASV denoising workflows, highlighting the divergent paths from raw sequences to the final feature table.
The Scientist's Toolkit: Essential Research Reagents and Materials
The following table details key reagents, software, and reference databases essential for conducting OTU and ASV analyses, as cited in the reviewed literature.
Table 3: Essential Research Reagents and Computational Tools for OTU/ASV Analysis
| Item Name | Function/Application | Relevant Context |
|---|---|---|
| MOTHUR | A comprehensive, expandable software pipeline for OTU clustering and analysis of microbiome data. | Used in comparative studies for OTU-based analysis of 16S rRNA and 5S-IGS data [16] [21]. |
| DADA2 | An R package that infers amplicon sequence variants (ASVs) using a statistical error model. | Used in comparative studies as a leading ASV-based method for 16S rRNA and 5S-IGS data [16] [21] [20]. |
| SILVA Database | A comprehensive, curated database of aligned ribosomal RNA (rRNA) sequences. | Used as a reference for sequence alignment and taxonomic classification in both OTU and ASV workflows [22]. |
| USEARCH/UPARSE | A algorithm and tool for OTU clustering, known for effectively removing sequencing errors and chimeras. | A representative OTU-clustering algorithm cited in methodological comparisons [20] [22]. |
| ZymoBIOMICS Microbial Community Standard | A defined mock community of microbial cells with known composition. | Used as a positive control and benchmark to validate the performance and sensitivity of OTU and ASV methods [18] [22]. |
| Illumina MiSeq Platform | A high-throughput sequencing platform for generating paired-end amplicon sequences. | The source of sequence data in multiple comparative studies cited [21]. |
The comparison between similarity thresholds and statistical error models reveals a clear evolutionary path in bioinformatics. The traditional OTU approach, with its pragmatic use of fixed thresholds, reduces complexity but at the cost of resolution, reproducibility, and cross-study comparability [19]. The ASV approach, grounded in statistical inference, provides finer resolution, generates biologically meaningful and consistent labels, and mitigates the arbitrary nature of clustering thresholds [16] [20].
While the field is moving toward wider adoption of ASVs, the choice of method should be informed by the specific research question. For well-studied environments with comprehensive reference databases, OTU methods may still be computationally practical for large-scale, population-level studies [18]. However, for exploring novel environments, requiring high-resolution analysis, or aiming for reproducible, cumulative science, ASVs offer significant advantages [19] [22]. Future developments will likely involve deeper applications of machine learning in bioinformatics and the creation of standardized analytical frameworks that can seamlessly integrate data from diverse sequencing platforms, further solidifying the principles of statistical error modeling as the standard for marker-gene data analysis [20].
In the analysis of microbial communities through 16S rRNA gene amplicon sequencing, the bioinformatic processing of raw sequence data is a critical step that defines the resolution and biological validity of the results. This field has evolved through two primary methodological paradigms: Operational Taxonomic Units (OTUs) and Amplicon Sequence Variants (ASVs). OTU-based methods, including MOTHUR and UPARSE, cluster sequencing reads at a fixed identity threshold, traditionally 97%, to approximate species-level groupings [23]. This approach reduces noise but inherently limits phylogenetic resolution by grouping similar sequences together. In contrast, ASV-based methods such as DADA2 and Deblur attempt to reconstruct exact biological sequences present in the original sample through error-correction algorithms, providing single-nucleotide resolution without clustering [24]. ASVs offer several advantages: they resolve closely related taxa, provide reproducible results across studies without arbitrary clustering thresholds, and enable direct comparison of sequences across different projects [23] [24]. The choice between these approaches significantly impacts downstream biological interpretations, with ASV methods generally providing higher specificity and sensitivity while OTU methods offer computational efficiency and established workflows.
Pipeline-Specific Methodologies and Workflows
UPARSE-OTU Algorithm and Pipeline
The UPARSE pipeline operates on an OTU-clustering approach implemented through the cluster_otus command. The algorithm employs a greedy clustering method that processes input sequences in order of decreasing abundance, based on the biological rationale that high-abundance reads are more likely to represent true amplicon sequences rather than PCR or sequencing errors [25]. Each input sequence is compared to the current OTU database using a maximum parsimony model (UPARSE-REF), with three possible outcomes: (1) if the model is ≥97% identical to an existing OTU, the sequence joins that OTU; (2) if the model is chimeric, the sequence is discarded; (3) if the model is <97% identical to any OTU, the sequence forms a new OTU [25].
The complete UPARSE pipeline involves several critical pre-processing steps: quality filtering using expected error methods, global trimming to fixed length for alignability, barcode removal before dereplication, dereplication with size annotation, and abundance-based sorting that typically discards singletons [26]. Post-clustering, recommended steps include reference-based chimera filtering using databases like Gold for 16S genes, OTU relabeling with systematic identifiers, and OTU table construction by mapping reads back to OTU representatives [26].
DADA2 Algorithm and Workflow
DADA2 implements a novel ASV inference approach based on a parametric error model that learns specific error rates from the dataset itself, rather than using a fixed clustering threshold [27]. The algorithm models the abundance p-value of each sequence, comparing the actual abundance of a specific sequence to its expected abundance given the error model and the abundances of its parent sequences [23]. This approach allows DADA2 to distinguish between true biological sequences and erroneous reads with single-nucleotide precision.
The DADA2 workflow begins with read quality profiling and visualization to inform trimming parameters. The core processing includes filtering and trimming with parameters like truncLen determined by quality score deterioration, maxN=0 (no Ns allowed), truncQ=2, and maxEE=2 (maximum expected errors) [27]. Unlike UPARSE, DADA2 performs denoising separately on forward and reverse reads before merging them, with the algorithm incorporating quality information to make it robust to lower quality sequences [27] [23]. The workflow concludes with chimera removal, sequence table construction, and taxonomy assignment.
Deblur Algorithm and Workflow
Deblur employs a greedy deconvolution algorithm that uses known Illumina error profiles to rapidly resolve single-nucleotide differences while removing sequencing errors [28] [24]. The algorithm operates on each sample independently, first sorting sequences by abundance, then iterating from most to least abundant sequence, subtracting predicted error-derived reads from neighboring sequences based on Hamming distance and an upper-bound error probability [24]. Deblur incorporates a parameterized maximal probability for indels (defaulting to 0.01) and a mean read error rate for normalization (defaulting to 0.5%) [24].
A critical requirement for Deblur is that all input sequences must be trimmed to the same length, as the algorithm cannot associate sequences with different lengths [28]. The workflow includes positive and negative filtering: negative mode removes known artifacts (e.g., PhiX, adapter sequences with ≥95% identity), while positive mode retains sequences similar to a reference database (e.g., 16S sequences with e-value ≤ 10) [28]. Deblur applies minimal reads filtering across all samples (default 10 reads) to remove rare sequences that may represent residual errors [28].
MOTHUR Workflow and Approach
MOTHUR provides a comprehensive, integrated pipeline for OTU-based analysis with an emphasis on community standards and reproducibility [23] [29]. While the search results provide less algorithmic detail compared to other pipelines, MOTHUR implements a 97% identity clustering approach similar to UPARSE but within an all-in-one toolkit environment [23]. The platform includes internal read merging and quality filtering ("screening") that is not easily performed outside the MOTHUR ecosystem [23].
MOTHUR's workflow can be executed through either a graphical interface with pipeline building and run controls or via command-line batch processing [29]. The pipeline encompasses all stages from raw read processing through OTU picking, sequence alignment, taxonomy assignment, and diversity analysis within a single framework, reducing the need for external tool integration [29].
Comparative Performance Analysis
Performance Metrics from Benchmarking Studies
A comprehensive 2020 benchmarking study compared six bioinformatic pipelines using both mock communities and large clinical datasets (N=2170) [23]. The results provide critical insights into the relative performance of these methods under realistic conditions.
Table 1: Pipeline Performance Comparison on Mock Community Data
| Pipeline | Type | Sensitivity | Specificity | Resolution | Notes |
|---|---|---|---|---|---|
| DADA2 | ASV | Highest | Moderate | Single-nucleotide | Best sensitivity, at expense of decreased specificity |
| USEARCH-UNOISE3 | ASV | High | Highest | Single-nucleotide | Best balance between resolution and specificity |
| Qiime2-Deblur | ASV | High | High | Single-nucleotide | Good performance with rapid processing |
| USEARCH-UPARSE | OTU | Moderate | Moderate | 97% identity | Good performance with lower specificity than ASV methods |
| MOTHUR | OTU | Moderate | Moderate | 97% identity | Solid performance with integrated workflow |
| QIIME-uclust | OTU | Low | Low | 97% identity | Produced spurious OTUs; not recommended |
Table 2: Computational Performance and Technical Characteristics
| Pipeline | Computational Demand | Processing Speed | Memory Usage | Stability Across Runs |
|---|---|---|---|---|
| DADA2 | High | Slowest | Growing with data size | Moderate |
| Deblur | Moderate | Faster than DADA2 | Fairly flat profile | High |
| USEARCH-UNOISE3 | Low | Fastest (order faster than Deblur) | Growing with data size | N/A |
| UPARSE | Low to Moderate | Fast | Efficient | High |
| MOTHUR | Moderate | Moderate | Moderate | High |
Key Differentiating Factors in Pipeline Performance
The benchmarking revealed several critical factors that differentiate pipeline performance:
Error Model Sophistication: DADA2's parametric error model provides the highest sensitivity but may decrease specificity by retaining some erroneous sequences [23]. In contrast, Deblur's use of static Illumina error profiles offers a good balance of sensitivity and computational efficiency [24].
Cross-Run Stability: When analyzing technical replicates across separate sequencing runs, Deblur demonstrated greater stability than DADA2, with a larger fraction of sOTUs from the first run being identified in the second run, particularly at higher frequency cutoffs [24].
Artifact Detection: In comparisons using natural communities, sequences unique to Deblur showed fewer BLAST mismatches to reference databases compared to sequences unique to DADA2, suggesting Deblur may produce more biologically plausible variants for rare sequences [24].
Quantitative Accuracy: All ASV methods (DADA2, Deblur, UNOISE3) showed improved quantitative agreement with expected abundances in mock communities compared to OTU methods, with UNOISE3 showing the best balance between resolution and specificity [23].
Experimental Protocols and Implementation
Sample Preparation and Sequencing Considerations
Proper experimental design and sample preparation are prerequisites for successful analysis regardless of the chosen bioinformatic pipeline. The benchmarking studies revealed several critical considerations:
Library Preparation: For 16S rRNA gene sequencing, the V4 region is commonly amplified using 515F and 806R primers with dual indexing [23]. PCR conditions typically involve: initial denaturation at 94°C for 47 minutes, 25 cycles of denaturation (94°C for 45 sec), annealing (52°C for 60 sec), and elongation (72°C for 90 sec), with a final elongation at 72°C for 10 minutes [23].
Sequencing Parameters: Illumina MiSeq instruments with 2×250 bp paired-end reads provide sufficient overlap for the V4 region. The inclusion of 15% PhiX control DNA helps with quality monitoring and cluster generation [23].
Quality Metrics: Successful sequencing runs should achieve >70% of bases with quality scores higher than Q30, with expected error (EE) values preferably under 2 for quality-filtered reads [30].
Critical Parameter Selection for Each Pipeline
UPARSE Parameters:
- Quality filtering: Maximum expected error filtering with
fastq_maxee 1[23] - Read merging:
maxdiffs 30in overlapping region for V4 sequences [23] - Global trimming to fixed length before dereplication [26]
- Abundance sorting with
-minsize 2to discard singletons [26]
DADA2 Parameters:
- Truncation length: Position 240 for forward reads, 160 for reverse reads (for 2×250 V4 data) [27]
- Filtering:
maxN=0,maxEE=c(2,2),truncQ=2,rm.phix=TRUE[27] - Error learning: Default parameters typically sufficient for standard datasets [27]
Deblur Parameters:
- Trim length: Fixed length required (
-t 150for 150nt sequences) [28] - Minimal reads:
--min-reads 10(default) for cross-sample abundance filtering [28] - Thread usage:
-O NNNfor parallel processing [28]
Table 3: Key Experimental Resources for 16S rRNA Amplicon Sequencing
| Resource | Function/Application | Specifications | Source/Reference |
|---|---|---|---|
| Microbial Mock Community B | Pipeline validation and error rate assessment | 20 bacterial strains with 22 sequence variants in V4 region | BEI Resources (HM-782D) [23] |
| Gold Database | Reference-based chimera checking for 16S data | Curated 16S database (not comprehensive) | USEARCH recommendations [26] |
| PhiX Control Library | Sequencing process control and error monitoring | Illumina sequencing control | Illumina [23] |
| 515F/806R Primers | V4 region 16S rRNA gene amplification | Dual-indexing compatible primers | [23] |
| SortMeRNA | Positive filtering for 16S sequences in Deblur | Version-restricted for compatibility | Deblur dependencies [28] |
| UNITE Database | Reference database for ITS region analysis | Fungal ITS sequences | USEARCH recommendations [26] |
The choice between OTU and ASV pipelines involves important trade-offs between resolution, specificity, computational demands, and analytical needs. For most contemporary applications, ASV-based methods provide superior resolution and reproducibility compared to traditional OTU clustering. Based on the comparative benchmarking:
- USEARCH-UNOISE3 provides the best balance between resolution and specificity when computational resources allow [23].
- DADA2 offers the highest sensitivity for detecting rare variants but requires greater computational resources and may benefit from additional filtering [23].
- Deblur represents an excellent compromise between performance and efficiency, with particularly strong stability across sequencing runs [24].
- UPARSE remains a robust OTU-based option when ASV-level resolution is not required, providing reliable performance with moderate computational demands [23].
- MOTHUR offers a comprehensive integrated solution for researchers preferring an all-in-one toolkit with established community standards [23].
For clinical and regulatory applications where specificity is paramount, USEARCH-UNOISE3 or Deblur may be preferred. For exploratory research where maximum sensitivity to detect rare variants is critical, DADA2 provides advantages. As sequencing technologies continue to evolve toward longer read lengths, ASV methods will likely become increasingly dominant due to their ability to leverage higher resolution data without arbitrary clustering thresholds.
In the analysis of targeted marker-gene sequencing data, the field of microbial ecology has undergone a significant methodological shift. The traditional approach of clustering sequences into Operational Taxonomic Units (OTUs) is increasingly being supplanted by methods that resolve exact Amplicon Sequence Variants (ASVs). This transition represents more than merely technical refinement; it fundamentally alters how researchers measure, compare, and interpret microbial diversity. The core distinctions between these approaches revolve around two interconnected concepts: the property of consistent labeling and the degree of dependence on reference databases. These properties have profound implications for computational tractability, meta-analysis, replication of scientific findings, and the accuracy of diversity measurements [31] [32]. This technical guide examines these critical distinctions within the broader context of OTU and ASV research, providing researchers and drug development professionals with a comprehensive framework for selecting appropriate methodologies based on their specific research objectives and sample types.
Fundamental Conceptual Differences Between OTUs and ASVs
Operational Taxonomic Units (OTUs): Cluster-Based Approaches
OTUs are defined through a clustering process where sequencing reads are grouped based on sequence similarity above a predetermined threshold, most commonly 97% [32] [21]. These clusters represent abstract biological units whose boundaries and membership are emergent properties of a specific dataset.
- De Novo OTUs: Constructed by clustering sequencing reads based on pairwise similarity within a dataset without reference to existing databases. This method is computationally expensive and produces OTUs that are intrinsically tied to the dataset in which they were defined, lacking consistent labels for cross-study comparison [31] [32].
- Closed-Reference OTUs: Defined by comparing sequencing reads to a pre-existing reference database, with reads assigned to OTUs based on similarity to reference sequences. This method offers computational efficiency and consistent labeling but systematically discards biological variation not represented in the reference database [31].
- Open-Reference OTUs: A hybrid approach that first uses closed-reference methods followed by de novo clustering of reads that fail to match reference sequences, attempting to balance the advantages of both methods [32].
Amplicon Sequence Variants (ASVs): Denoising-Based Approaches
ASVs represent an alternative paradigm that resolves biological sequences exactly, down to single-nucleotide differences, without imposing arbitrary dissimilarity thresholds. ASV methods use error models to distinguish biological sequences from sequencing errors, inferring the true biological sequences present in the sample prior to amplification and sequencing artifacts [31] [32]. Unlike OTUs, ASVs are not emergent properties of a dataset but represent biological realities with intrinsic meaning—the exact DNA sequences of the assayed organisms. This fundamental difference grants ASVs the property of consistent labeling, enabling valid comparison across different studies and samples [31].
Table 1: Fundamental Characteristics of OTUs and ASVs
| Characteristic | De Novo OTUs | Closed-Reference OTUs | ASVs |
|---|---|---|---|
| Definition Basis | Emergent from dataset clustering | Similarity to reference sequence | Inferred biological sequence |
| Resolution | 97% similarity threshold | 97% similarity threshold | Single-nucleotide |
| Reference Dependence | None (reference-free) | Complete | None (reference-free) |
| Consistent Labeling | No | Yes | Yes |
| Computational Scaling | Quadratic with study size | Linear with study size | Linear with study size |
| Novel Diversity Capture | Complete | None | Complete |
Consistent Labeling: Theoretical Foundations and Practical Consequences
Conceptual Framework of Consistent Labeling
Consistent labeling refers to the property of a feature that can be reproducibly identified across different studies, datasets, and processing events. This property exists when the feature represents a biological reality independent of the data being analyzed [31]. The schematic below illustrates the region of validity for each feature type, where the x-axis represents all biological variation at the sequenced genetic locus and the y-axis represents all current and future amplicon data.
Practical Implications of Consistent Labeling
The property of consistent labeling confers several critical advantages for microbial data analysis:
Computational Tractability: Methods with consistent labels (closed-reference OTUs and ASVs) enable parallel processing of data subsets that can be merged afterward. In contrast, de novo OTU methods require pooling all data before clustering, resulting in a quadratic scaling of computational costs that becomes prohibitive for large studies [31]. ASV inference can be performed independently on each sample, allowing total computation time to scale linearly with sample number.
Meta-Analysis Capability: The growing availability of marker-gene studies creates opportunities for powerful cross-study analyses. Consistently labeled features allow per-study tables to be directly merged into cross-study tables, while de novo OTUs require reprocessing raw sequence data from all studies together—a computationally intensive and often impractical endeavor [31].
Replication and Falsification: Scientific reproducibility requires that findings can be tested in new datasets. Associations reported between a de novo OTU and experimental conditions cannot be directly tested in new data because that specific OTU only exists within its original dataset. In contrast, associations involving ASVs or closed-reference OTUs can be directly examined in independent studies [31].
Forward Prediction: When microbial community features are used as predictive biomarkers (e.g., for health conditions), only consistently labeled features can be applied to new data. Predictive models based on de novo OTUs are confined to the dataset in which they were trained, while ASV-based predictors can be deployed on future samples [31].
Reference Database Dependence: Implications for Diversity Assessment
Methodological Dependence on Reference Databases
The degree of dependence on reference databases represents another critical distinction between approaches, with significant consequences for diversity measurement and application across environments.
Closed-Reference OTUs: Complete dependence on reference databases means that biological variation unrepresented in the database is systematically excluded from analysis. This introduces database-specific biases that can skew diversity measures, particularly if some experimental conditions are associated with higher proportions of unrepresented taxa [31].
De Novo OTUs and ASVs: Both approaches are reference-free during feature definition, capturing all biological variation present in the data regardless of its representation in existing databases. This makes them particularly valuable for studying novel or undersampled environments [31] [32].
Impact on Diversity Measurements
The choice between reference-dependent and reference-free methods significantly influences alpha and beta diversity measures. A 2022 study comparing DADA2 (ASV-based) and Mothur (OTU-based) pipelines found that the choice of method had stronger effects on diversity measures than other methodological choices like rarefaction or OTU identity threshold (97% vs. 99%) [21]. The discrepancy was particularly pronounced for presence/absence indices such as richness and unweighted UniFrac, though rarefaction could partially attenuate these differences [21].
Table 2: Impact of Method Choice on Diversity Measurements Across Environments
| Environment Type | Recommended Method | Rationale | Diversity Measurement Impact |
|---|---|---|---|
| Well-Studied (e.g., Human Gut) | Closed-Reference OTUs or ASVs | High reference database coverage (>90%) | Minimal bias with closed-reference; ASVs provide higher resolution |
| Moderately Studied | ASVs or Open-Reference OTUs | Partial database coverage | ASVs capture novel diversity more completely |
| Novel Environments | ASVs or De Novo OTUs | Limited database coverage | Reference-dependent methods systematically underestimate diversity |
| Cross-Study Comparisons | ASVs | Consistent labeling without reference bias | Enables valid comparison while capturing full diversity |
Experimental Protocols and Methodological Implementation
Standardized Workflow for Method Comparison
To evaluate the practical implications of these theoretical distinctions, researchers can implement the following experimental protocol for comparing OTU and ASV approaches:
Sample Collection and DNA Extraction
- Collect samples from relevant environments (e.g., 54 sediment, 54 seston, and 119 host-associated samples as in Chiarello et al., 2022) [21].
- Extract genomic DNA using standardized kits (e.g., DNeasy PowerSoil Kit for environmental samples).
- Quantify DNA concentration using fluorometric methods and normalize concentrations.
Library Preparation and Sequencing
- Amplify the V4 hypervariable region of the 16S rRNA gene using primers 515F/806R.
- Perform PCR amplification with the following cycling conditions: initial denaturation at 94°C for 3 minutes; 30 cycles of 94°C for 45s, 50°C for 60s, 72°C for 90s; final extension at 72°C for 10 minutes.
- Purify amplicons using bead-based cleanups and quantify with fluorometry.
- Pool equimolar amounts of amplicons and sequence on Illumina MiSeq platform with 2×250 bp chemistry.
Bioinformatic Processing - OTU Approach
- Process raw sequences using Mothur pipeline following standard operating procedure.
- For de novo OTUs: Cluster sequences at 97% and 99% identity thresholds using the average neighbor algorithm.
- For closed-reference OTUs: Map sequences to SILVA or Greengenes database at 97% identity.
- Chimera removal using UCHIME and taxonomic assignment with the RDP classifier.
Bioinformatic Processing - ASV Approach
- Process raw sequences using DADA2 pipeline in R environment.
- Perform quality filtering, error rate learning, sample inference, and chimera removal.
- Merge paired-end reads and assign taxonomy using the same reference database as OTU methods for comparative purposes.
Downstream Diversity Analysis
- Rarefy all community tables to even sequencing depth.
- Calculate alpha diversity metrics (richness, Shannon diversity, Faith's PD).
- Calculate beta diversity metrics (Bray-Curtis, Jaccard, weighted and unweighted UniFrac).
- Perform statistical comparisons (PERMANOVA, ANOVA) to evaluate methodological effects.
Essential Research Reagent Solutions
Table 3: Key Research Reagents and Computational Tools for OTU/ASV Analysis
| Reagent/Tool | Function | Application Notes |
|---|---|---|
| DNeasy PowerSoil Kit | DNA extraction from environmental samples | Effective for difficult-to-lyse microorganisms; minimizes inhibitor co-extraction |
| Illumina MiSeq Reagent Kit v3 | 2×300 bp paired-end sequencing | Optimal for V4 region of 16S rRNA gene; provides sufficient overlap for merging |
| 16S rRNA Gene Primers (515F/806R) | Amplification of V4 hypervariable region | Broad taxonomic coverage; well-established for human and environmental microbiomes |
| SILVA Database | Reference database for taxonomy assignment | Comprehensive curation; regularly updated; includes quality-controlled alignments |
| Greengenes Database | Alternative reference database | Well-established but no longer actively curated; useful for historical comparisons |
| Mothur Pipeline | OTU-based sequence processing | Implements multiple clustering algorithms; includes comprehensive quality control |
| DADA2 R Package | ASV-based sequence processing | Uses parametric error models; resolves exact sequence variants; integrates with Phyloseq |
| QIIME 2 Platform | Integrated microbiome analysis | Supports both OTU and ASV workflows; extensive plugin ecosystem for specialized analyses |
Comparative Analysis of Methodological Performance
Performance Across Sample Types and Environments
The relative performance of OTU versus ASV approaches varies depending on the characteristics of the microbial community under investigation and the specific research questions being addressed.
Well-Characterized Environments In environments with comprehensive reference database coverage, such as the human gut, closed-reference OTU methods can capture >90% of sequencing reads while offering computational efficiency [31] [32]. However, even in these contexts, ASV methods provide superior resolution for distinguishing closely related taxa—for example, discriminating pathogenic Neisseria gonorrhoeae from commensal Neisseria species [31].
Novel or Undersampled Environments For environments with limited representation in reference databases, such as unusual aquatic systems or extreme environments, ASV and de novo OTU approaches significantly outperform closed-reference methods. ASVs offer particular advantages in these contexts by combining reference-free operation with consistent labeling, enabling cross-study comparisons without sacrificing novel diversity [32].
Low-Biomass and Contaminated Samples Studies using dilution series of microbial community standards have demonstrated that ASV-based methods more accurately distinguish true signal from contamination. The precise nature of ASVs facilitates identification of both sample and contaminant sequences, making them particularly valuable for challenging samples with low microbial biomass [32].
Quantitative Comparison of Methodological Outputs
Table 4: Quantitative Comparison of OTU and ASV Method Performance
| Performance Metric | De Novo OTUs | Closed-Reference OTUs | ASVs |
|---|---|---|---|
| Richness Estimation | Often overestimates [21] | Underestimates (misses novel diversity) | Most accurate with mock communities [32] |
| Sensitivity to Rare Taxa | High (but includes spurious OTUs) [32] | Low (rare novel taxa lost) | High (DADA2 most sensitive) [32] |
| Specificity | Moderate (includes some errors as diversity) | High for known taxa | High (statistical error removal) [32] |
| Cross-Study Comparability | None (must reprocess jointly) | High (with same reference) | High (intrinsically comparable) |
| Computational Time | High (scales quadratically) | Low (scales linearly) | Moderate (scales linearly) |
| Chimera Detection | Reference-based; less sensitive | Reference-based; less sensitive | Superior (exact sequence alignment) [32] |
| Taxonomic Resolution | Species level (97% threshold) | Species level (97% threshold) | Sub-species level (single nucleotide) |
Implications for Drug Development and Translational Research
The distinction between OTUs and ASVs carries particular significance for drug development professionals utilizing microbiome data in translational research contexts.
Biomarker Discovery and Validation The consistent labeling of ASVs enables development of predictive biomarkers that can be validated across independent cohorts and clinical sites. In contrast, biomarkers based on de novo OTUs are confined to the discovery dataset, requiring indirect validation through taxonomic assignment or diversity summaries [31].
Clinical Trial Design Longitudinal studies and multi-center trials benefit tremendously from ASV-based approaches, as data from different time points and locations can be validly combined without reprocessing. This maintains statistical power while reducing computational burdens in large-scale clinical investigations.
Therapeutic Monitoring When evaluating microbiome responses to therapeutic interventions, ASVs provide the resolution necessary to detect subtle shifts in microbial populations that might reflect mechanistic responses or off-target effects. The higher resolution of ASVs is particularly valuable for tracking specific bacterial strains throughout treatment courses.
The workflow below illustrates how ASVs enhance translational research applications through consistent labeling and reduced reference bias:
The critical distinction between OTUs and ASVs rests fundamentally on their respective positions regarding consistent labeling and reference database dependence. ASVs uniquely combine the advantages of both closed-reference OTUs (consistent labeling, computational efficiency, cross-study comparability) and de novo OTUs (reference-free operation, comprehensive diversity capture, applicability to novel environments). While OTU-based approaches remain valid for specific research contexts—particularly well-characterized environments where reference database coverage is comprehensive—the accumulating evidence suggests that ASV methods offer significant advantages for most contemporary research applications. The property of consistent labeling particularly enhances reproducibility, meta-analysis capability, and translational potential, positioning ASVs as the emerging standard for marker-gene analysis in both basic research and drug development contexts. As the field continues to evolve, methodological choices should be guided by both theoretical principles and empirical performance characteristics relative to specific research objectives and sample characteristics.
Choosing Your Method: A Practical Guide for Research Design
In the analysis of high-throughput marker-gene sequencing data, researchers face a fundamental methodological choice: whether to cluster sequences into Operational Taxonomic Units (OTUs) or to resolve exact Amplicon Sequence Variants (ASVs). This decision significantly impacts all downstream analyses, from diversity assessments to biomarker discovery. OTUs represent a traditional approach where sequences are clustered based on a fixed similarity threshold, typically 97%, which reduces computational burden and mitigates sequencing errors by grouping similar sequences [20] [21]. In contrast, ASVs are generated through denoising algorithms that distinguish biological sequences from sequencing errors at single-nucleotide resolution, providing exact sequence variants without relying on arbitrary clustering thresholds [19] [20]. This technical guide provides a comprehensive framework for selecting between these approaches based on your project's specific research objectives, analytical requirements, and technical constraints.
Technical Foundations: How OTUs and ASVs Are Generated
OTU Clustering Methodologies
The OTU clustering workflow employs similarity-based algorithms to group sequences. The process begins with quality filtering of raw sequencing reads, followed by dereplication and clustering using algorithms such as UPARSE, MOTHUR, or VSEARCH that group sequences based on percent identity [33] [20]. Most commonly, a 97% similarity threshold is applied, meaning sequences with 97% or greater identity are collapsed into a single OTU. This approach assumes that sequencing errors will be merged with correct biological sequences during clustering, thereby reducing the impact of technical artifacts [21]. The representative sequence for each OTU is typically the most abundant sequence in its cluster. While effective for noise reduction, this method inevitably merges biologically distinct sequences that fall within the similarity threshold, potentially obscuring true genetic variation [20].
ASV Denoising Algorithms
ASV generation employs fundamentally different denoising algorithms such as DADA2, Deblur, and UNOISE3 that use statistical models to correct sequencing errors [33]. These methods do not cluster sequences; instead, they infer the true biological sequences in the original sample by modeling and removing errors introduced during amplification and sequencing. The DADA2 algorithm, for instance, implements a divisive amplicon denoising approach that uses a parameterized model of substitution errors to distinguish true biological sequences from errors [20]. This process retains single-nucleotide differences that are statistically supported as biological variation, providing higher resolution than OTU clustering. ASV methods produce consistent labels with intrinsic biological meaning that can be directly compared across studies without reference databases [19].
Visual Comparison of Workflows
The diagram below illustrates the key differences in the bioinformatic workflows for generating OTUs and ASVs:
Performance Comparison: Quantitative Benchmarking
Methodological Comparison Using Mock Communities
Benchmarking studies using complex mock communities comprising 227 bacterial strains across 197 species provide objective performance measures [33] [34]. These controlled samples with known composition enable precise evaluation of error rates, detection sensitivity, and taxonomic accuracy across bioinformatic methods.
Table 1: Performance Metrics from Mock Community Benchmarking
| Performance Metric | OTU Methods (UPARSE) | ASV Methods (DADA2) | Research Implications |
|---|---|---|---|
| Error Rate | Lower error rates | Higher error rates | OTUs more effective at suppressing technical noise |
| Over-splitting | Less over-splitting | Moderate over-splitting | ASVs may split single strains into multiple variants |
| Over-merging | More over-merging | Less over-merging | OTUs may merge biologically distinct sequences |
| Community Similarity | Closest to intended structure | Close to intended structure | Both capture overall community patterns effectively |
| Alpha Diversity | Higher richness estimates | Lower, more accurate estimates | ASVs provide more realistic diversity measures |
| Computational Efficiency | Faster processing | More computationally intensive | OTUs preferable for very large datasets |
Impact on Ecological Interpretation
The choice between OTUs and ASVs significantly influences ecological interpretation, with effects exceeding those of other common methodological decisions like rarefaction level or OTU identity threshold (97% vs. 99%) [21]. Studies comparing freshwater invertebrate gut and environmental communities found the pipeline choice (DADA2 vs. MOTHUR) significantly affected alpha and beta diversity measures, particularly for presence/absence indices like richness and unweighted UniFrac [21]. These discrepancies can be partially mitigated by rarefaction, but the fundamental differences in resolution remain. For comparative analyses, ASVs provide more consistent labeling across studies, enabling direct meta-analyses without reprocessing raw data [19].
Decision Framework: Selecting the Appropriate Method
Research Scenario Guidance
Table 2: Method Selection Based on Research Objectives
| Research Type | Recommended Method | Key Technical Considerations |
|---|---|---|
| 16S rRNA Short Fragments (e.g., V3-V4) | ASV | Superior for high-resolution analysis of short regions; excels at detecting rare variants and single-nucleotide differences |
| Full-Length Amplicons (Third-generation sequencing) | OTU | More practical for long fragments; recommended similarity threshold of 98.5%-99% for species-level clustering |
| Microbial Source Tracking | ASV | Consistent labels allow direct comparison across independent studies; enables forward prediction for biomarkers |
| Community Ecology Studies | OTU or ASV | Both capture major patterns; ASV preferable for fine-scale dynamics, OTU for broad community comparisons |
| Phylogenetic Analysis | ASV | More effective reduction of representative sequences while capturing known variant types; computationally efficient for large sample sets |
| Functional Prediction | ASV | Higher resolution improves correlation with metagenomic data; more accurate identification of functional biomarkers |
| Large-Scale Biomonitoring | OTU | Lower computational requirements advantageous when processing thousands of samples with limited resources |
Technical and Experimental Considerations
- Sequencing Platform: Illumina platforms generating high-quality short reads are ideal for ASV analysis. For long-read technologies (PacBio, Oxford Nanopore), OTU clustering is often more practical, though PacBio HiFi reads can now be processed with DADA2 [35].
- Amplicon Characteristics: Short fragment primers (e.g., V4) benefit from ASV's precise error correction. For full-length 16S rRNA sequencing, OTU clustering with adjusted thresholds (98.5%-99%) is more appropriate [20].
- Computational Resources: ASV methods require greater computational power, especially for large sample sizes. DADA2's statistical modeling and error correction have significant hardware demands that may constrain researchers with limited infrastructure [20].
- Taxonomic Resolution Needs: For species-level or strain-level discrimination, ASVs provide superior resolution. For broader taxonomic comparisons at genus or family level, both methods perform similarly [35].
- Data Reusability Requirements: If consistent labeling across studies is essential for meta-analysis or biomarker development, ASVs provide inherent advantages through their status as biologically meaningful units [19].
Decision Flowchart
The following diagram outlines a systematic approach for selecting between OTU and ASV methods:
Experimental Protocols and Reagent Solutions
Standardized Processing Workflows
For OTU clustering using MOTHUR, the protocol involves: (1) quality filtering based on quality scores; (2) alignment to reference databases (e.g., SILVA); (3) pre-clustering to reduce noise; (4) chimera removal using UCHIME; (5) distance matrix calculation; and (6) clustering using the Opticlust algorithm with a 97% cutoff [21]. For ASV inference using DADA2, the workflow includes: (1) quality profiling and filtering; (2) learning error rates from the data; (3) dereplication; (4) sample inference; (5) merging paired-end reads; (6) constructing sequence tables; and (7) removing chimeras [21]. NASA's GeneLab has developed a standardized amplicon sequencing processing pipeline that incorporates these steps for reproducible taxonomic analysis [36].
Research Reagent Solutions and Experimental Materials
Table 3: Essential Research Reagents and Materials for Amplicon Sequencing
| Reagent/Material | Function | Application Notes |
|---|---|---|
| DNeasy PowerSoil Kit (QIAGEN) | DNA extraction from complex samples | Effective for difficult samples like soil, sediment, and feces; minimizes inhibitor co-extraction |
| KAPA HiFi HotStart Polymerase | PCR amplification for PacBio | High-fidelity amplification essential for long-read sequencing; reduces amplification errors |
| Nextera XT Index Kit (Illumina) | Sample multiplexing | Dual indices allow pooling of multiple samples; compatible with Illumina platforms |
| SMRTbell Express Template Prep Kit (PacBio) | Library preparation for SMRT sequencing | Optimized for constructing SMRTbell libraries from amplicon targets |
| 16S Barcoding Kit (Oxford Nanopore) | Library preparation for nanopore | Contains primers for full-length 16S amplification and barcodes for multiplexing |
| SILVA Database | Taxonomic classification | Curated database of aligned ribosomal RNA sequences; enables consistent taxonomy assignment |
| RDP Database | Taxonomic classification | Provides taxonomic standards for bacterial classification using 16S rRNA sequences |
Future Perspectives and Emerging Trends
The ongoing methodological shift from OTUs to ASVs reflects broader trends toward higher resolution and reproducibility in microbial ecology. Emerging technologies include machine learning applications for improved error correction and classification models, with tools like DADA2 potentially evolving to incorporate deep learning techniques [20]. Cross-platform standardization represents another critical direction, with efforts underway to develop unified analytical frameworks accommodating data from Illumina, PacBio, and Oxford Nanopore technologies [20]. For third-generation sequencing producing full-length 16S rRNA reads, hybrid approaches that leverage ASV-style denoising with optional clustering may offer optimal solutions balancing resolution with biological relevance [35]. As benchmarking studies using increasingly complex mock communities continue [33] [34], researchers will gain clearer insights into the specific scenarios where each method provides maximal scientific value.
The 16S ribosomal RNA (rRNA) gene sequencing serves as a cornerstone in microbial ecology, enabling researchers to decipher the composition and dynamics of complex microbial communities. This technical guide explores two fundamental methodological considerations: the selection of hypervariable regions for short-amplicon sequencing and the emerging adoption of full-length 16S rRNA gene sequencing. Within the context of operational taxonomic units (OTUs) and amplicon sequence variants (ASVs) research, these choices directly impact taxonomic resolution, data accuracy, and cross-study comparability. As the field moves toward more precise microbial profiling, understanding these technical parameters becomes crucial for researchers, scientists, and drug development professionals aiming to derive biologically meaningful conclusions from microbiome data.
The 16S rRNA gene, approximately 1,500 base pairs in length, contains nine hypervariable regions (V1-V9) flanked by conserved sequences [37]. These variable regions provide the phylogenetic resolution necessary for taxonomic classification, while the conserved regions enable primer binding for PCR amplification. Historically, second-generation sequencing platforms (e.g., Illumina MiSeq) have dominated microbiome research due to their high throughput and low error rates, but their limited read length (typically 2×300 bp) restricts analysis to one or several hypervariable regions [38]. This technical constraint has prompted extensive research into which variable regions provide optimal resolution for specific microbial environments and research questions.
Recent advances in third-generation sequencing technologies, particularly PacBio's Single Molecule Real-Time (SMRT) sequencing and Oxford Nanopore Technologies (ONT), now enable full-length 16S rRNA gene sequencing [39]. This approach captures all nine variable regions in a single read, potentially offering superior taxonomic resolution down to the species level. However, this advancement introduces new methodological considerations, including higher initial error rates (though significantly improved with circular consensus sequencing), increased costs per read, and continued primer bias challenges [38]. The choice between targeted variable regions and full-length sequencing must therefore be informed by research goals, budgetary constraints, and required taxonomic resolution.
Framed within the broader thesis of OTU and ASV research, these primer and amplicon considerations directly influence the fundamental units of analysis in microbiome studies. The transition from OTU-based clustering (typically at 97% similarity) to ASV-based denoising methods represents a paradigm shift in how microbial communities are characterized [14]. This evolution toward higher resolution creates an imperative for optimized primer selection and sequencing strategies that maximize the biological information captured while minimizing technical artifacts.
Hypervariable Region Selection for Short-Amplicon Sequencing
Performance Characteristics of Common Variable Regions
The selection of which hypervariable region(s) to target represents a critical decision point in 16S rRNA amplicon sequencing study design. Different variable regions exhibit substantial variation in their ability to resolve specific taxonomic groups, making regional selection a key determinant of observed community composition [37]. Comparative studies have demonstrated that primer choice significantly influences microbial profiles, with certain bacterial taxa being underrepresented or completely missed when using unsuitable primer combinations [37].
The most commonly targeted regions for human microbiome studies include V1-V2, V3-V4, and V4, each with distinct advantages and limitations [37]. For instance, the V4 region is frequently used due to its balanced taxonomic coverage across major bacterial phyla, while V1-V2 often provides superior resolution for specific taxa like Bifidobacterium and Lactobacillus. However, certain primer pairs demonstrate notable limitations, such as the 515F-944R combination which may miss Bacteroidetes populations entirely [37]. These regional biases necessitate careful selection based on the microbial communities of interest and the specific research questions being addressed.
The taxonomic resolution achievable with different variable regions varies considerably. Some regions enable discrimination only at the phylum or family level, while others can resolve genus-level or even species-level differences for certain bacterial groups [37]. This differential resolution stems from the varying evolutionary rates across the 16S rRNA gene, with some hypervariable regions accumulating mutations more rapidly than others. Consequently, the choice of target region directly impacts the depth of biological insight attainable from a study.
Table 1: Performance Characteristics of Commonly Targeted 16S rRNA Gene Regions
| Target Region | Common Primer Pairs | Strengths | Limitations | Recommended Applications |
|---|---|---|---|---|
| V1-V2 | 27F-338R | Good for Bifidobacterium and Lactobacillus; high sequence variability | May miss some Gram-positive bacteria; shorter read length | Human gut microbiome studies |
| V3-V4 | 341F-785R | Broad taxonomic coverage; commonly used | May overrepresent certain Proteobacteria | General microbial ecology; environmental samples |
| V4 | 515F-806R | Balanced coverage; minimal length heterogeneity | Lower resolution for some Staphylococci | Large-scale consortium studies (e.g., Earth Microbiome Project) |
| V4-V5 | 515F-944R | Extended coverage of V4 and V5 | May miss Bacteroidetes [37] | Specific research questions requiring V5 region |
| V6-V8 | 939F-1378R | Covers multiple variable regions | Less commonly used; limited validation | Specialized applications |
| V7-V9 | 1115F-1492R | Useful for certain environmental microbes | Poor for some Gram-positive bacteria | Marine and extreme environments |
Impact on Taxonomic Classification and Database Compatibility
The selection of variable regions extends beyond mere coverage considerations to encompass compatibility with reference databases and taxonomic assignment accuracy. Different classification databases (GreenGenes, SILVA, RDP) vary in their nomenclature and precision for classifying sequences from different variable regions [37]. For example, discrepancies in genus-level assignment can occur due to database-specific naming conventions (e.g., Enterorhabdus versus Adlercreutzia) [37]. Additionally, some databases lack certain taxonomic groups altogether, such as Acetatifactor in GreenGenes and the genomic-based 16S rRNA Database [37].
The position of the targeted variable region within the full 16S rRNA gene can influence classification accuracy due to uneven representation in reference databases. Some regions may be overrepresented for certain taxa while containing sparse sequences for others, potentially leading to misclassification or assignment failures. This effect is particularly pronounced for rare or recently discovered taxa that may have limited sequence representation in public databases.
Bioinformatic processing parameters, particularly read truncation settings, must be optimized for each targeted region and primer combination [37]. Inappropriate length filtering can disproportionately remove valid sequences from certain taxa, introducing another layer of bias into community composition results. Therefore, specific truncated-length combinations should be empirically tested for each study rather than relying on default parameters [37].
Full-Length 16S rRNA Gene Sequencing
Technological Platforms and Methodological Considerations
Full-length 16S rRNA gene sequencing leverages third-generation sequencing technologies to capture the complete ∼1,500 bp gene in a single read, overcoming the limitations of short-amplicon approaches [38]. Two platforms currently dominate this space: PacBio's SMRT sequencing and Oxford Nanopore Technologies (ONT). PacBio employs circular consensus sequencing (CCS) to generate highly accurate long reads (HiFi reads) through multiple passes of the same template, while ONT provides real-time sequencing through nanopore detection [39]. Both technologies have seen significant improvements in accuracy and throughput, with error rates dropping to below 2% for the latest chemistry versions [39].
The primary advantage of full-length sequencing lies in its enhanced taxonomic resolution. By capturing all variable regions, this approach provides substantially more phylogenetic information compared to short-read techniques [38]. Computer simulations and empirical studies have demonstrated that longer reads improve classification accuracy, particularly for challenging taxonomic groups with highly similar 16S rRNA gene sequences, such as streptococci or the Escherichia/Shigella group [38]. This increased resolution enables reliable species-level identification, which is often impossible with short-read approaches that typically resolve only to genus level [40].
Despite these advantages, full-length 16S rRNA sequencing presents unique methodological considerations. Primer bias remains a significant challenge, as demonstrated by comparative studies of different 27F primer formulations [39]. Strikingly, different degeneracy in 27F primers led to significant variations in both taxonomic diversity and relative abundance of numerous taxa, with one primer revealing significantly lower biodiversity and an unusually high Firmicutes/Bacteroidetes ratio compared to a more degenerate primer set [39]. This highlights that primer optimization is equally crucial for full-length approaches.
Table 2: Comparison of Full-Length 16S rRNA Sequencing Platforms
| Parameter | PacBio SMRT Sequencing | Oxford Nanopore Technologies |
|---|---|---|
| Read Length | Up to 10,000+ bp | Average ~15 kbp |
| Accuracy | >99% (with HiFi reads) | <2% error rate (latest chemistry) |
| Throughput | Moderate to high | Variable depending on flow cell |
| Primary Advantage | High-fidelity long reads | Real-time sequencing; portable |
| Main Limitation | Higher cost per sample | Historically higher error rates |
| Ideal Application | High-resolution taxonomy | Field-based or rapid turnaround studies |
Comparative Performance Against Short-Amplicon Approaches
Empirical comparisons between full-length and short-amplicon sequencing demonstrate both consistency and important differences in microbial community characterization. Studies analyzing human microbiome samples (saliva, subgingival plaque, and feces) have found that both approaches generate similar overall community profiles, with samples clustering by niche rather than sequencing platform [38]. However, full-length sequencing assigns a higher proportion of reads to the species level (74.14% versus 55.23% for Illumina) while maintaining comparable assignment rates at genus level (95.06% versus 94.79%) [38].
The increased taxonomic resolution of full-length sequencing reveals biologically meaningful patterns that may be obscured in short-amplicon approaches. For instance, certain genera such as Streptococcus tend to be observed at higher relative abundances in PacBio data compared to Illumina (20.14% versus 14.12% in saliva) [38]. While these differences were not statistically significant after multiple testing correction in one study, they highlight how methodological approaches can influence quantitative estimates of abundance.
For drug development professionals, the enhanced resolution of full-length 16S sequencing offers particular promise for identifying microbial biomarkers at species or even strain level, which may be crucial for understanding drug-microbiome interactions or developing microbiome-based therapeutics. The ability to reliably resolve closely related species with different metabolic capabilities or host interactions could significantly advance precision medicine approaches targeting the microbiome.
Interplay with OTU and ASV Methodologies
Differential Impact on Clustering and Denoising Approaches
The choice between OTU clustering and ASV denoising intersects with primer and amplicon selection in determining the resolution and reproducibility of microbiome data. OTU clustering, typically at 97% similarity threshold, groups sequences based on pairwise identity, implicitly treating the resulting clusters as proxies for bacterial taxa [14]. In contrast, ASV methods (e.g., DADA2, debruijn) employ error correction to distinguish true biological variation from sequencing errors, producing exact sequence variants that can differ by as little as a single nucleotide [1].
The analytical implications of these approaches vary depending on whether short regions or full-length 16S sequences are analyzed. For short-amplicon data, ASV methods generally provide higher resolution and better reproducibility compared to OTU clustering [14]. However, the limited phylogenetic information in short regions can make it challenging to distinguish true biological variation from PCR or sequencing errors, potentially leading to either oversplitting or overmerging of taxa.
Full-length 16S sequencing significantly enhances the performance of both OTU and ASV approaches by providing substantially more phylogenetic information. The additional sequence data improves the accuracy of error models in ASV methods and enables more biologically meaningful OTU clustering. Notably, full-length sequences allow ASV methods to achieve true single-nucleotide resolution across the entire gene, potentially discriminating between strains with functional differences [38].
Comparative Effects on Diversity Measures
The choice between OTU and ASV methodologies has stronger effects on diversity measures than other analytical decisions, including rarefaction level and OTU identity threshold (97% vs. 99%) [14]. Studies comparing DADA2 (ASV-based) and Mothur (OTU-based) pipelines found significant differences in alpha and beta diversity estimates, particularly for presence/absence indices such as richness and unweighted UniFrac [14]. These discrepancies could be partially attenuated by rarefaction, but the pipeline effect remained the dominant factor.
The impact of OTU versus ASV choice varies across different microbial habitats and community characteristics. Bacterial communities with a few closely related dominant taxa may be more sensitive to the choice of sequence processing method than communities with greater phylogenetic diversity or abundance evenness [14]. This has important implications for experimental design, particularly in clinical settings where microbiome signatures may be subtle and confounded by high inter-individual variation.
For full-length 16S data, the analytical landscape is still evolving. While ASV approaches are generally preferred, the increased length presents computational challenges and requires specialized implementations of denoising algorithms. The DADA2 algorithm has been adapted for PacBio circular consensus sequencing data, demonstrating that this technology offers single-nucleotide resolution [38]. This combination of long-read sequencing with sophisticated denoising represents the current state-of-the-art for high-resolution microbial community profiling.
Table 3: Impact of OTU vs. ASV Methods on Diversity Metrics
| Diversity Measure | OTU-based Approach | ASV-based Approach | Relative Effect Size |
|---|---|---|---|
| Richness | Often overestimates due to clustering of errors | More accurate estimation through error correction | Large [14] |
| Unweighted UniFrac | Lower sensitivity to fine-scale phylogenetic differences | Higher sensitivity to fine-scale population structure | Large [14] |
| Weighted UniFrac | Moderate impact due to abundance weighting | More precise abundance estimates | Moderate [14] |
| Bray-Curtis Dissimilarity | Moderate differences in beta diversity | Improved resolution of community differences | Moderate [14] |
| Taxonomic Composition | Varies significantly across pipelines | More consistent classification | Large [14] |
Experimental Design and Best Practices
Comprehensive Workflow for 16S rRNA Gene Sequencing
The experimental workflow for 16S rRNA gene sequencing encompasses multiple critical steps, each requiring careful optimization to ensure data quality and biological accuracy. The following diagram illustrates the key decision points in a comprehensive 16S rRNA gene sequencing study:
Table 4: Essential Research Reagents and Resources for 16S rRNA Gene Sequencing
| Category | Specific Examples | Function/Application | Technical Considerations |
|---|---|---|---|
| Primer Sets | 27F (AGAGTTTGATCMTGGCTCAG), 341F (CCTACGGGNGGCWGCAG), 515F (GTGYCAGCMGCCGCGGTAA), 806R (GGACTACNVGGGTWTCTAAT), 1492R (CGGTTACCTTGTTACGACTT) | Amplification of target 16S rRNA regions | Degeneracy positions (M, V, N, W) increase coverage but may reduce efficiency [39] |
| DNA Extraction Kits | PowerSoil Pro Kit, Quick-DNA HMW MagBead Kit | Microbial DNA isolation from complex samples | Critical for lysis of difficult-to-break cells (e.g., Gram-positive bacteria) [38] |
| PCR Reagents | LongAMP Taq 2x Master Mix | Amplification of target regions | Especially important for full-length 16S amplification [39] |
| Sequencing Kits | Illumina MiSeq Reagent Kits, PacBio SMRTbell Express Templates, ONT 16S Barcoding Kit | Library preparation and sequencing | Platform-specific protocols must be followed precisely [38] |
| Reference Databases | GreenGenes, SILVA, RDP, LTP, GRD | Taxonomic classification of sequences | Database choice affects nomenclature and classification precision [37] |
| Bioinformatic Tools | Mothur, QIIME/QIIME2, DADA2, DORNA | Sequence processing, OTU/ASV generation, statistical analysis | Pipeline and parameter settings significantly impact results [37] |
Quality Control and Validation Strategies
Robust quality control measures are essential throughout the 16S rRNA sequencing workflow to ensure data integrity and biological validity. The inclusion of mock communities with known composition provides a critical validation standard for detecting technical biases and benchmarking performance [37]. These controls should mirror the complexity of the studied samples and contain taxa relevant to the research context.
Bioinformatic quality control should include careful trimming based on quality scores, removal of chimeric sequences, and filtering of host-associated or off-target sequences [41]. For coral microbiome research, which presents particular challenges due to host contamination, additional steps such as blocking primers or peptide nucleic acid clamps may be necessary to enrich for microbial sequences [41]. Similar host-associated challenges apply to other eukaryotic hosts.
The validation of primer performance for specific sample types represents a often-overlooked but critical step in experimental design. In silico evaluation using tools like mopo16S (Multi-Objective Primer Optimization for 16S experiments) can predict coverage and amplification efficiency across target taxa [42]. However, computational predictions require empirical validation through mock communities and cross-primer comparisons to identify potential biases that may not be apparent from sequence analysis alone.
Appropriate truncation parameters must be determined empirically for each study rather than relying on default settings [37]. Different truncated-length combinations should be tested to optimize quality filtering while minimizing the disproportionate loss of valid sequences from certain taxa. This optimization is particularly important for full-length 16S sequences, where quality may vary across the read length.
The selection of 16S rRNA gene regions and sequencing approaches represents a fundamental methodological decision with far-reaching implications for microbiome research. Short-amplicon sequencing of specific variable regions offers a cost-effective solution for large-scale studies where genus-level resolution is sufficient, while full-length 16S sequencing provides enhanced taxonomic resolution for studies requiring species- or strain-level discrimination. The choice between these approaches must be informed by research objectives, sample types, and analytical requirements.
The interplay between primer selection, sequencing technology, and bioinformatic processing (OTU versus ASV) creates a complex optimization landscape. Researchers must balance practical constraints against the need for accurate, reproducible, and biologically meaningful data. As the field continues to evolve toward higher-resolution methodologies, standardized protocols and comprehensive validation will become increasingly important for cross-study comparisons and meta-analyses.
For researchers, scientists, and drug development professionals, these technical considerations directly impact the ability to detect subtle microbiome signatures, identify microbial biomarkers, and develop targeted interventions. By carefully considering primer and amplicon strategies within the broader context of OTU and ASV research, investigators can maximize the biological insights gained from microbiome studies while maintaining methodological rigor and reproducibility.
High-throughput sequencing technologies have revolutionized microbial ecology, enabling unprecedented resolution in the characterization of complex communities. The analysis of marker genes, particularly the 16S rRNA gene, relies heavily on two fundamental data analysis frameworks: Operational Taxonomic Units (OTUs) and Amplicon Sequence Variants (ASVs). The choice between these frameworks is intrinsically linked to the sequencing technology employed—Illumina, Pacific Biosciences (PacBio), or Oxford Nanopore Technologies (ONT). Each platform offers distinct advantages in read length, accuracy, and throughput that directly influence the optimal bioinformatic approach for deriving biological insights. This technical guide examines the compatibility between these sequencing platforms and analysis methods, providing a structured framework for researchers to align their experimental design with analytical goals in drug development and basic research.
Technology Fundamentals
Illumina sequencing utilizes sequencing-by-synthesis (SBS) chemistry to generate high volumes of short reads, typically targeting hypervariable regions (e.g., V3-V4) of the 16S rRNA gene [35]. This approach provides high throughput but shorter read lengths (typically 100-400 bp) that can lead to ambiguous taxonomic assignments at the species level [43].
PacBio employs Single Molecule, Real-Time (SMRT) sequencing through its Circular Consensus Sequencing (CCS) protocol, which generates HiFi (High Fidelity) reads. These are long reads (typically 15-20 kb) that achieve exceptional accuracy (>99.9%) through multiple passes of the same DNA molecule [35] [44]. This technology enables full-length 16S rRNA gene sequencing, providing superior taxonomic resolution.
Oxford Nanopore sequencing passes single strands of DNA or RNA through protein nanopores embedded in a membrane. Changes in electrical current are used to determine the DNA sequence in real time [44]. Like PacBio, ONT enables full-length 16S rRNA gene sequencing, with read lengths that can exceed hundreds of thousands of bases. However, its raw read accuracy is generally lower than both Illumina and PacBio, though recent improvements with new chemistries and flow cells (R10.4.1) have increased base accuracy to over 99% [43].
Quantitative Performance Metrics
Table 1: Technical specifications and performance comparison of sequencing platforms for 16S rRNA gene amplicon sequencing.
| Parameter | Illumina MiSeq | PacBio Sequel II/IIe | ONT MinION |
|---|---|---|---|
| Read Length | 442 ± 5 bp (V3-V4) [35] | 1,453 ± 25 bp (Full-length) [35] | 1,412 ± 69 bp (Full-length) [35] |
| Typical Output per Run | ~0.12 Gb [35] | ~0.55 Gb [35] | ~0.89 Gb [35] |
| Read Accuracy | Q30 (99.9%) [44] | Q27-Q30 (99.9%) for HiFi [35] [44] | ~Q20 (99%) with improvements to Q28 (~99.84%) [43] |
| Species-Level Resolution | 47% [35] | 63% [35] | 76% [35] |
| Key Advantage | High throughput, low cost per sample | High accuracy long reads | Ultra-long reads, portability, real-time data |
| Key Disadvantage | Limited to partial gene regions | Higher instrument cost, moderate throughput | Higher raw error rate, large file sizes |
Methodological Protocols for Cross-Platform Analysis
Experimental Workflow for Full-Length 16S Sequencing
The following diagram illustrates the generalized experimental workflow for full-length 16S rRNA gene sequencing common to both PacBio and ONT platforms.
Experimental Workflow for Full-Length 16S Sequencing
Sample Collection and DNA Extraction
For consistent cross-platform comparisons, DNA should be extracted from the same source material using standardized kits. Studies have successfully used the DNeasy PowerSoil kit (QIAGEN) for fecal samples and the Quick-DNA Fecal/Soil Microbe Microprep kit (Zymo Research) for soil samples [35] [43]. Isolated DNA must be quantified using fluorometric methods and quality assessed via electrophoresis to ensure integrity.
PCR Amplification
- PacBio Protocol: Amplify the full-length 16S rRNA gene using universal primers 27F and 1492R, tailed with PacBio barcode sequences. Perform PCR amplification with KAPA HiFi Hot Start DNA Polymerase over 27-30 cycles [35] [43].
- ONT Protocol: Amplify using the same primer pair (27F and 1492R) with the 16S Barcoding Kit (SQK-RAB204/SQK-16S024). Perform PCR amplification using 40 cycles to ensure sufficient yield for Nanopore sequencing [35].
Library Preparation and Sequencing
- PacBio: Pool barcoded amplicons in equimolar concentrations and prepare library with the SMRTbell Express Template Prep Kit. Sequence on Sequel II system using Sequencing Kit 2.0 with a 10-hour movie time [35] [43].
- ONT: Purify PCR products, quantify, and pool equimolarly. Sequence on MinION device using FLO-MIN106 flow cells with real-time basecalling enabled [35].
Bioinformatic Analysis Pipelines
The selection of OTU vs. ASV analysis is critically dependent on the sequencing platform and data quality, as illustrated in the following decision workflow.
Bioinformatic Analysis Decision Workflow
ASV Analysis with DADA2
For high-accuracy data (Illumina and PacBio HiFi), the DADA2 pipeline implements a divisive amplicon denoising algorithm to infer biological sequences and correct sequencing errors [35] [20]. The process includes:
- Quality Filtering: Trim reads based on quality scores and expected errors.
- Error Rate Learning: Calculate an error model from the sequencing data.
- Dereplication: Combine identical sequences.
- Sample Inference: Apply the core DADA algorithm to partition reads into ASVs.
- Sequence Variant Resolution: Distinguish biological sequences differing by as little as a single nucleotide.
For PacBio HiFi data, the circular consensus sequencing generates high-fidelity reads that are particularly amenable to DADA2's error correction, enabling ASV inference from full-length 16S sequences [35].
OTU Clustering for Nanopore Data
Due to the higher error rate and lack of internal redundancy in ONT reads, denoising with DADA2 is often not feasible. Instead, ONT sequences are typically processed using specialized pipelines like Spaghetti, which employs an OTU-based clustering approach [35]. This method involves:
- Quality Control: Filter reads based on length and quality.
- Clustering: Group sequences at a defined similarity threshold (e.g., 97% or 99%).
- Chimera Removal: Identify and remove artificial chimeric sequences.
- Representative Sequence Selection: Choose the most abundant sequence within each cluster as the OTU representative.
The Scientist's Toolkit: Essential Research Reagents
Table 2: Key reagents and computational tools for cross-platform 16S rRNA gene sequencing studies.
| Category | Product/Software | Specific Application | Function |
|---|---|---|---|
| DNA Extraction | DNeasy PowerSoil Kit (QIAGEN) [35] | Environmental/Fecal Samples | Inhibitor removal and high-yield DNA extraction |
| PCR Amplification | KAPA HiFi HotStart ReadyMix [35] | PacBio Library Prep | High-fidelity amplification of full-length 16S |
| 16S Barcoding Kit (SQK-RAB204) [35] | ONT Library Prep | Multiplexed amplification and barcoding | |
| Library Preparation | SMRTbell Express Template Prep Kit 2.0 [35] | PacBio Sequencing | Construction of SMRTbell libraries |
| Native Barcoding Kit 96 (SQK-NBD109) [43] | ONT Multiplexing | Sample multiplexing for Nanopore runs | |
| Bioinformatic Tools | DADA2 [35] [16] | ASV Inference from Illumina/PacBio | Error correction and exact sequence variant calling |
| Spaghetti [35] | ONT Data Processing | OTU-based clustering for Nanopore 16S data | |
| QIIME2 [35] | Downstream Analysis | Taxonomic assignment and diversity analysis | |
| Reference Databases | SILVA [35] | Taxonomic Classification | Curated database of ribosomal RNA sequences |
| Custom V3-V4 Database [45] | Species-Level ID | Enhanced database for short-read species classification |
Comparative Analysis of Platform-Generated Data
Taxonomic Resolution Across Platforms
A direct comparison of Illumina (V3-V4), PacBio (full-length), and ONT (full-length) sequencing of rabbit gut microbiota revealed significant differences in taxonomic resolution [35]:
- All three platforms achieved similar resolution up to the family level (≥99% classified)
- At the genus level, ONT performed best (91%), followed by PacBio (85%) and Illumina (80%)
- At the species level, ONT classified 76% of sequences, PacBio 63%, and Illumina 47%
Despite these improvements with long-read technologies, a significant limitation remains: at the species level, most classified sequences were labeled as "Uncultured_bacterium" across all platforms, indicating persistent gaps in reference databases rather than technological limitations [35].
Diversity Metrics and Community Composition
Comparative studies of soil microbiomes across platforms demonstrate that despite technological differences, microbial community analysis ensures clear clustering of samples based on soil type for all technologies except the V4 region alone [43]. Beta diversity analysis (PCoA based on Bray-Curtis dissimilarity) shows significant differences between the taxonomic compositions derived from the three platforms, highlighting the significant impact of sequencing platform choice, especially when different primers are used [35].
Discussion: OTUs vs. ASVs in Contemporary Research
Conceptual and Practical Distinctions
The fundamental distinction between OTUs and ASVs lies in their definition: OTUs are clusters of sequences defined by an arbitrary similarity threshold (typically 97%), while ASVs are exact biological sequences inferred through statistical error modeling [20] [19]. This distinction has profound implications for data analysis:
ASVs provide consistent labels with intrinsic biological meaning that can be reproduced across studies, enabling direct comparison between independently processed data sets [19]. The higher resolution of ASVs (single-nucleotide differences) better discriminates ecological patterns and improves detection of rare variants [16] [20].
OTUs remain practical for analyzing long-read data with higher error rates (e.g., ONT) and for applications where computational efficiency is prioritized over maximum resolution [35] [20]. The clustering process can help mitigate the impact of persistent sequencing errors.
Recommendations for Platform-Selection Alignment
Based on empirical comparisons, the following alignments between sequencing platforms and analysis methods are recommended:
Illumina (Short-Read): Employ ASV analysis (DADA2) for maximal resolution of short hypervariable regions. This approach leverages Illumina's high base quality while overcoming the limitation of partial gene sequencing [35] [45].
PacBio HiFi (Long-Read): Utilize ASV analysis (DADA2) to exploit the combination of long reads and high accuracy. This provides the highest possible taxonomic resolution from full-length 16S rRNA gene sequences [35].
Oxford Nanopore (Long-Read): Apply OTU clustering (Spaghetti or similar) with a 98.5%-99% similarity threshold. This approach accommodates ONT's higher error rate while still leveraging the advantages of full-length sequencing [35] [20].
For cross-platform studies or meta-analyses, converting all data to a consistent analytical framework (either ASV or OTU) is essential, though challenging. When combining data from different technologies, particularly when different primer sets are used, special consideration must be given to batch effects and technical artifacts [35].
The compatibility between sequencing platforms and analytical frameworks represents a critical consideration in experimental design for microbial ecology and related fields. Illumina, PacBio, and Oxford Nanopore each offer distinct technical profiles that directly influence the optimal bioinformatic approach for 16S rRNA gene analysis. While long-read technologies (PacBio and ONT) provide improved species-level resolution compared to Illumina, all platforms remain limited by reference database completeness. The choice between ASV and OTU methodologies should be guided by both the sequencing technology employed and the specific research objectives, with ASVs generally preferred for their higher resolution and reproducibility when data quality permits. As sequencing technologies continue to evolve, with improvements in both accuracy and throughput, the integration of full-length 16S sequencing with sophisticated analytical pipelines promises to further enhance our understanding of complex microbial communities in human health, disease, and environmental applications.
The analysis of high-throughput marker-gene sequencing data, a cornerstone of modern microbial ecology, relies on bioinformatics pipelines to infer biological sequences from raw reads. For years, the standard approach involved clustering sequences into Operational Taxonomic Units (OTUs). More recently, methods that resolve Amplicon Sequence Variants (ASVs) have gained prominence [31] [46]. The choice between these methods has significant implications for the computational resources required, a critical consideration for project planning and infrastructure allocation. This guide provides an in-depth assessment of the cost, time, and hardware requirements associated with OTU and ASV analysis, framed within a technical evaluation of their methodologies.
While both approaches aim to reduce complex sequence data into meaningful biological units, their underlying algorithms dictate distinct computational profiles. OTU clustering, particularly de novo methods, often requires computationally expensive pairwise sequence comparisons. In contrast, ASV methods, which use a model-based approach to distinguish biological sequences from errors, offer different scalability characteristics [31] [46]. Understanding these differences is essential for researchers, scientists, and drug development professionals to optimize their workflows for efficiency, cost, and accuracy.
Core Methodologies and Computational Philosophies
Operational Taxonomic Units (OTUs)
OTUs are clusters of sequencing reads that differ by less than a fixed dissimilarity threshold, typically 97% [31] [47]. The process of generating OTUs involves grouping sequences based on their similarity, which can be achieved through several methods:
- De Novo Clustering: This reference-free method clusters sequences within a dataset based on pairwise similarities. It is the most computationally complex approach because it requires calculating distances between all sequences in the dataset. The number of potential sequence comparisons scales quadratically with the total sequencing effort, making it prohibitively costly for very large studies [31] [46].
- Closed-Reference Clustering: This method compares sequencing reads to a pre-existing reference database. Reads that are sufficiently similar to a reference sequence are recruited into the corresponding OTU. This approach is computationally efficient and allows for easy merging of independently processed datasets. However, it discards sequences not represented in the reference database, potentially biasing results [31] [46].
- Open-Reference Clustering: A hybrid approach that first uses closed-reference clustering and then clusters the remaining, unassigned reads de novo. This method seeks to balance computational efficiency with the retention of novel diversity [46].
Amplicon Sequence Variants (ASVs)
ASVs are inferred by distinguishing biological sequences from amplification and sequencing errors using a model-based, or "denoising," process [31] [48]. Tools like DADA2, Deblur, and UNOISE3 use statistical models to identify exact biological sequences, resolving variants that differ by as little as a single nucleotide [48]. Unlike OTU clustering, which can be performed on individual reads, ASV inference requires sample-level data to build an error model and distinguish rare biological sequences from errors [31]. A key advantage is that ASVs act as consistent labels with intrinsic biological meaning, allowing them to be directly compared across studies without re-processing [31] [46].
The following diagram illustrates the fundamental logical differences in how OTU and ASV processing workflows handle sequence data.
Quantitative Resource Comparison
The methodological differences between OTU and ASV pipelines translate directly into divergent demands on computational resources. The following table summarizes the key performance indicators based on benchmarking studies and methodological reviews.
Table 1: Computational Resource Comparison of OTU vs. ASV Pipelines
| Resource Factor | OTU Pipelines (e.g., MOTHUR, UPARSE) | ASV Pipelines (e.g., DADA2, Deblur) |
|---|---|---|
| Computational Scaling | Quadratic scaling with total sequencing effort for de novo methods due to all-vs-all sequence comparisons [31]. | Linear scaling with sample number; each sample can be processed independently, enabling trivial parallelization [31]. |
| Memory Requirements | Can be high for de novo methods as large distance matrices for the entire dataset must be held in memory [31]. | Remains flat with increasing sample number; memory is primarily a function of per-sample sequencing depth [31]. |
| Processing Time | Can become prohibitively long for large datasets (millions of reads) due to quadratic scaling [31]. UPARSE is a leader among OTU algorithms in benchmarked run-time [48]. | Generally more efficient for large studies due to linear scaling and parallelization [16] [31]. DADA2 has demonstrated high efficiency in comparative studies [16]. |
| Data Reduction Efficiency | MOTHUR can generate large proportions of rare OTUs that complicate phylogenies and are inference-wise redundant [16]. | DADA2 achieves a strong reduction (>80%) of representative sequences while retaining phylogenetic signal [16]. |
| Output Reusability | De novo OTUs are emergent properties of a specific dataset and cannot be validly compared between studies without reprocessing [31]. | ASVs are consistent, reproducible labels that can be merged across independently processed studies, facilitating meta-analysis [31]. |
Experimental Protocols and Benchmarking Data
Performance conclusions are drawn from rigorous benchmarking studies. A typical experimental protocol for such comparisons involves:
- Dataset Selection: Using mock microbial communities with known composition (ground truth), such as the HC227 community (227 bacterial strains across 197 species) [48] [34]. This allows for objective measurement of error rates, over-splitting, and over-merging.
- Unified Preprocessing: Applying identical quality filtering, merging, and trimming steps to all datasets to isolate the effect of the clustering/denoising algorithm [48]. For example, reads may be subsampled to a standard depth (e.g., 30,000 reads per sample) to ensure a consistent level of technical artifacts [48].
- Parallel Processing: Running the same preprocessed data through multiple OTU (e.g., MOTHUR, UPARSE) and ASV (e.g., DADA2, Deblur) pipelines [48] [21].
- Performance Metrics: Quantifying results based on:
- Resemblance to Ground Truth: How well the output matches the expected composition of the mock community [48].
- Error Rate: The number of spurious sequences generated.
- Over-splitting/Over-merging: Whether a true biological variant is incorrectly split into multiple units or merged with another variant [48].
- Computational Runtime and Memory Usage: Measured on standardized hardware [48].
A 2022 study using natural freshwater communities found that the choice between DADA2 (ASV) and MOTHUR (OTU) had a stronger effect on measured alpha and beta diversity than other methodological choices like rarefaction or OTU identity threshold [21]. Furthermore, a 2025 benchmarking analysis noted that while ASV algorithms like DADA2 produced consistent outputs, they were prone to over-splitting, whereas OTU algorithms like UPARSE achieved clusters with lower errors but with more over-merging [48].
The Scientist's Toolkit: Essential Research Reagents and Materials
The following table details key bioinformatic tools and resources essential for conducting OTU and ASV analyses.
Table 2: Key Research Reagent Solutions for Amplicon Analysis
| Tool/Resource | Type | Primary Function | Relevance to OTU/ASV |
|---|---|---|---|
| MOTHUR [16] [21] | Software Pipeline | A comprehensive, open-source software package for processing sequencing data. | Implements multiple algorithms for generating OTUs via distance-based clustering. |
| DADA2 [16] [48] [21] | R Package | A modeling-based algorithm for inferring ASVs from amplicon data. | A leading denoising tool that replaces OTU clustering in many modern workflows. |
| UPARSE [48] | Algorithm / Pipeline | Implements a greedy clustering algorithm for OTU construction. | Notable for achieving OTU clusters with low errors and being a performance leader in benchmarks. |
| USEARCH/VSEARCH [48] | Software Tool | A versatile tool for sequence analysis, including merging, filtering, and clustering. | Used for preprocessing and can perform OTU clustering (e.g., Distance-based Greedy Clustering). |
| SILVA Database [48] | Reference Database | A curated database of aligned ribosomal RNA (rRNA) gene sequences. | Used for alignment, taxonomic assignment, and closed-reference OTU picking. |
| Mock Community (e.g., HC227) [48] [34] | Benchmarking Standard | A validated mixture of genomic DNA from known microbial strains. | Provides a gold-standard "ground truth" for evaluating the accuracy and performance of OTU/ASV pipelines. |
| GeneLab AWG Pipeline [36] | Processing Workflow | NASA GeneLab's consensus processing pipeline for amplicon data. | An example of a standardized, publicly available workflow that can be adopted or used for comparison. |
Workflow Decision Framework
The choice between an OTU or ASV pipeline is not purely about computational efficiency; it also involves the research question, sample type, and desired output. The following workflow diagram outlines a decision framework that incorporates these factors alongside resource considerations.
The shift from OTUs to ASVs represents more than just an increase in resolution; it is a shift towards more computationally efficient, reproducible, and data-rich analysis in microbial ecology. ASV methods, led by tools like DADA2, offer linear scalability and stable features that simplify large-scale and meta-analyses [16] [31]. While OTU methods, particularly closed-reference approaches, retain value in specific, well-defined contexts, the future of marker-gene analysis is moving toward denoising. Researchers must weigh these computational characteristics—how algorithms scale with data size, their memory footprints, and the long-term reusability of their outputs—when designing studies and allocating resources. Making an informed choice ensures that limited computational resources are invested in a method that maximizes biological insight and data longevity.
The field of microbial ecology has been revolutionized by the advent of high-throughput sequencing technologies, enabling unprecedented resolution in profiling complex microbial communities. Understanding the dynamics of host-associated communities, particularly the human microbiome, requires sophisticated bioinformatic approaches for classifying sequencing data into biologically meaningful units. The evolution from Operational Taxonomic Units (OTUs) to Amplicon Sequence Variants (ASVs) represents a fundamental methodological shift with profound implications for biomedical research and therapeutic development [1] [49]. This technical guide examines the core principles, comparative advantages, and practical applications of these approaches within the context of human microbiome studies, providing researchers with frameworks for selecting appropriate methodologies based on specific research objectives.
The analysis of targeted 16S rRNA gene sequencing data presents unique computational challenges distinct from whole-genome approaches. Unlike alignment-based methods used in whole-genome sequencing, where minor single-nucleotide variants (SNVs) from sequencer error rarely confound analysis, targeted sequencing relies on comparing similar sequences where erroneous SNVs can lead to misattribution of sequences and false discovery of novel organisms [49]. This technical challenge has driven the development of two principal strategies for analyzing amplicon sequence data, each with distinct computational frameworks and biological interpretations.
Core Concepts: OTUs and ASVs
Operational Taxonomic Units (OTUs)
OTUs represent a clustering-based approach to managing amplicon sequence data. This method groups sequences based on similarity thresholds, traditionally set at 97% identity, to approximate species-level classification [1] [21]. This approach reduces dataset complexity and mitigates sequencing errors by grouping similar sequences together. Three primary methods exist for OTU generation:
- Reference-free (de novo) clustering: Forms clusters entirely from observed sequences without external references, computationally intensive but avoids reference database biases [49].
- Closed-reference clustering: Compares sequences against a predefined reference database, computationally efficient but limited to known taxa [49].
- Open-reference clustering: Hybrid approach that first clusters against a reference database, then performs de novo clustering on remaining sequences [49].
Amplicon Sequence Variants (ASVs)
ASVs represent a denoising-based approach that identifies biological sequences through error correction rather than clustering. Using algorithms like DADA2, this method employs statistical error models to distinguish true biological variation from sequencing artifacts, resulting in single-nucleotide resolution without arbitrary similarity thresholds [1] [21]. ASVs offer exact sequence variants that are reproducible across studies, facilitating direct comparison between datasets and more precise taxonomic classification, potentially to the species level or beyond [49].
Table 1: Fundamental Differences Between OTUs and ASVs
| Feature | OTUs | ASVs |
|---|---|---|
| Resolution | Clusters sequences at 97% similarity | Single-nucleotide precision |
| Error Handling | Errors absorbed in clustering | Algorithmic denoising and correction |
| Reproducibility | Varies between studies | Exact sequence variants, reproducible |
| Computational Demand | Less computationally demanding | Higher due to denoising complexity |
| Taxonomic Precision | May group closely related species | Can distinguish fine variations |
Methodological Comparison and Selection Criteria
Comparative Analysis of Performance Characteristics
Research directly comparing OTU and ASV approaches reveals significant methodological impacts on research outcomes. A 2022 study analyzing freshwater invertebrate gut and environmental communities found that the choice between DADA2 (ASV-based) and Mothur (OTU-based) pipelines significantly influenced alpha and beta diversity measurements, more so than rarefaction or OTU identity threshold selections [21]. The discrepancy was particularly pronounced for presence/absence indices such as richness and unweighted Unifrac, though rarefaction could partially attenuate these differences [21].
The detection of low-abundance taxa presents a critical trade-off: OTU approaches demonstrate higher sensitivity for rare sequences but with increased risk of spurious OTU detection, while DADA2 has shown superior specificity in distinguishing true biological signals from contamination [49]. Chimera detection also differs substantially between approaches; ASVs, being exact sequences, enable straightforward identification of chimeric sequences as precise recombinants of more prevalent parent sequences within the same sample [49].
Selection Guidelines for Research Applications
The optimal choice between OTU and ASV approaches depends on specific research goals, sample types, and computational resources:
OTU-based approaches remain preferable for: Legacy dataset comparisons, broad ecological trends rather than strain-level differences, and studies with limited computational resources [1].
ASV-based approaches excel when: High-resolution discrimination of closely related taxa is required, reproducibility across studies is prioritized, and analyzing environments with potentially novel species not well-represented in reference databases [1] [49].
Table 2: Application-Based Selection Guidelines
| Research Scenario | Recommended Approach | Rationale |
|---|---|---|
| Large cohort human gut studies | Closed-reference OTUs or ASVs | Well-defined expected taxa with extensive reference data |
| Novel environment exploration | ASVs or de novo OTUs | Avoids reference database biases for undocumented taxa |
| Longitudinal strain tracking | ASVs | Single-nucleotide resolution enables precise tracking |
| Comparative analysis with historical data | OTUs | Maintains methodological consistency |
| Low-biomass or contaminated samples | ASVs | Superior contamination identification |
Advancements in Species-Level Identification
Limitations of Fixed Threshold Approaches
Traditional 16S rRNA gene analysis has relied on fixed similarity thresholds for taxonomic classification, typically 97% for genus-level and 98.5-99% for species-level assignment [45] [50]. This approach suffers from significant limitations as 16S rRNA gene sequence divergence varies substantially across bacterial lineages. Problematic scenarios include:
- Different genera (Escherichia and Shigella) sharing identical 16S rRNA sequences [45] [50]
- Intraspecies variation sometimes exceeding 3% similarity thresholds [45] [50]
- Variable evolutionary rates across bacterial lineages [51]
These limitations are particularly consequential in clinical applications where differentiating between pathogenic and commensal species within the same genus is essential for accurate diagnosis and treatment [45].
The ASVtax Pipeline for Enhanced Resolution
Recent research has addressed these limitations through the development of specialized databases and analytical pipelines. A March 2025 study created a gut-specific V3-V4 region 16S rRNA database integrating SILVA, NCBI, and LPSN databases, supplemented with 1,082 human gut samples [45] [50]. This resource enabled the establishment of flexible, species-specific classification thresholds ranging from 80-100% for 896 common human gut species, moving beyond the constraints of fixed thresholds [45] [50].
The resulting ASVtax pipeline combines k-mer feature extraction, phylogenetic tree topology analysis, and probabilistic models to achieve precise ASV annotation, reportedly identifying 23 new genera within the clinically important Lachnospiraceae family [45] [50]. This approach demonstrates how specialized databases coupled with flexible classification thresholds can enhance species-level identification from the V3-V4 regions typically limited to genus-level classification [45] [50].
Experimental Protocols for Microbiome Analysis
Sample Collection and Preservation Methods
Proper sample collection and preservation represents a critical first step in microbiome research, with protocols tailored to specific body sites:
- Gut microbiome: Stool samples collected in sterile containers with immediate freezing at -80°C or use of stabilization buffers. Freezing preserves viability for culture-based assays, while fixatives enable convenient shipping but kill microorganisms [52].
- Skin microbiome: Swabbing, razor scraping, or biopsies. Swabbing retrieves minimal biomass but is least invasive, while biopsies yield greater biomass but require careful processing to address high human nucleotide fractions (up to 90% of sample) [52].
- Respiratory tract: Swabs, aspirates, sputum, lavage, or brushings from upper and lower regions. Bronchoalveolar lavage volumes vary by disease state, requiring dilution consideration in analyses [52].
All protocols must incorporate controls for contamination and monitor batch effects—technical artifacts introduced during sample processing that can obscure biological signals [52].
Bioinformatics Workflow for ASV Analysis
A standardized pipeline for ASV-based analysis includes the following stages:
Sequence Preprocessing: Quality filtering based on Phred scores, read trimming, and pair-end read merging.
Denoising Algorithm Application: Implementation of error models (e.g., DADA2) to correct sequencing errors and distinguish true biological variation. This core step identifies exact sequence variants while removing technical artifacts [1].
Chimera Removal: Identification and removal of artificial chimeric sequences formed during PCR amplification through alignment-based detection methods.
Taxonomic Classification: Assignment of taxonomy using reference databases (SILVA, Greengenes, RDP) with appropriate classification thresholds.
Statistical Analysis: Ecological analyses including alpha diversity (within-sample), beta diversity (between-sample), and differential abundance testing with appropriate multiple testing corrections.
Implications for Pharmaceutical Development
Pharmacomicrobiomics: Microbiota-Drug Interactions
The emerging field of pharmacomicrobiomics explores how microbial communities influence drug metabolism and efficacy, representing a crucial consideration for pharmaceutical development. Gut microbiota functions as a "metabolic organ" containing over 5 million genes—substantially exceeding the human gene count—enabling diverse metabolic transformations that directly impact therapeutic outcomes [53].
Notable examples of microbiota-drug interactions include:
- Digoxin: Reduction by Eggerthella lenta reduces cardiac drug bioavailability, potentially countered by arginine supplementation [54].
- CPT-11 (chemotherapy): Reactivation by bacterial β-glucuronidases increases intestinal toxicity, reversible through enzyme inhibition [54].
- TMAO production: Microbial conversion of dietary compounds to TMAO promotes atherosclerosis, inhibitable through microbial enzyme targeting [54].
These interactions demonstrate how interindividual microbiome variation contributes substantially to drug response variability, a factor potentially exceeding genetic influences for certain therapeutics [53].
Microbiome-Targeted Therapeutic Strategies
Current approaches to leveraging microbiome-drug interactions include both additive and subtractive strategies:
- Additive approaches: Introduction of engineered microbial strains producing therapeutic payloads, consortia of beneficial organisms, or microbiota-directed nutritional interventions [54].
- Subtractive approaches: Selective antimicrobials, bacteriophages, or enzyme inhibitors targeting specific microbial taxa or functions detrimental to therapeutic efficacy [54].
Critical challenges include designing therapies adapted to specific anatomical niches, ensuring stable colonization, developing clinically relevant biosensors, maintaining synthetic gene circuit robustness, and addressing safety concerns [54].
Table 3: Research Reagent Solutions for Microbiome Studies
| Reagent/Tool | Function | Application Notes |
|---|---|---|
| Stabilization Buffers | Preserve microbial community structure during storage/transport | Critical for field studies; some inhibit culturability |
| ZymoBIOMICS Standards | Mock microbial communities for quality control | Essential for validating wet-lab and computational methods |
| DADA2 Algorithm | Denoising pipeline for ASV generation | Implements error correction models for Illumina data |
| SILVA Database | Curated 16S rRNA reference database | Regularly updated with quality-checked sequences |
| Custom ASVtax Pipeline | Species-level classification with flexible thresholds | Optimized for human gut V3-V4 data |
Reporting Standards and Methodological Considerations
STORMS Checklist Implementation
The STORMS (Strengthening The Organization and Reporting of Microbiome Studies) checklist provides a comprehensive 17-item framework for reporting human microbiome research [55]. Developed through multidisciplinary consensus, this guideline addresses study design, sampling, laboratory processing, bioinformatics, statistics, and data interpretation specific to microbiome research [55].
Essential reporting elements include:
- Detailed documentation of sample collection, storage, and DNA extraction methods
- Specification of 16S rRNA gene regions targeted and primer sequences
- Clear description of bioinformatic pipelines and parameters
- Statistical approaches addressing compositionality and multiple testing
- Transparent reporting of batch effect correction methods
Implementation of standardized reporting guidelines enhances reproducibility, facilitates meta-analyses, and enables more accurate comparison across studies—particularly important when reconciling OTU and ASV-based datasets [55].
Technical Considerations and Limitations
Despite methodological advances, important technical constraints remain:
- Intragenomic variation: Bacterial genomes often contain multiple 16S rRNA copies with sequence variation, potentially splitting single genomes into multiple ASVs. One analysis found an average of 0.58 ASVs per 16S rRNA gene copy, requiring thresholds up to 5.25% to cluster operons from the same genome [51].
- Database limitations: Reference databases suffer from inconsistent nomenclature, uneven taxonomic coverage, and limited representation of uncultivated taxa, particularly impacting novel environment studies [45].
- Methodological biases: The choice between OTU and ASV approaches significantly influences diversity metrics, sometimes more strongly than biological variables of interest [21].
These limitations highlight the importance of methodological transparency, appropriate threshold selection, and cautious biological interpretation when analyzing microbial community data.
The evolution from OTU to ASV methodologies represents significant progress in microbial bioinformatics, offering enhanced resolution and reproducibility for studying host-associated communities. The emerging paradigm recognizes that no universal solution exists—method selection must align with specific research questions, sample types, and analytical resources. Future directions point toward increasingly refined taxonomic classification through specialized databases and flexible thresholds, integration of multi-omics data, and standardized reporting frameworks. These advances will strengthen investigations into microbiome-disease associations, host-microbe interactions, and microbiome-targeted therapeutic interventions, ultimately enhancing both fundamental knowledge and clinical applications in biomedical research.
Optimizing Your Analysis: Overcoming Common Pitfalls and Biases
Managing Sequencing Errors, Chimeras, and Contamination
In amplicon sequencing-based microbiome research, the accurate interpretation of microbial community data is fundamentally challenged by technical artifacts. Sequencing errors, chimeras, and contamination introduce significant noise that can obscure true biological signals and lead to erroneous conclusions [56] [33]. Effectively managing these artifacts is particularly critical when differentiating between Operational Taxonomic Units (OTUs) and Amplicon Sequence Variants (ASVs), as each approach interacts differently with these technical challenges [14] [57]. This guide provides a comprehensive technical framework for identifying, quantifying, and mitigating these pervasive issues within the context of OTU and ASV research, enabling researchers to produce more reliable and reproducible microbial community data.
Sequencing Errors: Profiles and Correction Methods
Sequencing errors are platform-dependent and can significantly impact downstream diversity analyses. Illumina platforms, which dominate amplicon sequencing, primarily exhibit nucleotide substitutions rather than indel errors [33]. These errors are not random; they often stem from sequence-specific interference with the base elongation process during sequencing-by-synthesis [56]. Two major sequence patterns trigger these sequence-specific errors (SSE): (1) inverted repeats, which can cause single-stranded DNA folding, and (2) GGC sequences, which may alter enzyme preference during sequencing [56]. These patterns favor "dephasing" by inhibiting single-base elongation, leading to consecutive miscalls that begin at specific sequence positions [56].
The impact of these errors is particularly pronounced in population-targeted methods like RNA-seq and ChIP-seq, causing coverage variability and unfavorable bias [56]. Furthermore, they represent a potential source of false single-nucleotide polymorphism (SNP) calls and significantly hinder de novo assembly efforts [56]. The error profile is consistent across various organisms and sample preparation methods, having been observed in all examined Illumina sequencing data, including public datasets from the Short Read Archive [56].
Error Management Strategies
Bioinformatic Correction: Denoising algorithms form the cornerstone of modern error management. Tools like DADA2, Deblur, and UNOISE3 employ sophisticated statistical models to distinguish true biological sequences from errors [58] [57] [33]. DADA2 implements a parametric error model that learns from the data itself, using quality scores and read abundances to infer the true template sequences [59] [57]. Deblur applies a fixed distribution model for efficient processing of short-read sequences, while UNOISE3 uses an abundance-based probabilistic model to differentiate true variants from errors [59] [33].
Experimental Considerations: Wet-lab procedures significantly influence error rates. Utilizing high-fidelity polymerases during amplification, optimizing PCR cycle numbers to reduce amplification artifacts, and employing unique molecular identifiers (UMIs) to track individual molecules through sequencing all contribute to error reduction [57]. The selection of sequencing platform also matters, as different technologies exhibit distinct error profiles that must be considered when designing experiments [56] [60].
Table 1: Performance Comparison of Error-Correction Methods Using Mock Communities
| Method | Type | Error Rate | Over-splitting | Over-merging | Computational Demand |
|---|---|---|---|---|---|
| DADA2 | ASV (Denoising) | Low | Moderate | Low | High |
| Deblur | ASV (Denoising) | Low | Moderate | Low | Moderate |
| UNOISE3 | ASV (Denoising) | Low | Moderate | Low | Moderate |
| UPARSE | OTU (Clustering) | Moderate | Low | Moderate | Low |
| Mothur-Opticlust | OTU (Clustering) | Moderate | Low | Moderate | Low |
| Mothur-AN | OTU (Clustering) | Moderate-High | Low | High | Moderate |
Data derived from benchmarking studies using complex mock communities [33].
Chimeras: Formation and Detection
Mechanisms of Chimera Formation
Chimeras are artificial sequences created when incomplete extension products from one template act as primers for different templates during PCR amplification [57] [33]. This results in hybrid sequences that combine regions from two or more biological templates, generating false diversity that can be misinterpreted as novel taxa [57]. The prevalence of chimeras increases with PCR cycle numbers and is influenced by template concentration, community complexity, and amplification conditions [33].
Chimera Detection and Removal
ASV-Based Detection: The exact sequence nature of ASVs enables highly specific chimera detection. Chimeric ASVs typically appear as exact sequences that are combinations of two more prevalent "parent" ASVs from the same sample [57]. DADA2 employs a reference-free method that compares each sequence to more abundant alternatives, flagging those that can be reconstructed by combining left and right segments of more prevalent sequences [57].
OTU-Based Detection: Chimera detection in OTU pipelines often relies on reference-based methods using databases like SILVA or Greengenes [33]. While effective for known sequences, this approach may miss novel chimeras formed from parent sequences not represented in reference databases [57]. Tools like UCHIME and VSEARCH implement both reference-based and de novo chimera detection methods, with varying performance characteristics [33].
Figure 1: Chimera formation during PCR amplification and detection approaches in OTU and ASV workflows.
Contamination in microbiome studies can originate from multiple sources, including laboratory reagents, extraction kits, cross-sample contamination during processing, and environmental introduction during sample collection [61]. The impact of contamination is particularly severe in low-biomass samples, where contaminant DNA can constitute a substantial proportion of the total sequences, potentially leading to completely spurious conclusions about community composition [61].
Advanced Filtering Approaches
Negative Controls and Statistical Methods: The inclusion of negative controls (blanks) throughout the experimental process provides the most direct method for identifying contamination [61]. Computational tools like the decontam R package use prevalence or frequency-based statistical models to identify contaminants by comparing negative controls with experimental samples [61]. The microDecon package employs proportional subtraction of contaminant sequences based on their representation in blank samples [61].
Information-Theoretic Methods: Recent approaches leverage the ecological principle that true microbial taxa exist in structured communities with predictable co-occurrence patterns. The mutual information (MI)-based filtering method constructs microbial interaction networks where nodes represent taxa and edges represent statistical associations measured by mutual information [61]. Contaminants, which are introduced randomly, typically appear as isolated nodes with minimal connectivity to the true community network and can be filtered based on their low integration into this network [61].
Table 2: Contamination Filtering Methods and Their Applications
| Method | Principle | Requirements | Strengths | Limitations |
|---|---|---|---|---|
| Threshold-Based Filtering | Removal of low-abundance taxa | No controls needed | Simple implementation | Arbitrary threshold; removes rare true taxa |
| decontam (Prevalence) | Statistical prevalence in controls vs. samples | Negative controls | High specificity | Requires proper controls |
| decontam (Frequency) | Statistical abundance in controls vs. samples | Negative controls | Identifies reagent contaminants | Requires proper controls |
| microDecon | Proportional subtraction in blanks | Blank samples | Handles high contamination levels | Assumes common contamination source |
| MI-Based Filtering | Network connectivity analysis | None | No controls needed; retains informative rare taxa | Computationally intensive |
| PERFect | Covariance matrix analysis | None | Maintains joint taxon distribution | Skews toward dominant taxa |
Comparison of contamination filtering approaches adapted from multiple sources [61] [57].
OTU vs. ASV Approaches: Comparative Performance
Fundamental Methodological Differences
The choice between OTU clustering and ASV denoising represents a fundamental methodological division in microbiome informatics, with significant implications for error management [14] [58] [57]. OTU approaches cluster sequences based on similarity thresholds (typically 97%), intentionally collapsing sequence variation to minimize the impact of errors [58] [57]. In contrast, ASV methods distinguish biological sequences from errors at single-nucleotide resolution, preserving true biological variation while removing technical noise [59] [58] [57].
Performance in Error Management
Benchmarking studies using complex mock communities reveal distinct performance characteristics between these approaches. ASV algorithms (particularly DADA2) demonstrate lower error rates and more consistent output but tend to over-split genuine biological sequences into multiple variants [33]. This over-splitting often results from distinguishing multiple 16S rRNA gene copies that contain natural sequence variation within a single genome [33]. OTU algorithms (particularly UPARSE) achieve clusters with moderately higher error rates but less over-splitting, though they tend to over-merge distinct biological sequences into single clusters [33].
For alpha diversity estimation, ASV-based methods typically provide more accurate estimates of true richness in mock communities, while OTU approaches often overestimate diversity due to error inflation [14] [33]. For beta diversity analyses, both approaches can recover similar ecological patterns, though ASVs generally provide higher resolution for detecting subtle community differences [14] [33].
Figure 2: Comparative workflows of OTU clustering and ASV denoising approaches for error management.
Experimental Protocols for Artifact Management
Comprehensive Quality Control Pipeline
A robust quality control protocol should incorporate both experimental and computational elements:
Pre-sequencing Quality Assurance:
- Utilize high-purity reagents and include multiple negative controls at DNA extraction and PCR amplification stages
- Implement unique molecular identifiers (UMIs) to track and correct for amplification biases
- Optimize PCR cycle numbers to minimize chimera formation and amplification artifacts
- Incorporate mock communities with known composition to quantify technical variability
Post-sequencing Quality Control:
- Perform rigorous quality trimming using tools like Trimmomatic or Cutadapt, with particular attention to read ends where error rates are highest [59]
- Remove primers and adapter sequences completely to prevent mispriming artifacts
- For host-associated samples, implement host DNA removal through alignment-based filtering
- Employ systematic contamination identification using both control-based and data-driven methods
Protocol for Benchmarking Error Rates
To quantitatively assess error rates in sequencing data:
- Sequence a well-characterized mock community alongside experimental samples
- Process data through identical bioinformatic pipelines as experimental samples
- Map resulting OTUs/ASVs to reference sequences of known mock community members
- Calculate error rate as: (Misidentified sequences / Total sequences) × 100
- Quantify over-splitting by counting reference sequences represented by multiple OTUs/ASVs
- Quantify over-merging by counting OTUs/ASVs containing multiple reference sequences
This protocol provides objective metrics for comparing performance across different bioinformatic approaches and optimizing parameters for specific experimental conditions [33].
The Scientist's Toolkit: Essential Research Reagents and Materials
Table 3: Essential Research Reagents and Computational Tools for Managing Sequencing Artifacts
| Item | Function | Example Products/Tools |
|---|---|---|
| Mock Communities | Positive controls for quantifying errors and biases | ZymoBIOMICS Microbial Community Standards [57] |
| High-Fidelity Polymerase | Reduces PCR errors and chimera formation | Q5, Phusion |
| DNA Extraction Blanks | Negative controls for contamination identification | Molecular grade water processed alongside samples [61] |
| UMI Adapters | Molecular barcoding for error correction | Custom synthesized UMIs |
| Quality Control Tools | Assessing raw sequence quality | FastQC, PRINSEQ [33] |
| Denoising Algorithms | Error correction for ASV inference | DADA2, Deblur [59] [33] |
| Clustering Algorithms | OTU generation with error reduction | UPARSE, VSEARCH, Mothur [33] |
| Chimera Detection Tools | Identification and removal of chimeras | UCHIME, DADA2 chimera removal [57] [33] |
| Contamination Filtering | Statistical identification of contaminants | decontam, microDecon, MI-based filtering [61] |
| Reference Databases | Taxonomic classification and chimera detection | SILVA, Greengenes, UNITE [59] [33] |
Effective management of sequencing errors, chimeras, and contamination requires an integrated approach spanning experimental design, laboratory procedures, and computational analysis. The choice between OTU and ASV methodologies involves important trade-offs in error management, with ASV approaches generally providing higher resolution and reproducibility, while OTU methods offer computational efficiency and robustness to certain error types [57] [33]. As benchmarking studies using complex mock communities have revealed, no single method is universally superior; rather, selection should be guided by study objectives, sample type, and available computational resources [33]. By implementing the comprehensive strategies outlined in this guide—including proper controls, optimized protocols, and appropriate bioinformatic pipelines—researchers can significantly enhance the reliability and interpretability of their amplicon sequencing data, leading to more robust conclusions in microbiome research.
In the analysis of microbial communities through high-throughput sequencing, the accuracy of results is critically dependent on the effective discrimination of true biological signals from spurious noise. The processes of designating sequences into Operational Taxonomic Units (OTUs) and Amplicon Sequence Variants (ASVs) are fundamental to this endeavor. OTUs cluster sequences based on a predefined similarity threshold, traditionally 97%, to approximate species-level groupings [1]. In contrast, ASVs are exact, error-corrected sequences that provide single-nucleotide resolution, offering a more precise method for identifying taxonomic units without relying on arbitrary clustering thresholds [1] [59]. Within this analytical framework, filtering strategies play an indispensable role in mitigating the impact of contaminants and sequencing errors. This technical guide examines two principal filtering paradigms: the conventional approach of applying abundance thresholds and the novel information-theoretic method utilizing mutual information. The content is structured to provide researchers, scientists, and drug development professionals with a comprehensive understanding of the theoretical foundations, methodological implementations, and comparative applications of these techniques within OTU and ASV-based research.
Abundance Threshold Filtering
Theoretical Basis and Rationale
Abundance threshold filtering operates on the premise that spurious sequences, originating from contamination or sequencing errors, typically occur at low abundances within datasets [62] [63]. This method applies a cut-off, either in terms of absolute read counts or relative abundance, below which taxonomic units are removed from subsequent analysis. The underlying rationale is that true biological taxa, even those that are rare in a community, are more likely to be reproducibly detected at low levels, whereas noise is characterized by its sporadic presence and minimal abundance [62]. By enforcing a threshold, researchers aim to improve the reliability and precision of microbiome data by systematically removing these potential false positives [63].
Implementation Methodologies
The implementation of abundance filtering can be categorized into two primary approaches, each with distinct procedural steps and considerations.
1. Sample-Wise Absolute Threshold Filtering: This method involves removing OTUs or ASVs with copy counts below a predetermined value within individual samples. For instance, a study on human stool specimens established that filtering OTUs with fewer than 10 copies in a sample significantly increased detection reliability from 44.1% to 73.1%, while removing only 1.12% of total reads [62]. The protocol involves:
- Data Preparation: Obtain the OTU/ASV count table from bioinformatics pipelines (e.g., QIIME2, mothur).
- Threshold Application: For each sample, identify and remove all OTUs/ASVs where the read count is below the chosen threshold (e.g., 10 reads).
- Data Aggregation: Reconstruct the filtered community matrix for downstream analysis.
2. Global Relative Abundance Threshold Filtering: This approach filters taxa based on their relative abundance across the entire dataset. A common threshold is <0.1% of total sequences [62]. The same study reported that this method increased reliability to 87.7%, but at the cost of a substantially higher read loss of 6.97% [62]. The steps include:
- Relative Abundance Calculation: Compute the relative abundance of each OTU/ASV by dividing its count by the total number of sequences in the dataset.
- Threshold Application: Remove all OTUs/ASVs with a mean relative abundance below the chosen cut-off (e.g., 0.1%).
- Precision-Recall Assessment: As highlighted in a dedicated protocol, the effect of the threshold should be evaluated using Precision-Recall (PR) curves. Increasing the threshold typically improves precision (fewer false positives) but reduces recall (potentially more false negatives), and the Area Under the Precision-Recall Curve (AUPRC) summarizes this trade-off [63].
Table 1: Impact of Different Abundance Filtering Strategies on Data Reliability and Read Loss
| Filtering Method | Threshold Applied | Reliability After Filtering | Percentage of Reads Removed |
|---|---|---|---|
| No Filtering | Not Applicable | 44.1% (SE=0.9) | 0% |
| Sample-Wise (Absolute) | <10 copies | 73.1% | 1.12% |
| Global (Relative) | <0.1% abundance | 87.7% (SE=0.6) | 6.97% |
Impact on Downstream Analysis
The choice of filtering strategy profoundly influences the interpretation of microbiome data.
- Alpha-diversity: Metrics sensitive to rare species, such as Observed OTUs/ASVs and Chao1, are significantly reduced by stringent abundance filtering. In contrast, metrics that account for both richness and evenness, like the Shannon and Inverse Simpson indices, are less affected [62].
- Taxonomic Composition: Filtering has a minimal impact on the relative abundance of major phyla and families but can drastically alter the perceived profile of low-abundance taxa [62].
- Beta-diversity: While the overall community structure remains discernible, the fine-scale dissimilarities between samples can be smoothed over when rare variants are removed.
Information-Theoretic Filtering
Theoretical Foundation
Mutual Information (MI)-based filtering represents a paradigm shift from abundance-based methods by leveraging the ecological principle that true microbial taxa exist within a network of interactions, whereas contaminants appear as isolated entities [64] [65]. MI is an information-theoretic functional that measures the statistical dependence between two random variables. For two taxa, X and Y, MI is defined as:
I(X;Y) = H(X) - H(X|Y)
where H(X) is the entropy (a measure of uncertainty) of taxon X's abundance, and H(X|Y) is the conditional entropy of X given Y [64]. A high MI value indicates a strong ecological or functional association between two taxa, implying that their co-occurrence pattern is non-random and potentially biologically meaningful.
Workflow and Algorithm
The MI-based filtering method constructs a microbial interaction network to identify and remove taxa that are not informative to the network's structure [64]. The following workflow outlines the key steps, which are also visualized in the diagram below.
Diagram 1: Workflow for MI-Based Filtering
Step 1: MI Matrix Calculation
The process begins with a microbial abundance matrix (X_{n x m}), where n is the number of samples and m is the number of taxa [64]. A pairwise MI matrix is computed, where each element I(X_i; X_j) represents the mutual information between the abundance profiles of taxon i and taxon j. Unlike correlation measures, MI can capture non-linear relationships [64].
Step 2: Network Construction The MI matrix is transformed into a microbial network graph. In this graph, each node represents a taxon (OTU or ASV), and edges between nodes represent associations whose strength is quantified by the MI value [64].
Step 3: Identification of Isolated Taxa The network is analyzed to identify taxa (nodes) that are poorly connected or entirely isolated from the main network structure. These taxa, which demonstrate minimal to no statistical dependence with others, are flagged as potential contaminants [64].
Step 4: Statistical Inference with Permutation Testing A critical component of this method is evaluating the information loss incurred by removing a set of taxa. A permutation-based hypothesis test is used to measure the probability that an observed increase in information loss from removal is random. This step provides a statistical justification for filtering, preventing the excessive removal of true but low-abundance taxa [64].
Step 5: Filtering Taxa identified as statistically significant contaminants are removed, resulting in a filtered community matrix ready for further ecological analysis.
Advantages in Practice
The MI-based approach offers two significant advantages over traditional methods:
- Non-Arbitrary Thresholding: It does not require an arbitrary choice of an abundance cut-off, which can bias results and lead to the loss of biologically relevant, low-abundance signals [64] [65].
- Detection of Low-Abundance True Taxa: By focusing on network integration rather than abundance, the method can retain rare but genuine community members that would be eliminated by abundance-based filtering [64]. Validation on mock communities has shown that this method effectively maintains true bacteria without significant information loss [64].
Comparative Analysis of Filtering Strategies
The choice between abundance-based and information-theoretic filtering strategies depends on the research objectives, sample type, and available resources. The table below provides a direct comparison to guide this decision.
Table 2: Comparative Analysis of Abundance vs. MI-Based Filtering Strategies
| Feature | Abundance Threshold Filtering | MI-Based Network Filtering |
|---|---|---|
| Underlying Principle | Removes low-count sequences assumed to be spurious [62] [63]. | Removes taxa not integrated into the microbial association network [64]. |
| Threshold Requirement | Requires an arbitrary, pre-defined abundance cut-off. | Does not require an arbitrary abundance threshold; uses statistical significance [64] [65]. |
| Handling of Low-Abundance Taxa | Prone to removing rare but true biological signals. | Can retain rare taxa that show structured associations with the community [64] [65]. |
| Computational Demand | Low; simple arithmetic and sorting operations. | High; involves calculating pairwise associations and network analysis. |
| Best Suited For | Studies with high microbial biomass and low contamination; initial data cleaning. | Complex communities where cross-contamination is a concern; studies focusing on ecological interactions. |
| Impact on Diversity Metrics | Significantly reduces richness estimates (e.g., Observed OTUs, Chao1) [62]. | Aims to preserve phylogenetic and ecological diversity by retaining connected taxa. |
Successful implementation of the described filtering strategies relies on a suite of bioinformatics tools and reference databases.
Table 3: Key Software Tools and Databases for Microbiome Filtering Analysis
| Tool / Resource | Type | Primary Function in Filtering Context |
|---|---|---|
| QIIME 2 [66] [59] | Software Pipeline | A comprehensive, extensible platform for processing and analyzing microbiome data from raw sequences to statistical results. It integrates both OTU and ASV generation methods. |
| DADA2 [66] [59] | Algorithm / R Package | A state-of-the-art tool for modeling and correcting Illumina-sequenced amplicon errors, generating high-resolution ASVs. It is a core plugin within QIIME 2. |
| mothur [16] | Software Pipeline | A widely used, open-source software package for processing 16S rRNA gene sequences, primarily employing OTU-based clustering methods. |
| decontam [64] | R Package | A statistical tool for identifying contaminants in microbiome data based on prevalence in negative controls or association with DNA concentration. |
| PERFect [64] | R Package | Implements a permutation filtering approach to test and account for the loss of information due to filtering taxa. |
| SILVA Database [66] [59] | Reference Database | A comprehensive, curated resource of aligned ribosomal RNA sequence data used for taxonomic classification of OTUs and ASVs. |
| Greengenes Database [62] [59] | Reference Database | A dedicated 16S rRNA gene database that provides a taxonomic framework for classifying bacteria and archaea. |
The selection of an appropriate filtering strategy is a critical step in microbiome data analysis that directly influences biological interpretation. Abundance threshold filtering offers a straightforward, computationally efficient method to improve data reliability, particularly when applied on a per-sample basis. However, its inherent arbitrariness and tendency to discard rare but true taxa are notable limitations. In contrast, mutual information-based filtering provides a sophisticated, network-driven alternative that identifies contaminants based on their lack of ecological integration, preserving low-abundance community members without relying on arbitrary cut-offs.
For researchers engaged in OTU and ASV research, the optimal path forward may involve a hybrid approach. Abundance filtering can serve as an initial clean-up step, while MI-based methods can be applied for a more refined, ecologically-informed removal of contaminants, especially in studies where understanding species interactions is paramount. As the field continues to advance toward higher-resolution techniques like ASVs, the development and adoption of robust, non-arbitrary filtering strategies like the MI-based method will be crucial for generating accurate, reproducible, and biologically meaningful insights into the complex world of microbial communities.
Handling Low-Biomass Samples and Rare Taxa Detection
The study of low-biomass microbial environments—such as certain human tissues, the atmosphere, plant seeds, and treated drinking water—presents unique methodological challenges that are particularly pronounced within the context of Operational Taxonomic Unit (OTU) and Amplicon Sequence Variant (ASV) research [67]. When bacterial biomass is minimal, the inevitable introduction of contaminating DNA from reagents, sampling equipment, and laboratory environments constitutes a significant proportion of the recovered genetic material [67] [68]. This contamination poses a severe threat to data integrity, as it can lead to the misidentification of false positive rare taxa, thereby distorting ecological patterns, functional interpretations, and ultimately, scientific conclusions [69] [68]. The accurate discrimination between genuine rare members of the microbiome and technical artifacts is therefore a fundamental prerequisite for advancing our understanding of microbial ecology and function, especially in environments where microbes are scarce. This guide details the protocols, analytical strategies, and validation methods essential for robust microbial profiling in low-biomass contexts, framed within the ongoing methodological discourse surrounding OTU and ASV analysis.
Experimental Design and Sample Collection
A contamination-aware experimental design is the first and most critical line of defense in low-biomass research. The core principle is to proactively minimize the introduction of contaminants and to incorporate controls that enable their post-hoc identification.
- Strategic Decontamination: All equipment, tools, and surfaces that contact samples should be decontaminated. A recommended protocol involves treatment with 80% ethanol to kill contaminating organisms, followed by a nucleic acid degrading solution (e.g., sodium hypochlorite, UV-C light) to remove traces of environmental DNA [67]. Single-use, DNA-free consumables are ideal.
- Use of Personal Protective Equipment (PPE): Researchers should use extensive PPE—including gloves, masks, cleansuits, and shoe covers—to limit the introduction of human-associated contaminants from skin, hair, and aerosolized droplets [67].
- Comprehensive Process Controls: It is imperative to collect a variety of control samples throughout the experimental process. These controls should be processed alongside actual samples to profile the contaminating DNA introduced at different stages [67] [68]. Key controls include:
- Negative Extraction Controls: Reagents alone without a sample, to identify contaminants from DNA extraction kits.
- Library Preparation Controls: No-template controls to reveal contaminants introduced during library preparation.
- Sampling Controls: Empty collection vessels or swabs exposed to the sampling environment air to account for contamination during collection [67].
- Avoiding Batch Confounding: The experimental layout must ensure that biological groups of interest (e.g., case vs. control) are not processed in separate batches. Phenotypes and key covariates should be distributed across all processing batches (e.g., DNA extraction plates, sequencing runs) to prevent technical variability from generating artifactual biological signals [68].
The following workflow diagram outlines the key stages for robust sample handling, from collection to sequencing.
Wet-Lab Protocols and Sequencing Strategies
The choice of laboratory protocols significantly influences the fidelity of microbial community representation, particularly for challenging low-biomass samples.
DNA Extraction from Low-Biomass Upper Respiratory Tract Samples
A standardized protocol for low-biomass Upper Respiratory Tract (URT) samples recommends a combination of mechanical and chemical lysis to maximize DNA yield from the limited starting material [70]. Following extraction, the 16S rRNA gene V4 region is amplified and sequenced on an Illumina MiSeq platform to characterize the microbial communities [70].
Alternative Sequencing Approaches
For samples that are particularly challenging due to extremely low biomass, high host DNA contamination, or severe DNA degradation, traditional 16S amplicon or whole-metagenome shotgun (WMS) sequencing may be insufficient.
Table 1: Comparison of Sequencing Methods for Challenging Samples
| Method | Principle | Ideal For | Key Advantage | Consideration |
|---|---|---|---|---|
| 16S rRNA Amplicon (V4) [70] | Targets & amplifies the V4 hypervariable region of the 16S gene. | Standard low-biomass profiling (e.g., URT). | Cost-effective; well-established bioinformatic pipelines. | Limited taxonomic resolution (often genus-level); prone to PCR amplification bias. |
| 2bRAD-M [71] | Uses Type IIB restriction enzymes to produce uniform, short tags (~32 bp) from genomes. | Very low biomass (≥1 pg DNA), highly degraded DNA, or samples with high host DNA contamination (e.g., FFPE). | Provides species-level resolution for bacteria, archaea, and fungi; works with severely degraded DNA; sequences only ~1% of the genome. | A relatively novel method; requires specific enzymatic digestion steps. |
| Whole-Metagenome Shotgun (WMS) [71] | Sequences all DNA fragments in a sample. | Higher-biomass samples where functional potential is of interest. | Offers strain-level resolution and functional gene analysis. | Requires high DNA input (often ≥20 ng); inefficient for low-biomass/high-host-DNA samples; more costly. |
The 2bRAD-M method, for instance, uses a Type IIB restriction enzyme (e.g., BcgI) to digest total genomic DNA into iso-length fragments (e.g., 32 bp) [71]. These fragments are then ligated to adaptors, amplified, and sequenced. Computational mapping of these sequences against a custom database of taxa-specific tags allows for species-level identification and relative abundance estimation, even from minute quantities of DNA [71].
Computational Analysis and Contaminant Filtering
Following sequencing, robust bioinformatic processing is essential to distinguish true biological signals from noise. A critical step is filtering, which removes rare features to reduce data sparsity and mitigate the effect of contaminants.
The Impact and Application of Filtering
Filtering rare taxa—those present in a small number of samples with low counts—has been shown to reduce technical variability while preserving the core biological signal in downstream analyses like alpha and beta diversity [72]. It also helps in maintaining the reproducibility of differential abundance analysis and machine learning classification models [72]. However, filtering is complementary to, not a replacement for, dedicated contaminant removal methods.
Filtering and Decontamination Methods
Several computational approaches have been developed to address contamination and spurious sequences.
Table 2: Computational Methods for Filtering and Decontamination
| Method | Underlying Principle | Typical Application | Key Strength | Key Limitation |
|---|---|---|---|---|
| Prevalence & Abundance Filtering [72] | Removes taxa observed in fewer than a threshold percentage of samples (e.g., 5-10%) or with low total counts. | Common first-step filtering in many pipelines (e.g., QIIME, phyloseq). | Simple to implement and understand; reduces data sparsity. | Relies on arbitrary thresholds; may remove true rare biosphere taxa. |
| PERFect [72] | Uses a permutation-based filtering method to evaluate the loss of information upon taxon removal, identifying spurious taxa. | Principled filtering for OTU/ASV tables without control data. | Data-driven; does not require negative controls. | Can be skewed towards retaining dominant taxa. |
| Decontam [72] | Identifies contaminants by correlating taxon frequency with sample DNA concentration or prevalence in negative controls. | Removing contaminants identified via experimental controls. | Highly effective when appropriate control data is available. | Requires auxiliary data (DNA concentration or negative controls). |
| MI-Based Filtering [64] | Removes taxa that are isolated in a microbial association network built using Mutual Information (MI). | Identifying contaminants based on lack of ecological association. | Does not require arbitrary thresholds; can detect true low-abundance taxa. | Performance depends on the accuracy of the inferred network. |
The following diagram illustrates a recommended bioinformatic workflow that integrates these methods.
Special Considerations for Rare Taxa and Platform Selection
The accurate detection of rare taxa is uniquely vulnerable to technical errors, most notably index misassignment. This phenomenon, also known as index hopping or well-to-well leakage, occurs when sequences from one sample are misassigned to another during multiplexed sequencing [69] [68].
- Impact on Rare Biosphere: Index misassignment generates high-quality but biologically false sequences in a sample, creating false positive rare taxa [69]. This can artificially inflate alpha diversity in simple communities, obscure true ecological correlations, and lead to the identification of "fake" keystone species in network analyses [69].
- Sequencing Platform Differences: The rate of index misassignment varies significantly between sequencing platforms. Studies using mock communities have shown that the DNBSEQ-G400 platform can have a markedly lower fraction of potential false positive reads (0.08%) compared to the Illumina NovaSeq 6000 platform (5.68%) [69]. This makes platform selection a critical consideration for studies focused on the rare biosphere.
- Mitigation Strategies: Beyond platform choice, including technical replicates and positive controls (mock communities) in the sequencing run is highly recommended. The consistency of rare taxon detection across replicates can help distinguish robust signals from stochastic noise [69].
Differential Abundance Analysis in Low-Biomass Contexts
Identifying taxa whose abundances differ between sample groups is a common goal that is particularly fraught in low-biomass studies. Different differential abundance (DA) methods can produce vastly different results on the same dataset [73].
- Method Variability: An evaluation of 14 DA methods across 38 datasets found that the number and identity of significant ASVs/OTUs identified varied dramatically depending on the tool used [73]. For example, some methods like LEfSe and edgeR may identify a large number of significant taxa, while compositionally aware tools like ALDEx2 and ANCOM-II typically produce more conservative results [73].
- Effect of Filtering: The practice of filtering rare taxa before DA testing can significantly alter the results. While filtering reduces multiple testing burden and can improve power, the choice of filtering threshold must be independent of the test statistic to avoid introducing bias [73].
- Recommendation for Robustness: Given the variability between methods, it is prudent to use a consensus approach. Interpreting results that are consistently significant across multiple DA methods (e.g., both ALDEx2 and ANCOM-II) provides more confidence in the biological conclusions [73].
The Scientist's Toolkit: Essential Reagents and Materials
Table 3: Key Research Reagent Solutions for Low-Biomass Studies
| Item | Function | Key Consideration |
|---|---|---|
| DNA-Free Nucleic Acid Degrading Solution (e.g., bleach, specialized commercial solutions) [67] | To remove trace DNA from work surfaces and equipment. | Critical for eliminating contaminating DNA that autoclaving and ethanol alone cannot remove. |
| Single-Use, DNA-Free Collection Swabs and Vessels [67] | To collect samples without introducing contaminants. | Prevents contamination at the first point of contact with the sample. |
| Soil DNA Isolation Plus Kit (Norgen) [74] | DNA extraction from complex, potentially low-biomass samples. | Used in wastewater microbiome studies; includes reagents for mechanical and chemical lysis. |
| ZymoBIOMICS Microbial Community DNA Standard [69] | A mock community used as a positive control. | Contains known proportions of microbial cells; validates the entire wet-lab and bioinformatic pipeline. |
| Type IIB Restriction Enzymes (e.g., BcgI) [71] | For 2bRAD-M library preparation from degraded or low-biomass DNA. | Produces uniform, short fragments that are robust to degradation and amenable to PCR from minimal template. |
| Negative Extraction Control Reagents [67] [68] | Aliquots of the DNA extraction kit reagents set aside without a sample. | Serves as a process control to identify contaminants inherent to the extraction kits. |
The reliable analysis of low-biomass samples and the detection of rare taxa demand an integrated strategy that spans experimental design, laboratory practice, and computational analysis. There is no single solution; rather, robustness is achieved through a combination of rigorous contamination control, the use of appropriate positive and negative controls, careful selection of sequencing and bioinformatic methods, and conservative interpretation of results, particularly for low-abundance features. As the field moves forward, the adoption of these comprehensive practices is essential for generating reproducible and biologically meaningful insights from the most challenging microbial ecosystems.
Addressing Over-splitting in ASVs and Over-merging in OTUs
The analysis of 16S rRNA gene amplicon sequencing data represents a cornerstone of modern microbial ecology, enabling researchers to decipher the composition and dynamics of complex microbial communities across diverse environments, from host-associated microbiomes to environmental ecosystems. For years, the field has relied on two principal approaches for processing these sequence data: Operational Taxonomic Units (OTUs) and Amplicon Sequence Variants (ASVs). The OTU approach, traditionally the dominant method, clusters sequences based on a fixed identity threshold (typically 97%) to overcome sequencing errors and reduce data complexity. In contrast, the newer ASV approach employs denoising methods to distinguish true biological variation from sequencing errors, producing exact sequence variants that can differ by as little as a single nucleotide [33] [21].
This methodological shift has sparked considerable debate within the scientific community regarding the relative merits and limitations of each approach. ASV methods offer higher resolution and reproducibility across studies but tend to over-split biological sequences into multiple variants. OTU methods provide more robust clustering against sequencing errors but often over-merge genetically distinct taxa into single units [33]. Understanding these complementary biases is crucial for accurate biological interpretation, particularly in drug development contexts where microbial community changes may correlate with treatment efficacy or disease states. This technical guide examines the core challenges of over-splitting and over-merging through the lens of contemporary benchmarking studies, providing actionable frameworks for method selection and implementation in research settings.
Core Mechanisms: Understanding Over-splitting and Over-merging
The Technical Basis of Over-splitting in ASV Methods
Amplicon Sequence Variants (ASVs) are generated through denoising algorithms that employ statistical models to distinguish true biological sequences from errors introduced during amplification and sequencing. Leading ASV methods including DADA2, Deblur, MED, and UNOISE3 each implement distinct computational frameworks for this error discrimination [33]. DADA2 utilizes an iterative process of error estimation and partitioning based on a parametric error model, while Deblur employs a pre-calculated statistical error profile to identify and correct erroneous sequence positions. UNOISE3 compares sequence abundance patterns to collapse similar reads into error-free and erroneous categories using a probabilistic model that assesses insertion and substitution probabilities [33].
The tendency of ASV methods toward over-splitting stems from their fundamental design to detect single-nucleotide differences. This high resolution becomes problematic when biologically legitimate sequences from the same strain or species are incorrectly divided into separate variants due to:
- Intragenomic heterogeneity: Multiple copies of the 16S rRNA gene within a single organism often contain natural sequence variations
- True biological microdiversity: Authentic but ecologically insignificant sequence variation within populations
- Persistent sequencing errors that escape statistical filters and are misclassified as biological variants
Recent benchmarking using complex mock communities has demonstrated that ASV algorithms, particularly DADA2, produce a consistent output but suffer from this over-splitting behavior, generating more sequence variants than the known number of strains in reference communities [33]. This inflation of diversity estimates can have profound implications for downstream analyses, potentially leading to spurious correlations in clinical studies or incorrect assessments of microbial community responses to therapeutic interventions.
The Technical Basis of Over-merging in OTU Methods
Operational Taxonomic Units (OTUs) traditionally cluster sequences based on identity thresholds, most commonly at 97% similarity, which approximately corresponds to genus-level taxonomic distinctions. This approach includes algorithms such as UPARSE, VSEARCH-DGC (Distance-based Greedy Clustering), Average Neighborhood (AN), and Opticlust implemented within platforms like mothur [33]. These methods employ different clustering strategies: UPARSE and VSEARCH-DGC implement greedy clustering algorithms to construct OTU structures, while mothur's Opticlust assembles clusters iteratively, evaluates their quality through the Matthews correlation coefficient, and consequently merges, relocates, or assigns sequences as novel clusters [33].
The over-merging phenomenon in OTU methods manifests when genetically distinct but closely related taxa are combined into single OTUs due to:
- Application of rigid clustering thresholds that do not account for taxonomic group-specific sequence variation patterns
- Inadequate resolution to distinguish genuine biological differences at the strain or species level
- Algorithmic limitations in dealing with sparse data or low-abundance sequences
Benchmarking analyses reveal that OTU algorithms achieve clusters with lower error rates compared to ASV methods but demonstrate more pronounced over-merging of reference sequences [33]. This consolidation of biologically distinct sequences can obscure meaningful patterns in microbial community dynamics, particularly in contexts where strain-level differences carry important functional implications for drug metabolism, pathogenicity, or therapeutic response.
Benchmarking Analysis: Comparative Performance of OTU and ASV Methods
Experimental Framework and Mock Community Design
Comprehensive benchmarking of OTU and ASV algorithms requires reference datasets with known composition—a requirement that real environmental samples cannot fulfill due to their undefined ground truth. To address this limitation, recent studies have employed complex mock microbial communities that provide validated compositional standards for objective evaluation. One such benchmark utilized the HC227_V3V4 dataset, generated from the most complex mock community to date comprising 227 bacterial strains from 197 different species [33] [34]. This community was amplified using primers targeting the V3-V4 variable region of the 16S rRNA gene and sequenced on an Illumina MiSeq4000 platform in a 2×300 bp paired-end run [33].
To enhance the comparative analysis, researchers supplemented this primary dataset with thirteen additional 16S rRNA gene amplicon datasets from the Mockrobiota database, selected to cover a wide spectrum of input diversity ranging from 15 to 59 bacterial species and focusing on the V4 region to minimize methodological discrepancies [33]. This multi-layered approach provided a robust framework for evaluating algorithm performance across varying community complexities and sequencing conditions.
All datasets underwent unified preprocessing steps to ensure fair comparisons, including sequence quality assessment with FastQC, primer stripping with cutPrimers, read merging with USEARCH, length trimming with PRINSEQ and FIGARO, orientation checking and filtering with mothur, and additional quality filtration with USEARCH to discard reads possessing ambiguous characters and optimize the maximum error rate [33]. Mock samples were subsampled to 30,000 reads per sample to standardize sequencing depth across comparisons.
Table 1: Mock Communities Used in Benchmarking Analysis
| Community Name | Strains | Species | Target Region | Sequencing Platform |
|---|---|---|---|---|
| HC227_V3V4 | 227 | 197 | V3-V4 | Illumina MiSeq4000 |
| Mockrobiota 1 | 15 | 15 | V4 | Illumina MiSeq |
| Mockrobiota 2 | 21 | 21 | V4 | Illumina MiSeq |
| Mockrobiota 3 | 59 | 59 | V4 | Illumina MiSeq |
Quantitative Comparison of Algorithm Performance
The benchmarking study evaluated eight algorithms representing both OTU and ASV approaches: DADA2, Deblur, MED, UNOISE3 (ASV methods), and UPARSE, DGC, AN, and Opticlust (OTU methods) [33]. Performance was assessed across multiple dimensions including error rates, resemblance to intended microbial composition, over-merging/over-splitting behavior, and diversity analyses.
The results revealed a clear trade-off between ASV and OTU approaches. ASV algorithms—led by DADA2—produced consistent output but suffered from over-splitting, while OTU algorithms—led by UPARSE—achieved clusters with lower errors but with more over-merging [33]. Notably, UPARSE and DADA2 showed the closest resemblance to the intended microbial community, particularly when considering measures for alpha and beta diversity. This suggests that despite their methodological differences, both approaches can yield reasonably accurate representations of community structure when properly implemented.
Table 2: Performance Comparison of OTU and ASV Methods on Mock Communities
| Method | Type | Error Rate | Over-splitting | Over-merging | Community Resemblance | Runtime Efficiency |
|---|---|---|---|---|---|---|
| DADA2 | ASV | Low | High | Low | Excellent | Moderate |
| Deblur | ASV | Low | Moderate | Low | Good | Fast |
| UNOISE3 | ASV | Low | Moderate | Low | Good | Moderate |
| UPARSE | OTU | Very Low | Low | Moderate | Excellent | Fast |
| DGC | OTU | Low | Low | High | Good | Moderate |
| Opticlust | OTU | Low | Low | Moderate | Good | Slow |
The analysis further demonstrated that the choice between OTU and ASV approaches has stronger effects on diversity measures than other methodological decisions such as rarefaction level or OTU identity threshold (97% vs. 99%) [21]. This effect was particularly pronounced for presence/absence indices such as richness and unweighted Unifrac, highlighting the critical importance of method selection for studies focusing on occurrence-based diversity metrics.
Practical Implementation: Workflows and Protocols
Standardized Analysis Workflow for 16S rRNA Data
To ensure reproducible and comparable results across studies, researchers should adopt standardized workflows for 16S rRNA amplicon data analysis. The following diagram illustrates a generalized workflow that accommodates both OTU and ASV approaches:
Figure 1: Standardized workflow for 16S rRNA amplicon data analysis incorporating both OTU and ASV approaches
Detailed Protocol for ASV Generation with DADA2
For researchers selecting the ASV approach, DADA2 represents one of the most widely used and accurately performing algorithms based on benchmarking studies [33]. The following protocol outlines the key steps for ASV generation using DADA2:
Quality Filtering and Trimming: Process forward and reverse reads separately, trimming based on quality profiles and filtering out reads with expected errors exceeding a defined threshold (typically maxEE=2).
Learn Error Rates: Estimate the error rates from the data itself using a machine learning algorithm that alternates between estimating the error rates and inferring sample composition.
Dereplication: Combine identical reads to reduce redundancy and improve computational efficiency.
Sample Inference: Apply the core sample inference algorithm to distinguish true biological sequences from sequencing errors.
Merge Paired Reads: Combine forward and reverse reads to create the full denoised sequences.
Construct Sequence Table: Build an ASV table recording the number of times each amplicon sequence variant appears in each sample.
Remove Chimeras: Identify and remove chimeric sequences formed during PCR amplification.
This protocol can be implemented in R using the DADA2 package, with careful attention to parameter settings that can influence the degree of over-splitting observed in the final output.
Detailed Protocol for OTU Clustering with UPARSE
For researchers opting for the OTU approach, UPARSE consistently demonstrates high performance in benchmarking analyses [33]. The following protocol outlines the UPARSE workflow for OTU generation:
Read Merging: Combine paired-end reads using the
fastq_mergepairscommand in USEARCH with stringent quality filtering.Quality Filtering: Remove low-quality sequences using the
fastq_filtercommand with parameters such asfastq_maxee_rate=0.01to discard reads with high expected errors.Dereplication: Identify unique sequences and their abundances using the
derep_fulllengthcommand.Abundance Sorting and Uniquing: Sort sequences by abundance and retain only unique sequences to improve clustering efficiency.
OTU Clustering: Cluster sequences at 97% identity using the
cluster_otuscommand, which includes built-in chimera filtering.Chimera Removal: Perform additional reference-based chimera detection using tools like VSEARCH with databases such as RDP or SILVA.
Construct OTU Table: Map quality-filtered reads back to OTU representatives to generate the final abundance table using the
usearch_globalcommand with 97% identity threshold.
This workflow can be implemented within the USEARCH platform, with the minsize parameter (typically set to 8 or 10) playing a crucial role in filtering rare sequences that may represent errors rather than biological variants.
Table 3: Essential Research Reagents and Computational Tools for 16S rRNA Analysis
| Tool/Resource | Type | Primary Function | Application Context |
|---|---|---|---|
| DADA2 | R Package | Denoising for ASV generation | High-resolution community profiling, strain-level differentiation |
| USEARCH/UPARSE | Algorithm Suite | OTU clustering and processing | Traditional community analysis, error-resistant clustering |
| QIIME2 | Pipeline | End-to-end analysis platform | Comprehensive workflow management, reproducible analysis |
| mock community HC227 | Reference Standard | Algorithm benchmarking | Method validation, pipeline optimization |
| SILVA database | Reference Database | Taxonomic classification | Sequence alignment, taxonomic assignment |
| PICRUSt2 | Bioinformatics Tool | Functional prediction | Metagenome prediction from 16S data, hypothesis generation |
| FastQC | Quality Tool | Sequence quality control | Data QC, trimming parameter determination |
| vsearch | Algorithm Tool | Open-source alternative to USEARCH | Read processing, clustering, chimera detection |
Emerging Solutions: PICRUSt2 for Functional Prediction
A significant advancement in the field is the development of PICRUSt2 (Phylogenetic Investigation of Communities by Reconstruction of Unobserved States), which enables prediction of functional potential from 16S rRNA sequences [75]. This tool represents a major evolution from its predecessor, with key improvements including:
- Expanded reference database with 10x more genomes
- Compatibility with both OTU and ASV input data
- Ability to predict MetaCyc pathway abundances comparable to shotgun metagenomics
- Implementation of MinPath for more rigorous pathway inference
The PICRUSt2 workflow involves four key steps: (1) phylogenetic placement of query sequences into a reference tree, (2) hidden state prediction of gene families, (3) metagenome prediction, and (4) pathway inference [75]. This tool is particularly valuable for drug development applications where understanding functional potential may be more relevant than taxonomic composition alone.
Integrated Analysis Framework: Mitigating Technical Biases
Decision Framework for Method Selection
Given the complementary strengths and limitations of OTU and ASV approaches, researchers should adopt a context-dependent strategy for method selection. The following decision framework provides guidance based on research objectives:
Choose ASV Methods When:
- Studying strain-level dynamics with potential functional implications
- Requiring consistent labels for cross-study comparisons
- Working with well-characterized communities with minimal intragenomic variation
- Prioritizing detection of rare variants with potential biological significance
Choose OTU Methods When:
- Analyzing complex environmental samples with high phylogenetic diversity
- Working with noisier datasets or lower sequencing quality
- Prioritizing robustness over fine-scale resolution
- Conducting analyses where established bioinformatics pipelines rely on OTU inputs
Consider Hybrid Approaches When:
- Addressing research questions spanning multiple ecological scales
- Requiring validation of key findings across methodological frameworks
- Developing novel algorithms that incorporate strengths of both approaches
Visualizing the Trade-offs in Method Selection
The relationship between key performance metrics for OTU and ASV methods can be visualized through the following conceptual diagram:
Figure 2: Decision framework for selecting between OTU and ASV approaches based on research context
Future Directions and Methodological Evolution
The ongoing methodological evolution in 16S rRNA analysis suggests several promising directions for resolving the over-splitting/over-merging dichotomy:
Reference-Based Optimization: Development of taxon-specific clustering thresholds that account for variable evolutionary rates across phylogenetic groups
Hybrid Algorithms: Approaches that apply denoising principles within defined taxonomic frameworks to maintain biological realism while reducing errors
Long-Read Technologies: Implementation of third-generation sequencing platforms that provide full-length 16S sequences, potentially resolving ambiguities in short-read data
Integration with Metagenomics: Combined analysis of 16S amplicon and shotgun metagenomic data from the same samples to validate and refine taxonomic assignments
Machine Learning Approaches: Application of sophisticated classification algorithms that learn error patterns and biological variation from complex datasets
As these methodological advances mature, the research community may eventually transcend the current OTU/ASV dichotomy through more nuanced approaches that better capture the biological reality of microbial communities while minimizing technical artifacts.
The comparative analysis of OTU and ASV methods reveals a fundamental trade-off in 16S rRNA amplicon data analysis between over-splitting of biological sequences (characteristic of ASV approaches) and over-merging of distinct taxa (characteristic of OTU methods). Benchmarking studies using complex mock communities demonstrate that ASV algorithms led by DADA2 produce consistent output but suffer from over-splitting, while OTU algorithms led by UPARSE achieve clusters with lower errors but with more over-merging [33].
This methodological choice has stronger effects on diversity measures than other analytical decisions such as rarefaction level or OTU identity threshold [21], emphasizing the critical importance of informed method selection based on specific research questions and sample characteristics. For drug development professionals and microbial ecologists, understanding these biases is essential for accurate interpretation of microbial community dynamics in response to therapeutic interventions or environmental perturbations.
The field continues to evolve with emerging solutions such as PICRUSt2 for functional prediction [75] and increasingly sophisticated benchmarking frameworks. By acknowledging the limitations of current approaches and strategically selecting methods based on research priorities, scientists can more effectively harness the power of 16S rRNA amplicon sequencing to advance our understanding of microbial communities in health, disease, and biotechnological applications.
Data Integration and Cross-Study Comparison Challenges
In the field of microbial ecology, high-throughput marker-gene sequencing has become a fundamental tool for profiling complex microbial communities. The analysis of 16S ribosomal RNA gene sequences allows researchers to characterize the taxonomic composition of microbiomes from diverse environments, ranging from the human gut to wastewater treatment systems [76]. For years, the standard analytical approach has relied on Operational Taxonomic Units (OTUs), which are clusters of sequencing reads that differ by less than a fixed dissimilarity threshold—typically 97% similarity, approximating the species boundary in prokaryotes [77] [19]. This clustering strategy was originally adopted to mitigate sequencing errors and technical artifacts inherent in early sequencing technologies. However, recent methodological advances have enabled a paradigm shift toward Amplicon Sequence Variants (ASVs), which are exact biological sequences inferred from the data through error-correction algorithms rather than clustering approaches [19]. ASVs provide single-nucleotide resolution, offering finer taxonomic discrimination and greater reproducibility across studies.
The tension between these two approaches reflects a fundamental challenge in microbial bioinformatics: balancing technical accuracy with biological meaning. While OTUs intentionally blur fine genetic variation to create stable taxonomic units, ASVs aim to capture the full biological variation present in a sample. This distinction becomes critically important when integrating data across multiple studies, as the choice of analytical unit profoundly affects downstream ecological interpretations, cross-study comparisons, and biomarker discovery [77] [76]. Understanding the relative strengths and limitations of OTUs and ASVs is therefore essential for any researcher seeking to conduct robust integrative analysis of microbiome data.
Fundamental Differences Between OTUs and ASVs
Methodological Foundations
The processes for generating OTUs and ASVs reflect fundamentally different philosophical approaches to handling sequencing data. OTU clustering employs either de novo methods (grouping sequences based on pairwise similarity within a dataset) or closed-reference methods (mapping sequences to a predefined reference database). Both approaches aggregate sequences at an arbitrary similarity threshold, typically 97%, producing consensus sequences that represent the centroid of each cluster [19]. This process effectively reduces technical errors by averaging across similar sequences but simultaneously obscures legitimate biological variation.
In contrast, ASV inference utilizes a denoising process that models and corrects sequencing errors based on the quality profiles of the sequencing run itself. Algorithms such as DADA2 employ a statistical error model to distinguish true biological sequences from technical artifacts, resulting in exact sequence variants that can differ by as little as a single nucleotide [77] [19]. This approach does not rely on arbitrary similarity thresholds and preserves the full biological variation detected in the data.
Table 1: Fundamental Methodological Differences Between OTUs and ASVs
| Feature | OTUs (Operational Taxonomic Units) | ASVs (Amplicon Sequence Variants) |
|---|---|---|
| Definition | Clusters of sequences with <97% dissimilarity | Exact biological sequences after error correction |
| Resolution | Limited by clustering threshold | Single-nucleotide differences |
| Technical Basis | Sequence similarity clustering | Error modeling and correction |
| Dependence on Reference | Closed-reference: complete; De novo: none | Reference-independent |
| Data Output | Consensus sequences | Exact sequences |
| Typical Abundance | Hundreds to thousands per sample [16] | Generally fewer than OTUs after filtering [16] |
Biological Interpretation Challenges
The methodological differences between OTUs and ASVs have profound implications for biological interpretation. OTU clustering risks oversplitting or overlumping biological variation, potentially grouping distinct taxa together or separating genuine intraspecific variation into artificial units. This is particularly problematic given that intragenomic variation in the 16S rRNA gene exists naturally, with an average of 0.58 variants per copy of the full-length 16S rRNA gene in bacterial genomes [51]. This means that a single bacterial genome with multiple rRNA operons may legitimately contain several distinct 16S sequences, which would be artificially split into separate ASVs or clustered into a single OTU depending on the threshold applied.
For example, Escherichia coli genomes typically contain 7 copies of the 16S rRNA gene, with a median of 5 distinct full-length ASVs per genome [51]. To cluster these legitimate intragenomic variants into a single OTU requires a distance threshold of approximately 5.25% for full-length sequences—far higher than the traditional 3% threshold [51]. This illustrates the fundamental tension in selecting analytical units: ASVs may split a single genome into multiple units, while OTUs may cluster distinct species together. Research has shown that when using a 3% distance threshold, 27.4% of OTUs containing full-length sequences actually encompass 16S rRNA gene sequences from multiple species [51].
Core Challenges in Data Integration and Cross-Study Comparison
Technical and Batch Effects
Integrating microbiome data from multiple studies introduces substantial technical challenges, primarily due to batch effects introduced by variations in sampling procedures, DNA extraction methods, sequencing platforms, and experimental protocols. These technical artifacts can confound biological signals and lead to spurious conclusions if not properly addressed. Batch effects in microbiome data typically manifest as multiplicative technical noise affecting sequencing measurements, representing the differential efficiency with which microbial DNA from a sample is captured and detected in the final sequencing data [78].
The severity of these batch effects was highlighted in a recent integrative analysis of five colorectal cancer metagenomics studies conducted in different countries, where technical variation threatened to obscure genuine biological signals [78]. Novel methods like MetaDICT have been developed specifically to address these challenges by initially estimating batch effects using weighting methods from causal inference literature, then refining the estimation through shared dictionary learning that captures universal microbial interaction patterns across studies [78]. This approach demonstrates that successful data integration requires both technical correction and leveraging biological structures conserved across datasets.
Ecological Diversity Assessment
The choice between OTUs and ASVs significantly impacts the assessment of microbial diversity, potentially leading to different ecological conclusions. A comprehensive comparison using samples from 17 adjacent habitats across a 700-meter ecological gradient found that OTU clustering consistently led to marked underestimation of ecological diversity indicators compared to ASV-based analysis [77]. This distortion affected not only alpha diversity (within-sample diversity) but also beta diversity (between-sample differentiation) and gamma diversity (overall landscape diversity).
The study compared two levels of OTU clustering (99% and 97%) with ASV data across ten different ecological indexes, finding that OTU-based approaches disproportionately affected measurements of species diversity, dominance, and evenness [77]. Multivariate ordination analyses were also sensitive to the choice of analytical unit, exhibiting differences in tree topology and coherence depending on whether OTUs or ASVs were used. These findings suggest that ASV-based analysis provides a more accurate representation of true ecological patterns, particularly for prokaryotic communities [77].
Table 2: Impact of OTU vs. ASV Analysis on Ecological Diversity Metrics
| Diversity Metric | OTU-Based Analysis | ASV-Based Analysis | Practical Implications |
|---|---|---|---|
| Alpha Diversity | Underestimated due to clustering | Higher resolution captures more diversity | ASVs detect more species within samples |
| Beta Diversity | Distorted patterns due to lumping | More accurate differentiation | ASVs better distinguish between communities |
| Gamma Diversity | Reduced overall diversity | Comprehensive diversity capture | ASVs provide landscape-level accuracy |
| Dominance Index | Skewed toward abundant clusters | More balanced distribution | ASVs better represent rare taxa |
| Evenness Index | Altered community structure | Natural abundance distribution | ASVs preserve true community structure |
Taxonomic Consistency and Database Limitations
Data integration faces significant hurdles in taxonomic consistency, particularly when combining studies that used different reference databases, taxonomic naming conventions, or analytical pipelines. Closed-reference OTU methods are especially vulnerable to database incompleteness, as sequences not represented in the reference database are necessarily discarded from analysis [19]. This limitation systematically biases diversity measurements and can lead to condition-dependent artifacts if some experimental conditions contain more unrepresented taxa than others.
ASV methods circumvent this limitation by being reference-independent during the initial variant calling, though they still require taxonomic assignment against reference databases afterward. However, traditional databases suffer from inconsistent taxonomic nomenclature, non-uniform sequence lengths, and insufficient representation of non-cultivable bacterial strains [50]. This has prompted efforts to create specialized databases, such as a gut-specific V3-V4 region database that integrates resources from SILVA, NCBI, and LPSN with 16S rRNA sequences from 1,082 human gut samples to improve coverage of under-represented taxa [50].
Experimental Protocols for Robust Data Integration
MetaDICT Framework for Batch Effect Correction
The MetaDICT framework represents a sophisticated two-stage approach for microbiome data integration that addresses both technical artifacts and biological variation preservation [78]. The protocol begins with initial estimation of batch effects using covariate balancing methods from causal inference literature, which weight samples to account for confounding variables. This approach recognizes that batch effects affect sequencing counts multiplicatively rather than additively, making traditional regression-based adjustment suboptimal [78].
The second stage refines this estimation through shared dictionary learning, which exploits two intrinsic structures of microbiome data: (1) universal microbial interaction patterns conserved across studies, and (2) phylogenetic smoothness of measurement efficiency, where taxonomically similar organisms exhibit similar technical biases [78]. The shared dictionary consists of atoms representing groups of microbes whose abundance changes are highly correlated, capturing ecosystem-level organization that transcends individual studies. The framework solves a nonconvex optimization problem initialized by a spectral method and the first-stage estimation, utilizing graph Laplacian based on phylogenetic trees to enforce smoothness in the estimated measurement efficiencies [78].
Application of MetaDICT to both synthetic and real datasets demonstrated improved robustness in correcting batch effects while preserving biological variation, particularly in challenging scenarios with unobserved confounding variables, high heterogeneity across datasets, or complete confounding between batch and biological covariates [78]. The method successfully characterized microbial interactions in colorectal cancer studies and identified generalizable microbial signatures in immunotherapy microbiome studies.
ASVtax Pipeline for Species-Level Identification
The ASVtax pipeline addresses the critical need for accurate species-level identification in microbiome studies, which is essential for clinical applications where different species within the same genus can exhibit substantially different pathogenic potential [50]. This protocol begins with constructing a non-redundant ASV database specifically tailored to the V3-V4 regions (positions 341-806) by integrating data from SILVA, NCBI, LPSN, and 1,082 human gut samples. This integrated approach standardizes species nomenclature and significantly improves coverage for strict anaerobes and uncultured microorganisms that are often poorly represented in traditional databases [50].
The core innovation of ASVtax is its use of flexible classification thresholds rather than fixed similarity cutoffs. By analyzing 674 families, 3,661 genera, and 15,735 species, the pipeline established precise taxonomic thresholds ranging from 80% to 100% similarity, with clear thresholds identified for 87.09% of families and 98.38% of genera [50]. This approach resolves misclassifications between closely related species and reduces false negatives caused by high intraspecies variability.
The pipeline combines k-mer feature extraction, phylogenetic tree topology analysis, and probabilistic models to achieve precise annotation of new ASVs, successfully identifying 23 new genera within the clinically important family Lachnospiraceae [50]. This demonstrates how flexible, data-driven thresholds can overcome the limitations of fixed similarity boundaries that have long hampered cross-study comparisons in microbiome research.
Visualization of Data Integration Workflows
Diagram 1: Data Integration Workflow and Challenges: This diagram illustrates the comprehensive process of integrating microbiome data from multiple studies, highlighting key challenges and methodological solutions.
Table 3: Essential Computational Tools and Databases for Microbiome Data Integration
| Tool/Resource | Type | Primary Function | Application in Data Integration |
|---|---|---|---|
| DADA2 [16] [77] | Algorithm | ASV inference via error correction | Generates exact sequence variants for cross-study comparison |
| MOTHUR [16] | Pipeline | OTU clustering and community analysis | Traditional workflow for microbiome analysis |
| SILVA Database [50] | Reference | Quality-checked rRNA sequences | Taxonomic assignment and reference alignment |
| NCBI RefSeq [50] | Reference | Curated sequence database | Expansion of taxonomic reference sets |
| LPSN [50] | Reference | Bacterial nomenclature database | Standardization of taxonomic names |
| MetaDICT [78] | Framework | Batch effect correction | Data integration across heterogeneous studies |
| ASVtax [50] | Pipeline | Species-level identification | Flexible taxonomic threshold application |
| metaGEENOME [79] | R Package | Differential abundance analysis | Statistical analysis of cross-study patterns |
The challenges of data integration and cross-study comparison in microbiome research represent both a significant obstacle and an opportunity for methodological innovation. The transition from OTU-based to ASV-based analysis marks a fundamental shift in how we conceptualize microbial diversity, moving from arbitrary clustering toward biologically meaningful units that can be consistently compared across studies [19]. However, this transition requires sophisticated approaches to address persistent challenges including batch effects, database inconsistencies, and heterogeneous experimental designs.
Future advances in microbiome data integration will likely focus on several key areas: (1) development of more comprehensive reference databases that better capture global microbial diversity; (2) standardization of experimental protocols and metadata reporting to facilitate meaningful comparisons; (3) flexible, data-driven analytical frameworks that adapt to the specific characteristics of different microbial communities; and (4) integration of multi-omics data to contextualize taxonomic findings with functional insights. As these methodological improvements mature, we can anticipate more robust, reproducible, and generalizable insights into the structure and function of microbial ecosystems across diverse environments and conditions.
Benchmarking Performance: Accuracy, Diversity, and Ecological Signals
In microbial ecology, the accurate reconstruction of community composition through targeted amplicon sequencing remains a formidable challenge due to sequencing errors, methodological biases, and bioinformatic processing choices [80]. Mock communities—artificially constructed assemblages of known microorganisms—provide an essential ground truth for benchmarking these processes, enabling researchers to quantify errors and evaluate the taxonomic fidelity of their data [34]. The choice between analyzing results as Operational Taxonomic Units (OTUs) or Amplicon Sequence Variants (ASVs) represents a major methodological crossroad, each with distinct advantages and limitations that can fundamentally shape biological interpretations [22] [21]. This technical guide examines the core principles of mock community analysis, providing a structured framework for assessing error rates and taxonomic fidelity within the broader context of OTU and ASV research paradigms.
The Critical Role of Mock Communities in Method Benchmarking
Mock communities serve as indispensable controls in microbiome research by providing a known composition against which technical performance can be measured. Their utility spans multiple applications:
- Error Quantification: Mock communities enable systematic measurement of sequencing errors, chimeras, and amplification biases that distort community representation [80].
- Pipeline Validation: By providing a known ground truth, mock communities allow objective evaluation of bioinformatics pipelines for OTU clustering, ASV denoising, and taxonomic classification [34] [81].
- Methodological Comparisons: Complex mock communities, such as one comprising 235 bacterial strains representing 197 distinct species, offer a rigorous framework for comparing clustering and denoising algorithms [34].
The power of mock community analysis is particularly evident in resolving the ongoing methodological debate between OTU and ASV approaches, allowing researchers to move beyond theoretical disagreements to empirical validation of pipeline performance under controlled conditions.
Experimental Design and Protocols for Mock Community Analysis
Establishing the Ground Truth: Community Construction
The foundation of reliable benchmarking lies in proper mock community design. Essential considerations include:
- Phylogenetic Diversity: Incorporate strains representing broad phylogenetic lineages to test classification across taxonomic boundaries.
- GC Content Variation: Include members with varying GC content to evaluate GC bias in amplification and sequencing [80].
- Abundance Structure: Design communities with staggered or logarithmic abundance distributions to assess quantitative accuracy across abundance ranges [81].
Well-constructed mock communities can be derived from cultured bacterial strains, as demonstrated in a comprehensive analysis using 33 phylogenetically diverse strains [80], or from more complex assemblages of 235 strains for higher-resolution benchmarking [34].
Library Preparation and Sequencing Considerations
Experimental protocols significantly impact downstream error profiles and community representation:
- PCR Amplification Strategy: A two-step PCR method with template-specific primers followed by phasing primers can reduce chimeric sequences by approximately half compared to single-step methods [80].
- GC Bias Mitigation: Recognize that GC content significantly impacts sequence recovery; higher GC content strains typically exhibit higher recovery rates, creating quantitative bias [80].
- Sequencing Platform Selection: Platform choice (Illumina, Ion Torrent, or Nanopore) introduces platform-specific error profiles that must be characterized using mock communities [82] [81].
Diagram 1: Mock Community Analysis Workflow
Rigorous mock community analysis reveals several critical error sources that impact taxonomic fidelity.
Chimera Formation as a Major Artifact Source
Chimeric sequences represent a substantial proportion of sequencing artifacts, with their formation correlated with specific experimental conditions:
- Prevalence: Chimeras accounted for approximately 11% of raw joined sequences in mock community Bm1 with standard PCR methods [80].
- GC Content Correlation: Chimeric formation is significantly correlated with GC content, with low-GC-content community members exhibiting lower chimera formation rates [80].
- Detection Limitations: Approximately 30% of chimeric sequences went undetected when using the UCHIME2 algorithm with the Greengenes database as reference [80].
Sequencing Error Profiles
Error rates vary by sequencing platform and processing methods:
- Platform Differences: Illumina MiSeq platforms typically exhibit substitution-type miscalls resulting primarily from cross-talk between emission spectra of different fluorophores or from phasing during synthesis [80].
- Error Reduction: Quality trimming significantly reduces error rates; for example, two-step phasing joined sequences showed error rates reduced from 0.39% to 0.27% with more stringent trimming (Q30-W2) [80].
- GC-Dependent Errors: Mock communities with different GC compositions showed substantially different error rates, indicating GC content significantly impacts sequencing accuracy [80].
Table 1: Error Rates Across Different Experimental Conditions
| Condition | Chimera Rate | Error Rate (Joined Sequences) | Reduction with Trimming |
|---|---|---|---|
| Non-phasing PCR | ~11% | 0.44% (chimera removed) | 25-39% reduction |
| One-step phasing | ~11% | Similar to non-phasing | Similar to non-phasing |
| Two-step phasing | ~6.5% | 0.39% (chimera removed) | 32% reduction (to 0.27%) |
| Low GC Community | ~3% | Lower than high GC | Varies with stringency |
Amplification and Primer Biases
PCR amplification introduces systematic biases that distort abundance measures:
- GC Content Impact: Strains with higher GC content had higher recovery rates than strains with lower GC content, demonstrating substantial GC bias [80].
- Primer Affinity Effects: Amplification bias occurs due to differences in primer affinity across target sequences, creating unequal representation even from equal starting concentrations [80].
- Quantitative Limitations: The quantitative capacity of targeted amplicon sequencing is notably limited, with substantial recovery variations and weak correlation between anticipated and observed strain abundances [80].
Comparative Performance of OTU vs. ASV Methodologies
Mock community analyses provide empirical evidence for comparing OTU clustering and ASV denoising approaches.
Methodological Differences and Their Implications
The fundamental differences between these approaches yield distinct performance characteristics:
- Resolution: ASV methods detect single-nucleotide differences, providing higher taxonomic resolution but potentially over-splitting true biological sequences [34] [22].
- Error Handling: OTU clustering at 97% similarity consolidates sequencing errors with correct sequences, while ASV methods use error models to distinguish biological variation from technical errors [21].
- Richness Estimation: ASV methods generally provide more accurate estimates of sample richness, especially for high-diversity communities with sufficient sequencing depth [22].
Impact on Diversity Metrics
The choice between OTU and ASV methods significantly influences alpha and beta diversity measures:
- Alpha Diversity: The pipeline choice (OTU vs. ASV) has stronger effects on diversity measures than rarefaction and OTU identity threshold [21].
- Beta Diversity: Presence/absence indices such as richness and unweighted Unifrac show the strongest discrepancies between methods, while weighted metrics show greater congruence [21].
- Rare Biosphere Characterization: Low-abundance taxa (relative abundance < 0.1%) show the greatest methodological discrepancies, requiring careful interpretation when studying rare species [22].
Table 2: OTU vs. ASV Performance Comparison Using Mock Communities
| Performance Metric | OTU Clustering | ASV Denoising | Notes |
|---|---|---|---|
| Richness Estimation | Underestimates in high-diversity samples | More accurate with sufficient depth | [22] |
| Error Incorporation | Clusters errors with true sequences | Attempts to correct errors via model | [21] |
| Taxonomic Resolution | Species/genus level | Potentially strain level | [22] |
| Over-splitting/merging | More over-merging | More over-splitting | [34] |
| Computational Demand | Lower | Higher | Varies by implementation |
| Data Volume | Reduced through clustering | Retains all "biological" variants | [22] |
Diagram 2: OTU vs. ASV Bioinformatics Workflows
Benchmarking Bioinformatics Pipelines for Taxonomic Classification
Comprehensive benchmarking studies using mock communities reveal substantial variation in pipeline performance for taxonomic classification.
16S rRNA Amplicon Analysis Pipelines
Multiple studies have compared popular processing pipelines using mock communities with known compositions:
- DADA2 and UPARSE showed the closest resemblance to the intended microbial community structure, particularly for alpha and beta diversity measures [34].
- Algorithmic Differences: ASV algorithms led by DADA2 produced consistent output but suffered from over-splitting, while OTU algorithms led by UPARSE achieved clusters with lower errors but with more over-merging [34].
- Taxonomic Level Consistency: Analysis at the family level guaranteed both consistency and adequate coverage when using either OTU or ASV methods, while genus-level classifications showed greater methodological divergence [22].
Shotgun Metagenomics Classifiers
For shotgun metagenomic approaches, benchmarking against mock communities reveals distinct performance patterns:
- Performance Categories: Classifiers can be categorized into three groups: low precision/high recall; medium precision/medium recall; and high precision/medium recall, with most tools falling into the first group [81].
- Database Dependence: Classification accuracy is highly dependent on the reference database used, with comprehensiveness and quality representing a critical trade-off [81].
- Platform Considerations: Nanopore long-read data generally produces better taxonomic classification than short-read data, though fewer classifiers are specifically designed for long-read analysis [81].
Table 3: Bioinformatics Pipeline Performance Assessment
| Pipeline/Tool | Method Type | Strengths | Limitations |
|---|---|---|---|
| DADA2 | ASV (Denoising) | High resolution, error correction | Over-splitting tendency |
| UPARSE | OTU (Clustering) | Lower error rate, efficient | Over-merging of similar sequences |
| Deblur | ASV (Denoising) | Similar to DADA2 | Performance varies with dataset |
| MetaPhlAn4 | Shotgun (Profiling) | High accuracy in benchmarks | Dependent on marker database |
| Kraken2 | Shotgun (Classification) | Comprehensive classification | Precision may require filtering |
Successful mock community analysis requires specific reagents and resources with clearly defined functions.
Table 4: Essential Research Reagents and Resources for Mock Community Analysis
| Resource Category | Specific Examples | Function/Application |
|---|---|---|
| Reference Mock Communities | 33-strain phylogenetically diverse community [80]; 235-strain complex community [34] | Ground truth for benchmarking pipeline performance |
| DNA Extraction Kits | Various commercial kits | Standardized nucleic acid isolation with minimal bias |
| PCR Enzymes/Master Mixes | High-fidelity polymerases | Minimize amplification errors during library prep |
| Sequencing Platforms | Illumina MiSeq, Ion Torrent PGM, Oxford Nanopore | Generate raw sequence data with platform-specific error profiles |
| Reference Databases | Greengenes, SILVA, RDP | Taxonomic classification and chimera detection reference |
| Bioinformatics Pipelines | DADA2, USEARCH-UPARSE, QIIME, Mothur | Processing raw sequences into OTUs/ASVs and taxonomic assignments |
| Negative Controls | Nuclease-free water, extraction blanks | Detection of contamination during library preparation |
Mock community analyses represent the gold standard for assessing error rates and taxonomic fidelity in microbial community studies. The empirical data generated through these controlled experiments reveals that methodological choices—particularly the selection between OTU clustering and ASV denoising—fundamentally shape biological interpretations. Chimera formation, GC content biases, and sequencing errors collectively contribute to discrepancies between observed and expected community compositions. As sequencing technologies and bioinformatics algorithms continue to evolve, mock communities will remain essential for validating new methods, optimizing experimental protocols, and ensuring the reliability of microbial community analyses in both basic research and drug development applications. Researchers should select analysis methods based on their specific research questions, recognizing that OTU approaches may provide more conservative estimates for diverse communities, while ASV methods offer higher resolution for distinguishing closely related strains.
In the field of microbial ecology, the analysis of high-throughput marker-gene sequencing data has traditionally relied on Operational Taxonomic Units (OTUs) as the fundamental unit of analysis. OTUs are clusters of sequencing reads that differ by less than a fixed dissimilarity threshold, typically 97%, which was originally chosen to approximate the species cutoff homology boundary [10] [83]. This clustering approach was initially adopted to minimize the effects of sequencing errors by grouping similar sequences into consensus-based units, thereby reducing the impact of rare base-calling errors that could lead to false taxonomic attributions [10]. The three primary methods for generating OTUs include de novo clustering (reference-free, computationally expensive), closed-reference clustering (fast but dependent on reference databases), and open-reference clustering (a hybrid approach) [83].
In contrast, Amplicon Sequence Variants (ASVs) represent a more recent methodological advancement that resolves exact biological sequences from amplicon data without imposing arbitrary dissimilarity thresholds [31]. ASV methods employ error models and statistical inference to distinguish true biological variation from sequencing errors, effectively providing single-nucleotide resolution across the sequenced gene region [10] [31]. Unlike OTUs, which are emergent properties of a dataset with boundaries that depend on the specific data being analyzed, ASVs represent consistent labels with intrinsic biological meaning that can be reproduced across independent studies [31]. This fundamental difference in approach has significant implications for the calculation and interpretation of alpha and beta diversity metrics in microbial community analyses.
Methodological Differences: Computational Approaches and Workflows
OTU Clustering Pipelines
The traditional OTU clustering workflow involves multiple processing steps that ultimately group sequences based on similarity thresholds. In closed-reference OTU clustering, sequences are compared to a reference database, and those sufficiently similar to known reference sequences are recruited into corresponding OTUs [31]. This method is computationally efficient but necessarily discards sequences not represented in the reference database, introducing potential biases against novel taxa [31]. In de novo OTU clustering, sequences are grouped based on pairwise similarities without reference to a database, preserving novel diversity but requiring computationally expensive all-against-all comparisons that scale quadratically with study size [31]. The open-reference approach attempts to balance these tradeoffs by first clustering against a reference database, then clustering the remaining sequences de novo [83].
ASV Inference Pipelines
ASV analysis employs a fundamentally different approach that focuses on error correction and exact sequence variant resolution rather than clustering. Methods such as DADA2 [10] use a parametric error model of the sequencer's run to determine the probability that a given sequence is due to sequencing error [83]. The process involves quality filtering, error rate estimation, sample inference, and chimera removal, resulting in a table of exact sequence variants with statistical confidence [31]. Because ASVs represent biological sequences rather than dataset-specific clusters, they can be independently reproduced across studies and provide consistent labels for comparing results from different research groups [31]. Additionally, ASV inference can be performed on each sample independently, allowing computational requirements to scale linearly with sample number rather than quadratically as with de novo OTU methods [31].
Visual Comparison of Bioinformatics Workflows
The diagram below illustrates the key computational differences between OTU clustering and ASV inference workflows:
Impact on Alpha Diversity Metrics
Fundamental Concepts of Alpha Diversity
Alpha diversity describes the diversity within a single sample or ecosystem, measuring both the number of different species present (richness) and how evenly individuals are distributed among those species (evenness) [84] [85]. Common alpha diversity metrics include species richness (simple count of distinct taxa), Shannon Index (combining richness and evenness), Simpson Index (emphasizing dominant species), and Faith's Phylogenetic Diversity (incorporating evolutionary relationships) [84] [85] [86]. These metrics provide crucial insights into ecosystem health, with higher alpha diversity generally indicating more robust, resilient ecosystems [84].
Comparative Effects of OTU vs. ASV Methods
The choice between OTU and ASV methods significantly impacts alpha diversity estimates. OTU clustering at 97% identity systematically reduces apparent alpha diversity by grouping similar but distinct sequences into single units [10]. This clustering effect leads to marked underestimation of ecological indicators for species diversity and distorts the behavior of dominance and evenness indexes compared to ASV-based analysis [10]. The theoretical extent of this underestimation can be substantial: for 100-nucleotide reads clustered at 97% identity, an OTU could contain up to 64 variant combinations (4³), effectively masking this hidden diversity [10]. With typical Illumina reads of 200-300 nucleotides, the potential for underestimation increases exponentially.
Table 1: Comparison of Alpha Diversity Metrics Between OTU and ASV Approaches
| Alpha Diversity Metric | OTU-based Approach | ASV-based Approach | Key Differences |
|---|---|---|---|
| Species Richness | Lower due to clustering of similar sequences | Higher due to single-nucleotide resolution | ASV reveals 10-64× more variants for similar data [10] |
| Shannon Index | Underestimated due to reduced apparent richness | More accurate representation of true diversity | Better discrimination of ecological patterns [31] |
| Simpson Index | Distorted dominance patterns | More accurate evenness measurement | Better reflects actual community structure [10] |
| Phylogenetic Diversity | Limited by reference database completeness | Incorporates novel diversity without reference bias | More comprehensive evolutionary representation [31] |
| Rare Taxa Detection | Higher rate of spurious OTUs [83] | Better differentiation of true rare variants | DADA2 particularly sensitive to low-abundance sequences [83] |
Experimental Evidence from Comparative Studies
Research directly comparing OTU and ASV approaches on the same datasets demonstrates consistent patterns in alpha diversity discrepancies. A 2024 study analyzing 16S metabarcoded bacterial amplicons across 17 adjacent habitats found that OTU clustering at both 99% and 97% identity proportionally led to marked underestimation of ecological indicators for species diversity compared to ASV-based analysis [10]. The study examined a 700-meter-long transect encompassing cropland, meadows, forest, and coastal areas, providing a robust biodiversity gradient for comparison [10]. Multivariate ordination analyses further demonstrated sensitivity to bioinformatics methods in terms of tree topology and coherence, with ASV-based approaches providing more biologically realistic patterns [10].
Impact on Beta Diversity Metrics
Fundamental Concepts of Beta Diversity
Beta diversity (β-diversity) measures the difference in species composition between ecosystems or samples, quantifying how species diversity changes from one habitat to another [87] [88]. It represents the ratio between regional (gamma) and local (alpha) species diversity, effectively capturing species turnover across spatial or environmental gradients [87]. Common beta diversity metrics include Bray-Curtis dissimilarity (abundance-weighted), Jaccard distance (presence-absence based), and UniFrac (phylogenetically informed) [88]. These metrics enable researchers to compare community structures across different environments and identify drivers of biodiversity patterns [88].
Comparative Effects of OTU vs. ASV Methods
The resolution difference between OTUs and ASVs profoundly influences beta diversity measurements and subsequent ecological interpretations. ASV-based analyses typically reveal greater compositional heterogeneity between samples because they preserve single-nucleotide differences that OTU clustering would obscure [10]. This enhanced resolution can lead to different ecological conclusions, as demonstrated by studies reporting that alternative pipelines yielded community compositions differing by 6.75% to 10.81% [10]. The consistent labeling property of ASVs enables more reliable cross-study comparisons and meta-analyses, as the same biological sequence will always generate the same ASV regardless of the study context [31].
Table 2: Comparison of Beta Diversity Metrics Between OTU and ASV Approaches
| Beta Diversity Aspect | OTU-based Approach | ASV-based Approach | Ecological Interpretation Impact |
|---|---|---|---|
| Compositional Dissimilarity | Lower apparent differentiation between samples | Higher discrimination of sample differences | ASV reveals finer ecological gradients [10] |
| Cross-study Comparison | Limited to same reference database or reprocessing | Directly comparable through consistent labels | Enables robust meta-analyses [31] |
| Reference Database Bias | High for closed-reference methods | Minimal to none | ASV captures novel diversity without reference dependency [31] |
| Rare Species Contribution | Either omitted or spuriously inflated | Statistically validated rare variants | More accurate turnover measurements [83] |
| Multivariate Ordination | Less distinct clustering patterns | Sharper separation of ecological groups | Better discrimination of environmental drivers [10] |
Experimental Evidence from Comparative Studies
Comparative research demonstrates that beta diversity patterns shift significantly depending on whether OTU or ASV methods are employed. The previously mentioned 2024 study examining bacterial communities across 17 habitats found that multivariate ordination analyses were sensitive to the choice of bioinformatics method, resulting in different tree topologies and coherence measures [10]. Similarly, other researchers have reported that community compositions derived from the same underlying data differed between 6.75% and 10.81% when processed through alternative OTU versus ASV pipelines [10]. These differences directly impact ecological interpretations, particularly for studies seeking to identify environmental drivers of community composition or assess responses to perturbations.
Experimental Protocols for Method Comparison
Standardized Workflow for Method Evaluation
Researchers comparing OTU and ASV approaches should implement standardized processing workflows to ensure fair comparisons. For OTU clustering, the QIIME2 platform offers comprehensive pipelines for both closed-reference and de novo methods, typically using a 97% similarity threshold [86]. For ASV inference, DADA2 implemented within QIIME2 or the DEBLUR workflow provide robust error modeling and variant calling [86]. Crucial preprocessing steps include quality filtering based on quality scores, read truncation where appropriate, and chimera removal [86]. To enable valid diversity comparisons, data should be rarefied to equivalent sequencing depths, particularly when library sizes vary substantially (e.g., >10x difference) [86].
Alpha and Beta Diversity Calculation Protocols
Following generation of feature tables (OTU or ASV), diversity metrics should be calculated using standardized approaches. For alpha diversity, multiple metrics should be computed including observed features (richness), Shannon index (richness and evenness), Simpson index (dominance-weighted), and Faith's Phylogenetic Diversity when phylogenetic trees are available [86]. For beta diversity, Bray-Curtis dissimilarity, Jaccard distance, and UniFrac distances (weighted and unweighted) provide complementary perspectives on compositional differences [88] [86]. Statistical assessment of group differences can be performed using PERMANOVA (adonis) for beta diversity and Kruskal-Wallis tests for alpha diversity comparisons across metadata categories [86].
Visualization and Statistical Analysis
Effective comparison of OTU versus ASV impacts requires appropriate visualization and statistical analysis. Alpha diversity should be visualized using boxplots grouped by experimental factors, with statistical significance assessed using non-parametric tests when normality assumptions are violated [85] [86]. Beta diversity patterns are best visualized through ordination methods such as Principal Coordinates Analysis (PCoA) with points colored by experimental groups [88]. Statistical significance of group separations in beta diversity space can be tested using PERMANOVA with appropriate permutation schemes [88]. Additionally, rarefaction curves should be examined to ensure adequate sampling depth and to determine appropriate rarefaction levels for diversity analyses [86].
The Scientist's Toolkit: Essential Research Reagents and Computational Tools
Table 3: Essential Tools and Reagents for OTU/ASV Diversity Analysis
| Tool/Reagent | Category | Function/Purpose | Key Considerations |
|---|---|---|---|
| QIIME 2 [86] | Computational Platform | End-to-end microbiome analysis pipeline | Supports both OTU clustering and ASV inference workflows |
| DADA2 [10] | R Package | ASV inference via error modeling | Particularly sensitive for low-abundance sequences [83] |
| SILVA Database | Reference Database | Curated 16S rRNA reference sequences | Essential for closed-reference OTU picking and taxonomy assignment |
| Greengenes | Reference Database | 16S rRNA gene database | Alternative reference for taxonomy assignment |
| ZymoBIOMICS Standards [83] | Wet Lab Reagent | Microbial community standards for validation | Enables accuracy assessment of OTU/ASV methods |
| Illumina MiSeq | Sequencing Platform | High-throughput amplicon sequencing | Standard for 16S rRNA and ITS marker gene studies |
| PacBio Sequel | Sequencing Platform | Long-read sequencing for full-length markers | Enables better phylogenetic resolution for complex regions like ITS |
| q2-kmerizer [89] | Computational Tool | k-mer-based diversity estimation | Reference-free alternative to phylogenetic metrics |
The methodological choice between OTUs and ASVs significantly impacts the calculation and interpretation of both alpha and beta diversity metrics in microbial ecology studies. Evidence consistently demonstrates that ASV-based approaches provide higher resolution diversity estimates, better discrimination of ecological patterns, and improved comparability across studies due to consistent labeling properties [10] [31]. While OTU clustering remains a valid approach for specific applications with well-characterized microbial communities and established reference databases, ASV methods generally offer superior performance for detecting novel diversity, differentiating closely related taxa, and enabling reproducible, cross-study comparisons [31] [83].
For researchers designing microbiome studies, current evidence supports adopting ASV-based methods as the standard for diversity analyses, particularly when investigating environments with potentially novel taxa or when rare variants are of ecological interest [10] [31]. However, methodological choices should align with specific research questions, as OTU approaches may still be appropriate for large-scale population studies focusing on well-characterized body sites like the human gut [83]. Regardless of the chosen method, researchers should clearly report bioinformatics parameters, employ multiple diversity metrics, and validate findings with appropriate statistical approaches to ensure robust ecological conclusions.
The analysis of microbial communities through marker gene amplicon sequencing has become a cornerstone of modern microbial ecology. Within this field, a central challenge persists: determining the optimal level of taxonomic resolution for deriving meaningful biological insights. This technical guide examines the critical trade-offs between genus-level and species-level analyses, framing this discussion within the broader methodological context of Operational Taxonomic Units (OTUs) and Amplicon Sequence Variants (ASVs). The choice between these resolutions carries significant implications for data interpretation, ecological inference, and downstream applications in research and drug development.
Advances in sequencing technologies and bioinformatic pipelines have facilitated a methodological shift from traditional OTU clustering to denoising methods that resolve ASVs. While ASVs theoretically provide single-nucleotide resolution, often interpreted as approximating species-level taxonomy, practical considerations including intragenomic ribosomal heterogeneity, sequencing errors, and analytical constraints complicate this straightforward equivalence. This review synthesizes current evidence to provide a structured framework for selecting appropriate taxonomic levels based on specific research objectives, sample types, and analytical requirements.
Fundamental Concepts: OTUs, ASVs, and Taxonomic Assignment
Operational Taxonomic Units (OTUs) vs. Amplicon Sequence Variants (ASVs)
Operational Taxonomic Units (OTUs) are clusters of sequencing reads grouped based on a predefined sequence similarity threshold, traditionally 97% for bacterial 16S rRNA gene sequences, which is intended to approximate species-level classification [90]. This approach reduces computational burden and mitigates sequencing errors by clustering similar sequences, but at the cost of potentially obscuring biologically meaningful variation [21].
Amplicon Sequence Variants (ASVs) are generated by denoising algorithms that distinguish true biological sequences from sequencing errors, resulting in units resolved by single-nucleotide differences without applying arbitrary similarity thresholds [90]. Proponents argue that ASVs provide greater precision, reproducibility, and cross-study comparability [90] [21].
The methodological choice between OTUs and ASVs directly influences subsequent taxonomic classification. ASVs' finer resolution inherently suggests potential for more precise species-level identification, but this advantage is tempered by biological and technical constraints discussed in subsequent sections.
Taxonomic Classification Levels
In microbial ecology, taxonomic classification follows a hierarchical structure:
- Phylum: Broadest taxonomic level, useful for characterizing major phylogenetic shifts.
- Class/Order: Intermediate levels often capturing functional shifts.
- Family: Consistently demonstrates strong congruence with finer resolutions [91] [92].
- Genus: Balance of specificity and reliability; many named genera have established ecological roles.
- Species: Finest practical resolution; theoretically ideal but often complicated by reference database limitations and intragenomic variation.
Table 1: Key Characteristics of Genus-Level vs. Species-Level Analysis
| Characteristic | Genus-Level Analysis | Species-Level Analysis (OTUs/ASVs) |
|---|---|---|
| Taxonomic Resolution | Coarser (group of species) | Finer (theoretically single species/variant) |
| Bioinformatic Complexity | Lower | Higher |
| Reference Database Completeness | Higher | Variable, often incomplete |
| Sensitivity to Sequencing Errors | Lower (buffered by clustering) | Higher (requires sophisticated denoising) |
| Risk of Intragenomic Splitting | Lower | Substantially higher [51] |
| Community Coverage in Analysis | Higher (≥96% sequences) [93] | Lower (as low as 28% sequences) [93] |
| Cross-Study Comparability | Moderate | Higher with ASVs [90] |
| Detection of Ecological Patterns | Generally robust [91] [92] [94] | Potentially confounded by over-splitting [51] |
Comparative Analytical Performance
Detection of Ecological Patterns and Stressor Responses
Research across diverse ecosystems indicates that genus-level analysis frequently captures ecological patterns with effectiveness comparable to species-level approaches. In freshwater wetland invertebrates, family-level (a closely related coarse resolution) data showed significant congruence with finer-level resolution for describing community structure patterns, including richness, equitability, and beta diversity [92] [94]. Similarly, a study on stream benthic bacteria under multiple agricultural stressors found that order-level responses were generally representative of corresponding genus and species-level responses, suggesting this intermediate level provides an optimal compromise [93].
The pervasiveness of stressor detection—the ability to identify significant effects of environmental perturbations—remains remarkably consistent across taxonomic levels. In the stream mesocosm experiment, the nitrification inhibitor DCD was the most pervasive stressor, affecting 6 phyla, 16 orders, 19 genera, and 14 species, demonstrating that broad-scale patterns are detectable even at higher taxonomic levels [93]. Similar findings emerged from shrimp microbiota research, where organ (hepatopancreas vs. intestine) and environmental (pond) variations were detectable regardless of using OTUs or ASVs [91].
Statistical Power and Community Coverage
A critical trade-off emerges between taxonomic resolution and community coverage in statistical analyses. As resolution increases from phylum to species level, the proportion of the community classified as "rare" increases substantially, reducing the number of taxa available for robust statistical testing. In the stream bacteria study, community coverage decreased from 96% of all sequences for abundant phyla to just 28% for species-level OTUs [93]. This coverage reduction necessarily constrains the statistical power for detecting community-wide patterns at finer taxonomic resolutions.
Table 2: Methodological Recommendations Based on Research Objectives
| Research Objective | Recommended Taxonomic Level | Rationale | Supporting Evidence |
|---|---|---|---|
| Broad Ecological Patterns | Family/Order | Maintains community coverage while detecting major shifts | [92] [94] |
| Multiple-Stressor Detection | Order/Genus | Optimal sensitivity-coverage tradeoff | [93] |
| Cross-Study Comparisons | ASVs (any level) | Superior reproducibility | [90] |
| Microbiome-Based Prediction | Genus-level with tree-based ML | Balanced accuracy and interpretability | [95] |
| Rapid Bioassessment | Family | Cost-effective with preserved ecological signals | [92] [94] |
| Strain-Level Differentiation | ASVs (with caution) | Maximum resolution despite splitting risk | [96] [51] |
Technical Considerations and Limitations
Intragenomic Heterogeneity and Splitting Artifacts
A fundamental challenge for species-level analysis arises from intragenomic variation in the 16S rRNA gene. Most bacterial genomes contain multiple rRNA operons with sequence variation that can be substantial enough to generate separate ASVs or OTUs from a single genome [51]. Analysis of 20,427 bacterial genomes revealed an average of 0.58 unique full-length 16S sequences per rRNA copy, meaning a typical Escherichia coli genome (with 7 copies) generates approximately 5 distinct ASVs [51].
This intragenomic variation necessitates careful interpretation of species-level data. To cluster 16S sequences from the same genome with 95% confidence for organisms with 7 rRNA copies (like E. coli), a distance threshold of approximately 5.25% is required—substantially higher than the traditional 3% species-level threshold [51]. This finding challenges the biological validity of distinguishing ASVs separated by only single-nucleotide differences, as they may represent intragenomic variation rather than distinct biological entities.
Methodological Artifacts and Data Processing Effects
The choice between OTUs and ASVs introduces methodological artifacts that can disproportionately affect species-level inferences. Studies demonstrate that the pipeline choice (OTU vs. ASV) has stronger effects on diversity measures than other analytical decisions like rarefaction depth or OTU identity threshold [21]. These effects are particularly pronounced for presence/absence metrics such as richness and unweighted UniFrac, suggesting species-level presence/absence data may be especially susceptible to pipeline-specific artifacts.
Interestingly, the discrepancy between OTU and ASV-based diversity metrics can be attenuated through rarefaction, highlighting how data processing decisions interact with taxonomic resolution choices [21]. Researchers should therefore maintain consistency in bioinformatic pipelines when making cross-study comparisons, particularly for species-level analyses.
Experimental Protocols and Methodological Guidelines
Recommended Workflow for Taxonomic Resolution Selection
The following diagram illustrates a systematic approach for selecting appropriate taxonomic levels based on research goals and sample characteristics:
Wet-Lab Protocol for Cross-Study Comparisons
For research requiring cross-study comparisons or long-term reproducibility, the following full-length 16S rRNA gene amplification protocol provides high-quality data compatible with both genus and species-level analysis:
- Primer Design: Use universal primers 27F (AGRGTTYGATYMTGGCTCAG) and 1492R (RGYTACCTTGTTACGACTT) for full-length amplification [96].
- Library Preparation: Perform PCR amplification with KAPA HiFi Hot Start DNA Polymerase (20 cycles: 95°C denaturation for 30s, 57°C annealing for 30s, 72°C extension for 60s) [96].
- Quality Control: Verify amplification success and size distribution using Bioanalyzer or similar platform [91] [96].
- Sequencing: Utilize PacBio circular consensus sequencing (CCS) to achieve high accuracy for full-length reads [96].
This approach, when combined with DADA2 denoising, can achieve near-zero error rates while capturing the complete 16S gene, enabling both broad taxonomic classification and fine-scale variant analysis [96].
Bioinformatic Processing Pipeline
A robust bioinformatic workflow should incorporate the following steps to ensure appropriate taxonomic resolution:
- Sequence Processing: Use DADA2 for quality filtering, error correction, and ASV inference, or VSEARCH for OTU clustering at multiple thresholds (97%, 99%) [91] [21].
- Chimera Removal: Apply consensus-based chimera detection and removal against reference databases [91].
- Taxonomic Assignment: Use SILVA or Greengenes databases with appropriate classifiers (RDP, IDTAXA) [91] [95].
- Data Filtering: Implement abundance-based filters (e.g., retain clusters >0.1% of total abundance per sample) to improve taxonomic comparability while preserving >94% of reads [91].
- Multi-Level Analysis: Generate taxonomic tables at phylum, family, genus, and species levels for comparative assessment.
The Scientist's Toolkit: Essential Research Reagents and Materials
Table 3: Key Research Reagent Solutions for Taxonomic Resolution Studies
| Reagent/Kit | Primary Function | Application Note |
|---|---|---|
| ZymoBIOMICS Microbial Community DNA Standard | Mock community for validation | Contains 8 bacterial strains with known composition; validates taxonomic classification accuracy [96] |
| MO Bio PowerFecal DNA Extraction Kit | DNA extraction from complex samples | Optimized for difficult samples; automated version available for high-throughput studies [96] |
| KAPA HiFi HotStart DNA Polymerase | High-fidelity PCR amplification | Critical for full-length 16S amplification with minimal errors [96] |
| PacBio SMRTbell Express Template Prep Kit | Library preparation for long-read sequencing | Enables full-length 16S rRNA gene sequencing [96] |
| Illumina MiSeq Reagent Kits (v2/v3) | Short-read amplicon sequencing | Suitable for hypervariable region sequencing (V3-V4, V4) [95] [93] |
| QIIME2 Platform | Integrated bioinformatic analysis | Comprehensive pipeline for both OTU and ASV analysis [91] [95] |
| DADA2 R Package | Denoising and ASV inference | Superior error modeling for exact sequence variants [91] [96] |
| Greengenes/SILVA Databases | Taxonomic reference | Curated 16S databases for classification at all taxonomic levels [91] |
The choice between genus-level and species-level analysis represents a fundamental trade-off between analytical resolution and ecological interpretability. While species-level approaches using ASVs offer superior resolution for specific applications, genus-level analysis frequently preserves essential ecological patterns with reduced computational complexity and methodological artifacts.
For most experimental scenarios involving complex microbial communities, a tiered approach is recommended: initial analysis at genus level to identify broad patterns, followed by targeted species-level investigation of key taxa of interest. This strategy balances the need for comprehensive community assessment with the capacity for high-resolution analysis where biologically justified. As reference databases expand and bioinformatic methods mature, the potential for robust species-level characterization will continue to improve, but genus-level analysis remains a powerful, efficient approach for many research questions in microbial ecology and drug development.
The analysis of microbial communities through marker gene sequencing, most commonly the 16S rRNA gene, is a cornerstone of modern microbial ecology [97] [74]. The certainty of results, independent of bioinformatic handling, is imperative for any scientific advances within the field, including drug development and ecosystem monitoring [97] [76]. Historically, this analysis has relied on Operational Taxonomic Units (OTUs), which cluster sequences based on a percent identity threshold (typically 97%) [1] [22]. However, a methodological shift is underway toward Amplicon Sequence Variants (ASVs), which are exact sequence variants inferred through error-correction algorithms rather than clustering [19] [1]. This technical guide explores how the fundamental choice between OTU and ASV-based bioinformatic pipelines directly influences the downstream ecological patterns and statistical conclusions drawn from microbiome data, with significant implications for research reproducibility and interpretation.
Fundamental Methodological Differences Between OTU and ASV Approaches
The distinction between OTUs and ASVs originates from fundamentally different principles for handling sequencing data and distinguishing biological signal from technical noise.
Operational Taxonomic Units (OTUs)
The OTU approach groups, or clusters, sequencing reads that are sufficiently similar to one another based on a predefined sequence identity threshold [1] [22]. The most common threshold is 97% similarity, a historical convention intended to approximate the species-level boundary in bacteria [10] [21]. This process results in consensus sequences that represent the centroids of their respective clusters. A key limitation is that OTUs are internally generated and analysis-specific, lacking direct comparability across different studies [97] [76]. Comparisons must be made indirectly via cross-referencing with databases (e.g., SILVA, Greengenes), which typically limits robust comparisons to the genus level at best [76].
Amplicon Sequence Variants (ASVs)
In contrast, ASV methods use a denoising process to distinguish true biological sequences from those generated by sequencing errors [21] [1]. These algorithms employ a parametric error model of the sequencing run to correct errors and identify exact biological sequences, providing single-nucleotide resolution [10] [19]. Because ASVs represent actual biological sequences, they function as consistent labels that are directly comparable across different studies and laboratories, facilitating meta-analyses and improving reproducibility [19].
Table 1: Core Conceptual and Practical Differences Between OTUs and ASVs
| Feature | Operational Taxonomic Units (OTUs) | Amplicon Sequence Variants (ASVs) |
|---|---|---|
| Definition | Clusters of sequences with a similarity threshold (e.g., 97%) [1] [22] | Exact, error-corrected biological sequences [1] |
| Resolution | Approximate (species-level or higher) [10] | Single-nucleotide [1] |
| Error Handling | Averages out errors via clustering [1] | Corrects errors using a sequencing error model [10] [21] |
| Comparability | Study-specific; difficult to compare directly [97] [19] | Consistent labels; directly comparable across studies [19] |
| Dependence | Dependent on the dataset or a reference database [19] | Independent of references; captures novel diversity [19] |
| Computational Cost | Generally less demanding [1] | More computationally intensive [1] |
Figure 1: A simplified workflow comparing the key steps in OTU-clustering and ASV-denoising pipelines. The fundamental difference lies in how they process sequences after initial quality filtering, leading to different data units for downstream analysis.
Experimental Protocols for Comparative Studies
To objectively assess the impact of pipeline choice, researchers have employed controlled experimental designs, ranging from mock communities to complex environmental samples.
Protocol 1: Analysis with a Mock Microbial Community
Objective: To validate the sensitivity, specificity, and accuracy of OTU and ASV pipelines using a community of known composition [22].
Materials:
- Mock Community: Comprising a defined set of bacterial strains with known 16S rRNA gene sequences. For example, a pool of 254 bacterial isolates from a culture collection [22].
- DNA Extraction & Sequencing: Standardized DNA extraction from the pooled biomass, followed by amplification of a target hypervariable region (e.g., V3-V4) and sequencing on an Illumina MiSeq platform [22].
Methodology:
- Sequence Processing: Process the raw sequencing data through two parallel pipelines.
- Benchmarking: Compare the resulting OTU and ASV tables against the expected composition of the mock community.
- Metrics: Calculate the number of true positives (correctly identified strains), false positives (spurious units), and false negatives (missed strains). Assess the accuracy of taxonomic assignment at different taxonomic levels [22].
Protocol 2: Comparison Using Complex Environmental Samples
Objective: To evaluate how pipeline choice influences ecological conclusions in real-world, high-diversity samples [10] [21].
Materials:
- Environmental Samples: A dataset encompassing multiple microbial assemblages. For instance, a study may use freshwater invertebrate gut microbiomes, sediment, and seston (particle-associated communities) sampled from multiple rivers [21].
- Metadata: Detailed information about sample types, collection sites, and environmental conditions.
Methodology:
- Parallel Processing: As in Protocol 1, process the entire environmental dataset through both OTU and ASV pipelines.
- Ecological Analysis: From the resulting feature tables, calculate a suite of alpha and beta diversity indices.
- Statistical Comparison: Test for significant differences in diversity metrics between pipelines and for the strength of ecological signals (e.g., differences between sample types or correlation with environmental variables) within each pipeline's results [21].
Quantitative Impact on Diversity Metrics and Ecological Interpretation
The choice of bioinformatic method is not a neutral pre-processing step; it quantitatively and qualitatively alters the resulting data, which can subsequently change biological interpretation.
Effects on Alpha Diversity
Alpha diversity, which measures the diversity within a single sample, is highly sensitive to the analysis pipeline. ASV methods, with their higher resolution, typically detect a greater number of unique sequence variants compared to OTU clustering [10]. One study on a coastal gradient found that OTU clustering led to a "marked underestimation" of ecological indicators for species diversity and distorted the behavior of dominance and evenness indexes compared to ASVs [10]. Theoretically, for 100-nucleotide reads clustered at 97% identity, an OTU could contain up to 64 (4^3) different sequence combinations, meaning diversity could be underestimated by up to 64-fold [10].
Effects on Beta Diversity
Beta diversity, which measures differences in community composition between samples, is also affected. A study on freshwater mussel microbiomes found that the pipeline choice significantly influenced beta diversity and changed the ecological signal detected, especially for presence/absence indices like richness and unweighted Unifrac [21]. Furthermore, the overall community composition derived from the same raw data can differ significantly. A comparative study of wastewater treatment plant systems found that the two approaches delivered community compositions that differed by 6.75% to 10.81% between pipelines [97] [74] [76]. These pipeline-dependent differences in taxonomic assignment can directly interfere with downstream analyses, such as network analysis or predictions of ecosystem service [97].
Table 2: Summary of Quantitative Differences Reported in Comparative Studies
| Study Context | Reported Quantitative Difference | Impact on Ecological Conclusion |
|---|---|---|
| WWTP Systems [97] [76] | Community compositions differed by 6.75% - 10.81% between OTU (VSEARCH) and ASV (DADA2) pipelines. | Different taxonomic assignments could lead to different conclusions in network analysis or ecosystem service predictions. |
| Freshwater Mussel Microbiomes [21] | The choice of pipeline had a stronger effect on alpha/beta diversity measures than rarefaction or OTU identity threshold (97% vs. 99%). | Altered the ecological signal detected, especially for presence/absence indices. |
| Coastal Habitat Gradient [10] | OTU clustering led to a marked underestimation of diversity indices. | Distorted behavior of dominance and evenness indexes; multivariate ordination topology was also affected. |
| Soil and Plant Microbiomes [22] | ASV method outperformed OTU method in estimating community richness and diversity when sequencing depth was sufficient. | The method chosen affected the number of detected differentially abundant families upon treatment. |
The following table details key reagents, software, and databases essential for conducting comparative analyses of OTUs and ASVs.
Table 3: Key Research Reagents and Computational Tools
| Item Name | Type/Category | Brief Function and Application |
|---|---|---|
| DADA2 [21] [19] | Software Pipeline (R Package) | An ASV-based inference pipeline that uses a parametric error model to resolve exact sequence variants from amplicon data. |
| VSEARCH/USEARCH [97] [22] | Software Tool | A versatile tool for processing sequencing data, capable of performing reference-based and de novo OTU clustering. |
| MOTHUR [21] [16] | Software Pipeline | A comprehensive, open-source software package for analyzing microbial ecology data, often used for OTU clustering. |
| SILVA Database [97] [22] | Reference Database | A curated, comprehensive database of aligned ribosomal RNA gene sequences used for taxonomic classification. |
| Illumina MiSeq [97] [21] | Sequencing Platform | A widely used next-generation sequencing platform for generating high-throughput amplicon sequencing data (e.g., 2x300 bp paired-end reads). |
| Soil DNA Isolation Kit (e.g., Norgen) [74] [76] | Laboratory Reagent | A commercial kit optimized for extracting high-quality microbial DNA from complex environmental samples like soil and sludge. |
Figure 2: The cascade of effects from the initial bioinformatic choice to the final ecological conclusion. The decision to use OTUs (blue) or ASVs (red) directly impacts the resulting data structure, which in turn shapes the biological interpretation.
The body of evidence demonstrates that the choice between OTUs and ASVs is not merely a technicality but a fundamental analytical decision with profound effects on downstream ecological and statistical conclusions. While both pipelines can provide broadly comparable results in some instances, they consistently differ in their resolution, estimation of diversity, and ability to detect fine-scale patterns [97] [21]. The higher resolution, reproducibility, and cross-study comparability offered by ASVs are causing a paradigm shift in the field, making them the increasingly preferred standard for new studies [19] [1]. Researchers must therefore be fully aware of these influences, clearly report their chosen methods, and exercise caution when comparing results derived from different bioinformatic pipelines. For any research aiming for high resolution, reproducibility, and integration into future meta-analyses, ASV-based methods are recommended.
The analysis of marker-gene amplicon sequencing data, a cornerstone of modern microbial ecology, has undergone a significant methodological shift. For years, the field relied on clustering sequences into Operational Taxonomic Units (OTUs) based on a fixed similarity threshold, typically 97% [21] [14]. Recently, however, Amplicon Sequence Variants (ASVs) have emerged as a powerful alternative, resolving sequences at the single-nucleotide level without applying arbitrary clustering thresholds [19] [20]. This transition has sparked intense debate and rigorous benchmarking efforts to compare the performance, strengths, and weaknesses of these two approaches. Framed within the broader thesis of understanding OTU and ASV research, this synthesis aims to distill current evidence from independent benchmarking studies. By integrating findings on accuracy, ecological inference, and technical performance, this review provides a definitive guide for researchers, scientists, and drug development professionals navigating the complexities of microbiome data analysis.
Core Conceptual and Methodological Differences
The fundamental difference between OTUs and ASVs lies in their approach to handling biological sequence data and the sequencing errors inherent to high-throughput technologies.
OTU (Operational Taxonomic Unit) Method: This traditional approach groups, or clusters, sequencing reads based on a predefined sequence similarity identity threshold, most commonly 97% [21] [20] [14]. This process assumes that sequences differing by less than this threshold likely represent the same biological taxon, and that sequencing errors will be merged with the correct biological sequences. The clustering process results in a consensus sequence for each OTU, which serves as the representative for all reads in that cluster. Common algorithms for generating OTUs include
MOTHURandUPARSE[16] [21].ASV (Amplicon Sequence Variant) Method: In contrast, ASV methods use a denoising process. Instead of clustering, they employ statistical models to correct sequencing errors, inferring the true biological sequences in the original sample [19] [20] [14]. This approach distinguishes biological sequences that differ by as little as a single nucleotide, providing single-nucleotide resolution. A key advantage of ASVs is their status as consistent labels; they represent a biological reality that exists independently of the dataset being analyzed, making them directly comparable across different studies [19].
DADA2is a widely used algorithm for ASV inference [16] [20].
The following diagram illustrates the fundamental workflow differences between these two approaches.
Recent benchmarking studies, utilizing mock microbial communities of known composition, have provided a ground truth for objectively evaluating the performance of OTU and ASV methods. The table below synthesizes quantitative findings on their performance across critical metrics.
Table 1: Performance Comparison of OTU vs. ASV Methods from Benchmarking Studies
| Performance Metric | OTU Method Performance | ASV Method Performance | Key Supporting Evidence |
|---|---|---|---|
| Error Rate & Accuracy | Higher error rates; achieves clusters with lower errors but with more over-merging of distinct biological sequences [48]. | Lower error rates; sensitive yet can suffer from over-splitting of a single strain into multiple ASVs [48]. | Analysis of a 227-strain mock community showed ASV algorithms like DADA2 had consistent output, while OTU algorithms like UPARSE had lower errors but more over-merging [48]. |
| Richness Estimation (Alpha Diversity) | Often overestimates bacterial richness compared to ASVs [21] [14]. | Provides more accurate and consistent estimates of richness; over-splitting can inflate counts but is less severe than OTU overestimation [48] [21]. | In environmental samples, the choice of pipeline significantly influenced alpha diversity, with discrepancies attenuated by rarefaction [21] [14]. |
| Community Differentiation (Beta Diversity) | Beta diversity estimates are generally congruent with those from ASV methods, especially for presence/absence indices [21] [14]. | Provides similar beta diversity patterns to OTUs; ecological signals and group separations are generally consistent [21] [14]. | Studies on soil, rhizosphere, and human microbiomes found similar overall biological signals and beta diversity estimates between methods [14]. |
| Computational Efficiency | De novo OTU clustering requires all data to be pooled, leading to computation times that scale quadratically with study size [19]. | Trivially parallelizable by sample; computation time scales linearly with sample number, enabling analysis of arbitrarily large datasets [19]. | ASV inference with DADA2 was found to be more computationally efficient and manageable for large sample sets compared to MOTHUR [16] [19]. |
| Cross-Study Comparison | OTUs are emergent features of a specific dataset; labels are not consistent, making direct comparison between independent studies difficult or invalid [19]. | ASVs are consistent labels with intrinsic biological meaning, allowing for simple merging of datasets and direct replication of findings across studies [19]. | The consistent labeling of ASVs grants them the combined advantages of closed-reference and de novo OTUs, greatly improving reusability and reproducibility [19]. |
Detailed Experimental Protocols from Benchmarking Studies
To ensure the reproducibility of benchmarking efforts, it is essential to document the experimental and bioinformatics protocols used in key studies. The following section details the methodologies employed in recent, comprehensive comparisons.
Protocol 1: Benchmarking with a Complex Mock Community
This protocol, derived from a 2025 study, utilizes the most complex mock community to date to provide a high-resolution ground truth [48] [34].
- Mock Community Composition: The benchmark used the HC227 mock community, comprising genomic DNA from 227 bacterial strains belonging to 197 different species [48].
- Sequencing Library Preparation:
- Target Region: V3–V4 hypervariable region of the 16S rRNA gene.
- Primers: Forward (5'-CCTACGGGNGGCWGCAG-3') and Reverse (5'-GACTACHVGGGTATCTAATC-3').
- Platform: Illumina MiSeq, 2 × 300 bp paired-end run [48].
- Bioinformatics Processing:
- Preprocessing: Primer sequences were stripped using
cutPrimers, and paired-end reads were merged usingUSEARCH. Quality filtration discarded reads with ambiguous characters and optimized the maximum expected error rate [48]. - Subsampling: Mock samples were subsampled to 30,000 reads per sample to standardize sequencing depth across analyses [48].
- Algorithm Comparison: The study compared eight different algorithms: DADA2, Deblur, MED, UNOISE3 (ASV methods), and UPARSE, DGC, AN, and Opticlust (OTU methods) under unified preprocessing steps to ensure an objective comparison [48].
- Preprocessing: Primer sequences were stripped using
Protocol 2: Comparative Analysis of Environmental Microbiomes
This protocol focuses on comparing methodological effects on ecological patterns in real-world environmental samples [21] [14].
- Sample Collection and DNA Extraction:
- Sequencing Library Preparation:
- Target Region: V4 region of the 16S rRNA gene.
- Primers: Dual-indexed barcoded primers from Kozich et al. (2013).
- Platform: Illumina MiSeq [14].
- Bioinformatics Pipelines:
- OTU-based Pipeline: Processed using
MOTHUR v1.8.0, following the standard MiSeq SOP. Sequences were clustered into OTUs at both 97% and 99% identity thresholds using theSilva 16S rRNA gene database v.138for alignment and classification [14]. - ASV-based Pipeline: Processed using the
DADA2 R-package v1.16. The pipeline included error rate learning, sample inference, read merging, and chimera removal [14].
- OTU-based Pipeline: Processed using
The following table catalogues key reagents, reference materials, and software tools that are essential for conducting and benchmarking amplicon sequencing studies, as evidenced by the reviewed literature.
Table 2: Essential Reagents and Resources for Amplicon Sequencing Benchmarking
| Item Name | Type | Function & Application | Example Usage in Studies |
|---|---|---|---|
| HC227 Mock Community | Reference Material | A gold-standard ground truth comprising 227 bacterial strains from 197 species for objectively evaluating pipeline accuracy [48] [34]. | Used for head-to-head comparison of 8 OTU/ASV algorithms to assess error rates, over-splitting, and over-merging [48]. |
| PowerSoil Pro DNA Kit | Laboratory Reagent | Standardized DNA extraction from complex and difficult-to-lyse samples (e.g., soil, sediment, gut tissue) [14]. | Used for parallel DNA extraction from sediment, seston, and mussel gut samples in a comparative methodology study [14]. |
| Silva 16S rRNA Database | Bioinformatics Resource | A comprehensive, curated database of aligned ribosomal RNA sequences used for taxonomic classification and alignment [14]. | Served as the reference for sequence alignment and taxonomic classification in the MOTHUR OTU pipeline [14]. |
| DADA2 (R Package) | Software Algorithm | A widely used denoising algorithm for inferring exact ASVs from amplicon sequencing data via statistical error modeling [16] [20]. | The primary ASV method in multiple comparative studies for its high resolution and consistent output [16] [48] [14]. |
| MOTHUR | Software Algorithm | A comprehensive, open-source software package for processing sequencing data, supporting multiple OTU clustering algorithms [16] [14]. | The representative OTU-based pipeline in several benchmarks, using a 97% or 99% identity threshold for clustering [16] [14]. |
| Greengenes Database | Bioinformatics Resource | A 16S rRNA gene database and taxonomy tool used for taxonomic assignment of OTUs or ASVs in microbiome studies [98]. | Used for assigning taxonomic information in QIIME1 and QIIME2 analysis workflows during primer region comparison [98]. |
Integrated Analysis and Practical Recommendations
Synthesizing the evidence reveals that the choice between OTUs and ASVs is not a simple binary of right or wrong but is dictated by the specific research objectives and context. The following diagram outlines a decision framework based on the synthesized benchmarking findings.
Recommendation 1: Prioritize ASV methods for high-resolution and cross-study work. Evidence strongly supports the use of ASV methods when the research aims to distinguish closely related microbial strains or requires direct comparison and meta-analysis of data from multiple studies [16] [19]. The consistent labels provided by ASVs make them inherently reusable and reproducible.
Recommendation 2: Acknowledge that both methods capture similar broad-scale ecological patterns. For studies focused on beta diversity and community-level differences (e.g., comparing treatment groups), both OTU and ASV methods have been shown to produce congruent ecological signals [21] [14]. The choice of diversity metric can have an effect as significant as the choice of bioinformatics pipeline.
Recommendation 3: Select methods based on data type and resources. While ASVs are generally recommended for short-read Illumina data, some evidence suggests that for third-generation, long-read amplicons (e.g., full-length 16S rRNA), OTU clustering with a stringent threshold (98.5-99%) may still be a practical and effective choice [20]. Researchers must also consider computational resources, as ASV methods, while more efficient for large sample numbers, can have higher per-sample hardware demands [20].
Future Development Outlook
The evolution of bioinformatics methods for amplicon analysis is ongoing, with several promising trends on the horizon.
Integration of Machine Learning: The future will likely see a deeper application of deep learning and artificial intelligence in bioinformatics. Sequence error correction and classification models based on neural networks could enable more efficient and accurate processing of massive datasets, potentially moving beyond current statistical models [20].
Cross-Platform Analysis Standardization: A significant challenge is the differences in data quality and characteristics between sequencing platforms (e.g., Illumina, PacBio, Oxford Nanopore). Future development is expected to focus on creating standardized analytical frameworks that allow for robust cross-platform comparisons, increasing the utility and universality of microbiome data [20].
Method Hybridization and Dynamic Thresholding: As the limitations of both OTUs and ASVs become better characterized, we may see the development of new tools that hybridize these approaches or apply dynamic, taxon-specific clustering thresholds to optimize biological relevance while controlling for errors [48]. The goal remains the accurate representation of true biological diversity, free from the distortions of methodological artefacts.
Conclusion
The choice between OTUs and ASVs is not merely a technical decision but a fundamental one that shapes research outcomes. While ASVs offer significant advantages in resolution, reproducibility, and cross-study comparison, OTUs remain a valid and sometimes more practical choice, particularly for long-amplicon data or studies with limited computational resources. The field is increasingly moving towards ASVs as the standard unit of analysis, driven by their consistent labeling and superior performance in detecting subtle ecological patterns. For biomedical research, this transition promises enhanced biomarker discovery, more reliable predictive models, and robust meta-analyses. Future directions will likely involve the deeper integration of machine learning, standardized cross-platform analysis protocols, and the development of multi-omics frameworks that leverage the precise taxonomic profiling enabled by ASVs to unravel the complex role of microbiomes in health and disease.
References
- 1. OTU vs. ASV in Metagenomic Analysis [https://www.seqme.eu/en/blog/article/otu-vs-asv-in-metagenomic-analysis]
- 2. OTU(operational taxonomic units),即操作分类单元 [https://www.cnblogs.com/djx571/p/9098831.html]
- 3. OTU 與ASV 的差別 [https://hackmd.io/@CSGChang/OtuVsAsv]
- 4. 16S rRNA 扩增子测序聚类与去噪算法的深度剖析 [https://www.ebiotrade.com/newsf/2025-5/20250514052821255.htm]
- 5. 使用QIIME 2 2025.4分析微生物组16S rDNA基因和ITS扩增 ... [https://cn.bio-protocol.org/mv2/e1011032]
- 6. 刘永鑫/李小方/陈夏/陈同等发布微生物组PacBio与Nanopore ... [https://news.qq.com/rain/a/20251105A06B3U00]
- 7. 基于高通量测序技术的丛枝菌根真菌多样性研究方法 [https://cn.bio-protocol.org/mv2/e2003673]
- 8. 利用基因组测序和分析技术深入了解微生物组 [https://www.crownbio.cn/2023-8-15/]
- 9. 扩增子统计绘图3热图:样品相关分析,差异OTU/ASV 原创 [https://blog.csdn.net/woodcorpse/article/details/106552644]
- 10. ASV vs OTUs clustering: Effects on alpha, beta, and gamma ... [https://pmc.ncbi.nlm.nih.gov/articles/PMC11449282/]
- 11. Microbiome Informatics: OTU vs. ASV [https://www.zymoresearch.com/blogs/blog/microbiome-informatics-otu-vs-asv?srsltid=AfmBOoq7s3NtLWaHjSLop6BIYE8TDJMii5N6VpzZxUapN2eCiAPep0vW]
- 12. Operational Taxonomic Unit (OTU) and OTU Clustering [https://www.cd-genomics.com/microbioseq/operational-taxonomic-unit-otu-and-otu-clustering.html]
- 13. Denoising the Denoisers: an independent evaluation of ... [https://pmc.ncbi.nlm.nih.gov/articles/PMC6087418/]
- 14. Ranking the biases: The choice of OTUs vs. ASVs in 16S rRNA... [https://pmc.ncbi.nlm.nih.gov/articles/PMC8870492/]
- 15. Assessing and Improving Methods Used in Operational ... [https://pmc.ncbi.nlm.nih.gov/articles/PMC3126452/]
- 16. Pruning the Tree: Comparing OTUs and ASVs in High ... [https://pmc.ncbi.nlm.nih.gov/articles/PMC12502049/]
- 17. 3. Frequency filtering / denoising [https://learnmetabarcoding.github.io/LearnMetabarcoding/filtering/freq_filtering_and_denoising.html]
- 18. Microbiome Informatics: OTU vs. ASV [https://www.zymoresearch.com/blogs/blog/microbiome-informatics-otu-vs-asv?srsltid=AfmBOooV4hwhhyxV_NmegSdxxNIV-ZlcEeJ1YAniHRNo4V1TB4Qm3VQw]
- 19. Exact sequence variants should replace operational ... [https://www.nature.com/articles/ismej2017119]
- 20. Amplicon Sequencing Analysis:OTU or ASV? [https://www.cd-genomics.com/resource-amplicon-sequencing-analysis-out-asv.html]
- 21. The choice of OTUs vs. ASVs in 16S rRNA amplicon data ... [https://journals.plos.org/plosone/article?id=10.1371/journal.pone.0264443]
- 22. Daring to be differential: metabarcoding analysis of soil and ... [https://bmcgenomics.biomedcentral.com/articles/10.1186/s12864-020-07126-4]
- 23. Comparing bioinformatic pipelines for microbial 16S rRNA ... [https://pmc.ncbi.nlm.nih.gov/articles/PMC6964864/]
- 24. Deblur Rapidly Resolves Single-Nucleotide ... [https://pmc.ncbi.nlm.nih.gov/articles/PMC5340863/]
- 25. UPARSE-OTU algorithm - USEARCH - drive5 [https://drive5.com/usearch/manual/uparseotu_algo.html]
- 26. UPARSE pipeline - USEARCH manual - drive5 [https://www.drive5.com/usearch/manual7/uparse_pipeline.html]
- 27. DADA2 Pipeline Tutorial (1.16) [https://benjjneb.github.io/dada2/tutorial.html]
- 28. Deblur is a greedy deconvolution algorithm based on ... [https://github.com/biocore/deblur]
- 29. Running Your Pipeline [https://mothur.org/wiki/running_your_pipeline/]
- 30. USEARCH Analysis - previous pipeline - GitHub Pages [https://cryptick-lab.github.io/NGS-Analysis/_site/usearch-previous.html]
- 31. Exact sequence variants should replace operational ... [https://pmc.ncbi.nlm.nih.gov/articles/PMC5702726/]
- 32. Microbiome Informatics: OTU vs. ASV [https://www.zymoresearch.com/blogs/blog/microbiome-informatics-otu-vs-asv?srsltid=AfmBOoqxh3G8Fdq_2Xxgb89KglQF6xWr-1d4C_Ht0TIgEj5zGX3RIUXX]
- 33. The unresolved struggle of 16S rRNA amplicon sequencing [https://environmentalmicrobiome.biomedcentral.com/articles/10.1186/s40793-025-00705-6]
- 34. Unlocking Reliable 16S rRNA Analysis: A Benchmarking Gold ... [https://communities.springernature.com/posts/unlocking-reliable-16s-rrna-analysis-a-benchmarking-gold-standard-ground-truth]
- 35. Comparative analysis of Illumina, PacBio, and nanopore ... [https://www.frontiersin.org/journals/microbiomes/articles/10.3389/frmbi.2025.1587712/full]
- 36. Amplicon Sequencing [https://science.nasa.gov/biological-physical/data/osdr/amplicon-sequencing/]
- 37. Primer, Pipelines, Parameters: Issues in 16S rRNA Gene ... [https://pmc.ncbi.nlm.nih.gov/articles/PMC8544895/]
- 38. Full-length 16S rRNA gene sequencing by PacBio improves ... [https://bmcgenomics.biomedcentral.com/articles/10.1186/s12864-024-10213-5]
- 39. Comparative analysis of full-length 16s ribosomal RNA ... [https://pmc.ncbi.nlm.nih.gov/articles/PMC10411958/]
- 40. Full-Length 16S/18S/ITS Amplicon Sequencing [https://www.cd-genomics.com/full-length-16s-18s-its-amplicon-sequencing.html]
- 41. Best practices for generating and analyzing 16S rRNA ... [https://www.frontiersin.org/journals/microbiology/articles/10.3389/fmicb.2022.1007877/full]
- 42. Optimizing PCR primers targeting the bacterial 16S ribosomal ... [https://bmcbioinformatics.biomedcentral.com/articles/10.1186/s12859-018-2360-6]
- 43. Comparative evaluation of sequencing platforms [https://pmc.ncbi.nlm.nih.gov/articles/PMC12365774/]
- 44. Comparing long-read sequencing technologies [https://www.pacb.com/blog/sequencing-101-comparing-long-read-sequencing-technologies/]
- 45. A species-level identification pipeline for human gut ... [https://www.frontiersin.org/journals/microbiology/articles/10.3389/fmicb.2025.1553124/full]
- 46. Microbiome Informatics: OTU vs. ASV [https://www.zymoresearch.com/blogs/blog/microbiome-informatics-otu-vs-asv?srsltid=AfmBOop7aU-9N43608_FPEfDwa1AcP0z5IjkgSd3G7xy5djFhhTlDQ3w]
- 47. Operational Taxonomic Unit - an overview [https://www.sciencedirect.com/topics/biochemistry-genetics-and-molecular-biology/operational-taxonomic-unit]
- 48. The unresolved struggle of 16S rRNA amplicon sequencing [https://pmc.ncbi.nlm.nih.gov/articles/PMC12076876/]
- 49. Microbiome Informatics: OTU vs. ASV [https://www.zymoresearch.com/blogs/blog/microbiome-informatics-otu-vs-asv?srsltid=AfmBOorEJJp4nM7i5JGfi8_b9-15Kf3K6QkidW6T0O5Sr51aFxGkYERG]
- 50. A species-level identification pipeline for human gut ... [https://pmc.ncbi.nlm.nih.gov/articles/PMC11985812/]
- 51. Amplicon Sequence Variants Artificially Split Bacterial ... [https://pmc.ncbi.nlm.nih.gov/articles/PMC8386465/]
- 52. Current Methods for Studying the Human Microbiome - NCBI [https://www.ncbi.nlm.nih.gov/books/NBK481559/]
- 53. Drug-microbiota interactions: an emerging priority for ... [https://www.nature.com/articles/s41392-023-01619-w]
- 54. Microbiome Therapeutics – Advances and Challenges - PMC [https://pmc.ncbi.nlm.nih.gov/articles/PMC5093770/]
- 55. Reporting guidelines for human microbiome research [https://www.nature.com/articles/s41591-021-01552-x]
- 56. Sequence-specific error profile of Illumina sequencers - PMC [https://pmc.ncbi.nlm.nih.gov/articles/PMC3141275/]
- 57. Microbiome Informatics: OTU vs. ASV [https://www.zymoresearch.com/blogs/blog/microbiome-informatics-otu-vs-asv?srsltid=AfmBOorONsUz_V2_L7FdFptaaV79b7dr25T-s3gobUseeHtpCMyULc66]
- 58. ASVs vs OTUs: Decoding the Microbiome Alphabet Soup [https://elferachid.medium.com/asvs-vs-otus-decoding-the-microbiome-alphabet-soup-246c6e8d45c9]
- 59. Introduction to Amplicon Sequence Variants [https://www.cd-genomics.com/resource-introduction-amplicon-sequence-variants.html]
- 60. Short-read next-generation sequencing of 16s rRNA gene ... [https://pubmed.ncbi.nlm.nih.gov/40099562/]
- 61. Filtering ASVs/OTUs via mutual information-based ... [https://pmc.ncbi.nlm.nih.gov/articles/PMC9482178/]
- 62. The effect of low-abundance OTU filtering methods on ... [https://pmc.ncbi.nlm.nih.gov/articles/PMC10291178/]
- 63. Relative abundance threshold filtering [https://bio-protocol.org/exchange/minidetail?id=18755564&type=30]
- 64. Filtering ASVs/OTUs via mutual information-based ... [https://bmcbioinformatics.biomedcentral.com/articles/10.1186/s12859-022-04919-0]
- 65. Filtering ASVs/OTUs via mutual information-based ... - PubMed [https://pubmed.ncbi.nlm.nih.gov/36114453/]
- 66. Comparing subsampling strategies for metagenomic analysis in... [https://pmc.ncbi.nlm.nih.gov/articles/PMC11684612/]
- 67. Guidelines for preventing and reporting contamination in ... [https://www.nature.com/articles/s41564-025-02035-2]
- 68. Planning and analyzing a low-biomass microbiome study [https://pmc.ncbi.nlm.nih.gov/articles/PMC12445924/]
- 69. Sequencing introduced false positive rare taxa lead to biased ... [https://environmentalmicrobiome.biomedcentral.com/articles/10.1186/s40793-022-00436-y]
- 70. Protocol for microbial profiling of low-biomass upper ... [https://www.sciencedirect.com/science/article/pii/S2666166725001467]
- 71. Species-resolved sequencing of low-biomass or degraded ... [https://pmc.ncbi.nlm.nih.gov/articles/PMC8789378/]
- 72. Effects of Rare Microbiome Taxa Filtering on Statistical ... [https://pmc.ncbi.nlm.nih.gov/articles/PMC7835481/]
- 73. Microbiome differential abundance methods produce ... [https://www.nature.com/articles/s41467-022-28034-z]
- 74. Microbiome Analysis via OTU and ASV-Based Pipelines ... [https://pmc.ncbi.nlm.nih.gov/articles/PMC9029325/]
- 75. OTU/ASV等16S序列随意预测宏基因组,参考数据库增大10倍 [https://blog.csdn.net/woodcorpse/article/details/106552978]
- 76. Microbiome Analysis via OTU and ASV-Based Pipelines ... [https://www.mdpi.com/2306-5354/9/4/146]
- 77. ASV vs OTUs clustering: Effects on alpha, beta, and gamma ... [https://journals.plos.org/plosone/article?id=10.1371/journal.pone.0309065]
- 78. Microbiome data integration via shared dictionary learning [https://www.nature.com/articles/s41467-025-63425-y]
- 79. an integrated framework for differential abundance analysis of ... [https://bmcbioinformatics.biomedcentral.com/articles/10.1186/s12859-025-06217-x]
- 80. Effects of error, chimera, bias, and GC content on the ... [https://pmc.ncbi.nlm.nih.gov/articles/PMC10734440/]
- 81. Benchmarking bacterial taxonomic classification using ... [https://www.nature.com/articles/s41597-024-03672-8]
- 82. Impact of DNA Sequencing and Analysis Methods on 16S rRNA Gene... [https://pubmed.ncbi.nlm.nih.gov/30333179/]
- 83. Microbiome Informatics: OTU vs. ASV [https://www.zymoresearch.com/blogs/blog/microbiome-informatics-otu-vs-asv?srsltid=AfmBOoqONlYReQClJGkz0THXrxz0TTwM_NI_T_0Pkv1x-Tgjw32djN5Z]
- 84. Understanding Alpha Diversity: What It Is and Why It Matters [https://www.cd-genomics.com/resource-understanding-alpha-diversity-what-it-is-why-it-matters.html]
- 85. Alpha Diversity [https://docs.onecodex.com/en/articles/4136553-alpha-diversity]
- 86. Lesson 5: Microbial diversity, alpha rarefaction, alpha diversity [https://bioinformatics.ccr.cancer.gov/docs/qiime2/Lesson5/]
- 87. Beta diversity [https://en.wikipedia.org/wiki/Beta_diversity]
- 88. What is Beta Diversity [https://www.cd-genomics.com/resource-what-beta-diversity.html]
- 89. Integrating sequence composition information into ... [https://pmc.ncbi.nlm.nih.gov/articles/PMC11915819/]
- 90. Amplicon sequence variant [https://en.wikipedia.org/wiki/Amplicon_sequence_variant]
- 91. OTUs and ASVs Produce Comparable Taxonomic and ... [https://pmc.ncbi.nlm.nih.gov/articles/PMC8070570/]
- 92. Does taxonomic and numerical resolution affect the ... [https://www.sciencedirect.com/science/article/pii/S1470160X21001023]
- 93. High-throughput amplicon sequencing and stream benthic ... [https://www.nature.com/articles/srep44657]
- 94. Does taxonomic and numerical resolution affect the ... [https://pmc.ncbi.nlm.nih.gov/articles/PMC7963273/]
- 95. Systematic Comparisons for Composition Profiles ... [https://www.frontiersin.org/journals/molecular-biosciences/articles/10.3389/fmolb.2020.610845/full]
- 96. High-throughput amplicon sequencing of the full-length ... [https://pmc.ncbi.nlm.nih.gov/articles/PMC6765137/]
- 97. Microbiome Analysis via OTU and ASV-Based... [https://pubmed.ncbi.nlm.nih.gov/35447706/]
- 98. Benchmark of 16S rRNA gene amplicon sequencing using ... [https://bmcgenomics.biomedcentral.com/articles/10.1186/s12864-021-07746-4]