High-Throughput Flow Cytometry for Stem Cell Screening: A Guide to Methods, Applications, and Optimization
This article provides a comprehensive overview of high-throughput flow cytometry (HT-FC) for stem cell research and drug discovery.
High-Throughput Flow Cytometry for Stem Cell Screening: A Guide to Methods, Applications, and Optimization
Abstract
This article provides a comprehensive overview of high-throughput flow cytometry (HT-FC) for stem cell research and drug discovery. It covers the foundational principles of using HT-FC to identify and characterize rare stem cell populations based on specific marker expression. The scope extends to detailed methodological workflows, including automated platforms and phenotypic screening, with real-world applications in oncology and immunology. A dedicated troubleshooting section addresses common challenges like weak signal detection and high background, offering practical optimization strategies. Finally, the article explores the validation of novel targets and compares HT-FC with other technologies, highlighting its unique role in advancing regenerative medicine and therapeutic development for researchers and drug development professionals.
Unlocking Stem Cell Heterogeneity: Core Principles and Market Drivers of High-Throughput Flow Cytometry
Flow cytometry stands as a cornerstone technology in stem cell research, providing an unparalleled toolset for the identification, characterization, and isolation of stem cells from heterogeneous populations. This capability is fundamental to advancing both basic research and clinical applications in regenerative medicine [1]. The technology's power derives from its ability to perform high-throughput, multi-parameter analysis at single-cell resolution, offering both quantitative data and, with advanced systems, morphological insights [2] [3]. For researchers and drug development professionals working on high-throughput screening, flow cytometry facilitates rapid profiling of thousands of cells per second, enabling the detection of rare stem cell populations and the monitoring of complex cellular processes such as differentiation, proliferation, and apoptosis [2] [4].
The integration of fluorescence-activated cell sorting (FACS) extends the utility of flow cytometry from analytical to preparative, allowing for the physical isolation of highly pure stem cell populations based on specific surface and intracellular markers [1] [5]. This is crucial for downstream applications like functional genomics, proteomics, transplantation, and the development of cell-based therapies. The continuous evolution of flow cytometry, including the advent of spectral cytometry, imaging flow cytometry, and high-throughput fluorescence lifetime imaging, continues to push the boundaries of what is possible in stem cell research [6] [4] [3].
Key Applications in Stem Cell Research
The application of flow cytometry in stem cell research is diverse, touching upon nearly every aspect of the workflow from initial isolation to final product characterization. The table below summarizes the core applications that leverage the technology's versatility.
Table 1: Key Applications of Flow Cytometry in Stem Cell Research
| Application | Description | Utility in Research & Therapy |
|---|---|---|
| Identification & Characterization [1] [7] | Analysis of specific surface (e.g., CD34) and intracellular markers to define stem cell phenotype. | Confirms stem cell identity and purity based on established criteria (e.g., ISCT guidelines for MSCs). Enables quality control of stem cell products. |
| Fluorescence-Activated Cell Sorting (FACS) [2] [5] | Physical isolation of pure stem cell populations from a mixed sample based on fluorescently labeled markers. | Provides purified cell populations for functional studies, -omics analysis, transplantation, and cell therapy manufacturing. |
| Cell Cycle & Proliferation Analysis [2] | Measurement of DNA content to determine cell cycle phase (G0/G1, S, G2/M) and tracking of cell division. | Reveals the proliferative capacity and replication state of stem cells, crucial for expansion and understanding growth dynamics. |
| Apoptosis & Viability Assessment [2] | Distinguishing between healthy, apoptotic, and necrotic cells using specific fluorescent probes. | Assesses cellular health and response to therapeutic agents or culture conditions, vital for drug screening and toxicology. |
| Immunophenotyping [2] [7] | Comprehensive profiling of multiple cell surface markers to identify and quantify different cell types within a sample. | Defines the immunophenotypic signature of stem cells and characterizes heterogeneous populations in co-culture systems. |
The growing adoption of flow cytometry in stem cell and regenerative medicine workflows is a significant driver of the technology market. It is particularly vital for the accurate quantification of critical cells like CD34+ hematopoietic stem cells, which directly informs transplantation decisions and safeguards the quality of cell therapy products [6].
Quantitative Data and Market Trends
The central role of flow cytometry is reflected in its growing market and technological adoption. The following table quantifies key drivers and segment performances based on recent market analysis.
Table 2: Flow Cytometry Market Drivers and Segment Performance (2024-2030)
| Driver / Segment | Quantitative Impact / Market Share | Relevance to Stem Cell Research |
|---|---|---|
| Adoption in Stem Cell & Regenerative Medicine [6] | ~+1.2% impact on CAGR; Fastest-growing application segment at a 9.86% CAGR. | Direct measurement of CD34+ HSCs accelerates transplantation; essential for quality control in cord blood banks and cell therapy manufacturing. |
| Clinical Diagnostics Adoption [6] | ~+1.0% impact on CAGR; Largest application segment (45.40% of 2024 revenue). | Underpins immunophenotyping for hematological malignancies; minimal residual disease assays become routine. |
| Product Segment: Software [6] | Projected CAGR of 10.34%. | Intelligent analytics and AI reduce data analysis time, enabling complex, high-throughput stem cell screening data interpretation. |
| End-User: Pharma & Biotech [6] | Projected CAGR of 8.87%. | High demand for flow cytometry in cell-therapy development and biomarker-driven clinical trials. |
| Geographic Growth: Asia-Pacific [6] | Projected CAGR of 8.96%. | Government funding for precision medicine and the rise of local biotech start-ups (e.g., in CAR-T and iPSC therapies) drive demand. |
Detailed Experimental Protocols
Protocol 1: Isolation of Human Hematopoietic Stem Cells (HSCs) by FACS
This protocol details the prospective isolation of multipotent long-term repopulating HSCs (LT-HSCs) from human mobilized peripheral blood (mPB), a critical step for functional analysis and cell therapy [5].
The Scientist's Toolkit: Table 3: Essential Reagents for Human HSC Isolation
| Reagent / Material | Function / Specification |
|---|---|
| Leukapheresis Product (mPB) | Source of hematopoietic stem and progenitor cells (HSPCs) mobilized by G-CSF. |
| CD34 MicroBead Kit | Magnetic-activated cell sorting (MACS) for initial enrichment of CD34+ cells. |
| Fluorophore-conjugated Antibodies | Panel for Lin-CD34+CD38-CD45RA-CD90+CD49f+ phenotype. |
| Viability Dye (e.g., Fixable Viability Dye) | Distinguishes and excludes dead cells from the analysis and sort. |
| FACS Buffer (PBS + 1% BSA) | Maintains cell viability and prevents non-specific antibody binding. |
| LS Columns & autoMACS Separator | Hardware for the magnetic separation process. |
| FACSAria III Cell Sorter | Instrument for high-speed, high-purity cell sorting. |
Methodology:
- Sample Preparation: Isolate nucleated cells from fresh or frozen mob LPs using density gradient centrifugation.
- CD34+ Enrichment: Perform positive selection for CD34+ cells using the CD34 MicroBead Kit according to the manufacturer's instructions. This step significantly enriches the target population, improving the efficiency of the subsequent FACS sort [5].
- Antibody Staining: a. Viability Staining: Resuspend the cell pellet in FACS buffer and stain with an appropriate viability dye for 30 minutes at 4°C. Wash with buffer. b. Blocking: Resuspend cells in FACS buffer and incubate for 15-20 minutes at 4°C to block Fc receptors and minimize non-specific binding. c. Surface Marker Staining: Prepare a master mix of antibodies against the lineage cocktail (CD2, CD3, CD14, CD16, CD19, CD56, CD235a), CD34, CD38, CD45RA, CD90, and CD49f in FACS buffer. Incubate with the cell pellet for 30 minutes in the dark at 4°C. Wash cells thoroughly.
- Cell Sorting: a. Resuspend the stained cells in FACS buffer and pass through a cell strainer to remove aggregates. b. Using a high-speed sorter (e.g., FACSAria III), establish the sorting gates. First, gate on single cells using FSC-A vs. FSC-H. From single cells, select viable cells (viability dye negative). Then, sequentially gate on Lin-, CD34+, CD38-, CD45RA-, CD90+, and finally CD49f+ to isolate the LT-HSC population [5]. c. Sort the target population into a collection tube containing an appropriate recovery medium.
- Post-Sort Analysis: A small aliquot of the sorted cells should be re-analyzed on the flow cytometer to confirm purity, which should typically exceed 90-95%.
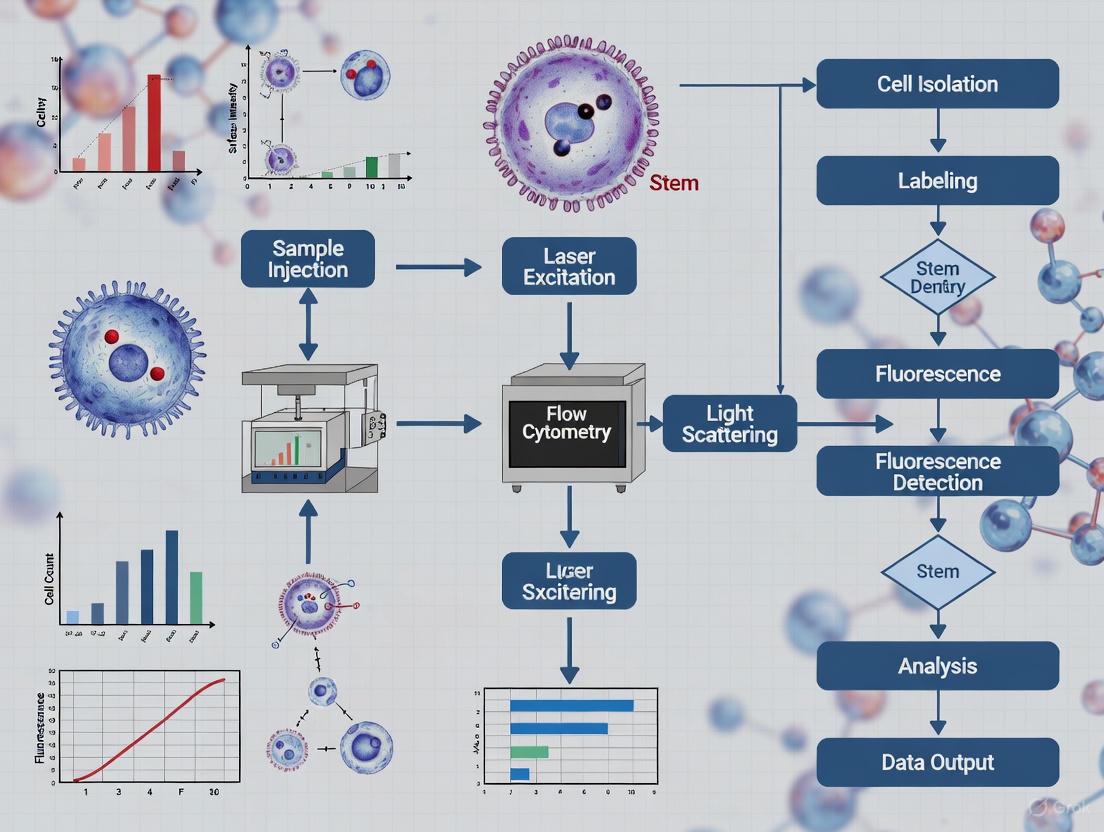
The following workflow diagram summarizes the key steps of this protocol:
Protocol 2: Analysis of B Cell Populations in Murine Bone Marrow
This protocol provides a framework for profiling B cell developmental stages in mouse bone marrow, demonstrating the application of flow cytometry for detailed lineage analysis in a complex tissue [8].
The Scientist's Toolkit: Table 4: Key Antibodies for Murine B Cell Profiling
| Antibody Target | Conjugate | Function in Identification |
|---|---|---|
| B220/CD45R | FITC | Pan-B cell marker; identifies later-stage B lineage cells. |
| CD45 | PE-Texas Red | Differentiates stages within the B cell lineage. |
| CD19 | APC-Cy7 | Consistent marker across B cell stages; essential for activation. |
| IgM | PerCP-Cy7 | Identifies early B cell stages. |
| IgD | PE | Expressed during maturation; used with IgM to identify transitional stages. |
| CD43 | AF700 | Distinguishes pro-B cells (CD43+) from later stages (CD43-). |
Methodology:
- Bone Marrow Harvest: Euthanize C57BL/6 mice and isolate femurs and tibias. Flush the bone marrow cavities with cold supplemented RPMI medium using a syringe and needle. Generate a single-cell suspension by passing the cells through a 70 μm cell strainer [8].
- Cell Counting: Count the cells and assess viability using Trypan Blue exclusion.
- Staining Procedure (96-well U-bottom plate): a. Viability Staining: Pellet cells, discard supernatant, and stain with LIVE/DEAD Fixable Aqua Dead Cell Stain for 30 minutes at 4°C. Wash with PBS. b. Blocking: Resuspend cells in PBS with 1% BSA for 15-20 minutes at 4°C. c. Surface Staining: Prepare a cocktail of antibodies against B220, CD45, CD19, IgM, IgD, and CD43 in FACS buffer. Add the cocktail to the cell pellet and incubate for 30 minutes in the dark at 4°C. Wash cells twice.
- Flow Cytometric Analysis: a. Acquire data on a flow cytometer equipped with at least three lasers (blue, red, violet). b. The gating strategy typically involves: FSC-A vs. SSC-A to gate on lymphocytes, then FSC-A vs. FSC-H to select single cells. From single cells, gate on live cells (viability dye negative) and then on B220+/CD19+ B cells. c. Further sub-populations are identified based on the expression of IgD, IgM, and CD43. For example, pro-B cells are B220+/CD43+, while immature B cells are B220+/IgM+ [8].
Advanced Technological Innovations
The field of flow cytometry is rapidly evolving, with several advanced technologies significantly enhancing its capability for high-throughput stem cell screening.
Spectral Flow Cytometry: This technology uses full-spectrum detection and unmixing algorithms, allowing for the simultaneous measurement of over 40 markers from a single sample [6] [5]. It reduces autofluorescence background and increases sensitivity, which is particularly beneficial for analyzing challenging samples like primary stem cells [9].
Imaging Flow Cytometry (IFC): IFC merges the high-throughput capability of conventional flow cytometry with high-resolution morphological imaging [3]. It captures multiple images of each cell, providing data on cell size, shape, and the subcellular localization of signals. This is invaluable for assessing cell health, visualizing internal structures, and confirming the presence of specific proteins within organelles, adding a crucial visual dimension to screening data.
High-Throughput Fluorescence Lifetime Imaging Flow Cytometry: A cutting-edge innovation that measures the fluorescence lifetime of molecules, a parameter independent of concentration and fluorescence intensity. This makes it highly robust for analyzing heterogeneous samples, such as tumors, and can capture dynamic changes in the cell nucleus induced by drugs at a throughput of over 10,000 cells per second [4].
The logical relationship between core, advanced, and emerging technologies in flow cytometry and their contributions to stem cell research can be visualized as follows:
Key Stem Cell Markers and Multi-Parameter Analysis for Resolving Complex Populations
Stem cell research relies heavily on the precise identification and isolation of distinct cellular populations from heterogeneous mixtures. Flow cytometry serves as a cornerstone technology in this field, enabling high-throughput, multi-parameter analysis at single-cell resolution. The identification of stem cells, whether normal or cancerous, hinges on detecting specific molecular markers that define their identity and functional state. For researchers and drug development professionals, mastering these markers and their integrated analysis is crucial for advancing therapeutic development and understanding disease mechanisms. This application note provides a comprehensive guide to key stem cell markers and detailed protocols for their use in resolving complex cellular populations within high-throughput screening environments.
Stem Cell Marker Panels for Population Resolution
Stem cells are defined by specific surface and intracellular proteins that vary by tissue type and developmental stage. The tables below catalog essential markers for major stem cell categories.
Table 1: Hematopoietic Stem and Progenitor Cell Markers [10]
| Cell Population | Marker Combination | Functional Significance |
|---|---|---|
| Total HSC | Lin⁻ CD34⁺ CD38⁻ | Enriches for all hematopoietic stem cells |
| Long-Term HSC (LT-HSC) | Lin⁻ CD34⁺ CD38⁻ CD90⁺ | Capable of lifelong multilineage reconstitution |
| Short-Term HSC (ST-HSC) | Lin⁻ CD34⁺ CD38⁻ CD90⁻ | Transient reconstitution capacity |
| Common Myeloid Progenitor (CMP) | Lin⁻ CD34⁺ CD38⁺ CD123⁺ CD45RA⁻ | Committed to myeloid lineage (granulocytes, monocytes) |
| Granulocyte-Monocyte Progenitor (GMP) | Lin⁻ CD34⁺ CD38⁺ CD123⁺ CD45RA⁺ | Committed to granulocyte and macrophage differentiation |
| Megakaryocyte-Erythrocyte Progenitor (MEP) | Lin⁻ CD34⁺ CD38⁺ CD123⁻ CD45RA⁻ | Committed to platelet and red blood cell differentiation |
| Common Lymphoid Progenitor (CLP) | Lin⁻ CD34⁺ CD10⁺ CD45RA⁺ | Committed to lymphoid lineage (T, B, NK cells) |
Table 2: Key Markers for Other Stem Cell Types [11] [12]
| Cell Type | Key Markers | Primary Functions/Notes |
|---|---|---|
| T cells | CD3, CD4, CD8, CD25, CD45RA/RO | CD3 is a universal T-cell marker; CD4/CD8 define subsets; CD25 indicates activation/T-regs |
| B cells | CD19, CD20, CD21, CD27, CD38 | CD19 universal; CD20 mature B cells; CD38 plasma cells |
| Natural Killer (NK) Cells | CD56, CD16, NKp46 | Part of innate immunity; CD16 mediates ADCC |
| Monocytes/Macrophages | CD11b, CD14, CD33, CD68 | Phagocytosis, antigen presentation |
| Dendritic Cells | CD11c, CD80, CD83 | Key antigen-presenting cells; CD83 indicates maturation |
| Cancer Stem Cells (CSCs) | Varies by cancer (e.g., JAM-A in GBM) | Self-renewal, therapy resistance, tumor initiation [13] |
| Pluripotent Stem Cells | SSEA-4, TRA-1-60, TRA-1-81, OCT4, NANOG | Define embryonic and induced pluripotent stem cells (hESCs/iPSCs) |
High-Throughput Screening Protocol: Identification of Novel CSC Adhesion Mechanisms
This protocol, adapted from a study investigating glioblastoma (GBM) cancer stem cells (CSCs), outlines a method for screening adhesion receptors to identify novel CSC maintenance factors [13].
Experimental Workflow
The following diagram illustrates the key stages of the high-throughput screening workflow.
Materials and Reagents
- Cell Lines: Multiple patient-derived glioblastoma xenograft specimens (e.g., 6 different specimens with validated differences in self-renewal) [13].
- Antibodies: A commercial library of fluorescently conjugated antibodies against cell adhesion molecules. In the original screen, antibodies were selected for which commercially available reagents existed [13].
- Staining Buffer: Phosphate-buffered saline (PBS) supplemented with 2-5% fetal bovine serum (FBS) or bovine serum albumin (BSA).
- Viability Dye: Propidium iodide (PI) or 7-Aminoactinomycin D (7-AAD) to exclude dead cells.
- Barcoding Reagent: A cell viability-compatible dye (e.g., CellTrace) or an antibody-based barcoding kit to uniquely label each specimen before pooling.
- Equipment: High-speed cell sorter or analyzer capable of detecting multiple fluorochromes.
Step-by-Step Procedure
- Sample Preparation and Validation: Establish and expand patient-derived GBM xenografts. Validate the self-renewal potential of each specimen using in vitro sphere-forming assays and in vivo tumorigenicity tests [13].
- Cell Barcoding: Harvest dissociated GBM cells into single-cell suspensions. Individually barcode each of the 6 GBM specimens using a unique fluorescent label. This allows all specimens to be pooled and processed simultaneously in a single tube, minimizing technical variability [13].
- Pooled Staining: Combine the uniquely barcoded cell suspensions into one master sample. Stain the pooled cells with the pre-titrated library of adhesion molecule antibodies according to manufacturer recommendations. Include a viability marker (e.g., PI).
- Data Acquisition: Run the stained, pooled sample on a high-throughput flow cytometer. First, de-barcode the samples by gating on each unique barcode signal. For each de-barcoded population, analyze the expression of the adhesion receptor library. The original study set a selection criterion where adhesion receptors expressed above a level of 5% in at least 3 of the 6 GBM specimens were considered for further analysis [13].
- Bioinformatics Correlation: Compile a list of candidate adhesion receptors from the flow screen. Interrogate their gene expression against patient survival data using a relevant database (e.g., the NCI REMBRANDT database for glioma). Rank the candidates based on the strength of their negative correlation with patient prognosis [13].
- Hit Identification and Validation: Select top candidates (e.g., JAM-A was a top hit in the GBM study) for functional validation using knockdown or knockout models to assess the impact on CSC self-renewal, differentiation, and tumorigenic potential in vivo [13].
Protocol for Multi-Parameter Flow Cytometry Analysis of Heterogeneous Samples
This general protocol is essential for the accurate resolution of complex stem cell populations, such as hematopoietic stem and progenitor cells (HSPCs) [10] [14].
Data Analysis Workflow
The process of analyzing multi-parameter data involves a sequential gating strategy to purify the population of interest.
Materials and Reagents
- Antibody Panels: Pre-optimized antibody cocktails. For human HSPCs, this typically includes:
- Lineage Depletion Cocktail (Lin): Antibodies against CD2, CD3, CD4, CD7, CD8, CD11b, CD14, CD15, CD19, CD20, CD56, and Glycophorin A, all conjugated to the same fluorophore [10].
- Progenitor Identification Panel: Antibodies against CD34, CD38, CD90, CD45RA, and CD123, each conjugated to distinct fluorophores [10].
- Viability Dye: Zombie Aqua Fixable Viability Kit, PI, or 7-AAD.
- Staining Buffer: PBS with 2% FBS.
- Red Blood Cell Lysis Buffer: If working with peripheral blood or bone marrow.
- Fixation Buffer: If samples are not to be sorted and need to be preserved.
Step-by-Step Procedure
- Sample Preparation: Obtain single-cell suspensions from tissue (e.g., bone marrow, tumor) using appropriate enzymatic or mechanical dissociation. Perform red blood cell lysis if necessary. Filter cells through a 40-70 µm strainer to ensure a monodisperse suspension [14].
- Viability Staining: Resuspend cells in staining buffer and incubate with a fixable viability dye for 15-30 minutes on ice, protected from light.
- Surface Marker Staining: Wash cells to remove excess dye. Incubate with the pre-titrated antibody cocktail (including the lineage cocktail and progenitor panel) for 20-30 minutes on ice in the dark.
- Wash and Resuspend: Wash cells twice with staining buffer to remove unbound antibodies. Resuspend in staining buffer, optionally with a low concentration of DNA dye (e.g., DAPI) for live sorting.
- Data Acquisition and Gating: Run samples on a flow cytometer. Adhere to the sequential gating strategy:
- Singlets: Gate on cells based on forward scatter area (FSC-A) vs. height (FSC-H) to exclude cell doublets and aggregates.
- Live Cells: Gate on viability dye-negative cells.
- Lineage Negative: Gate on Lin⁻ (negative for the lineage cocktail) cells to remove committed progenitors and mature cells.
- Phenotypic Gating: Within the Lin⁻ live singlets, apply specific marker combinations to resolve stem and progenitor subsets (refer to Table 1 for combinations). Use fluorescence-minus-one (FMO) controls to accurately set positive/negative gates for each channel [14].
- Data Reporting: When publishing, include all gating steps, specify the software used for analysis, the number of events collected, and the compensation matrix. Provide plots (density or contour plots are preferred) with clear axis labels and percentages in gates [14].
The Scientist's Toolkit: Research Reagent Solutions
Table 3: Essential Reagents for Stem Cell Flow Cytometry
| Reagent Type | Specific Examples | Critical Function |
|---|---|---|
| Viability Dyes | Propidium Iodide (PI), 7-AAD, Zombie Aqua | Distinguishes live from dead cells; critical for accurate analysis of rare populations. |
| Lineage Depletion Cocktail | Anti-CD2, CD3, CD11b, CD14, CD19, CD20, etc. | Negative selection to remove mature, differentiated cells from the sample. |
| Core Stem Cell Markers | CD34, CD90, CD133, CD38, CD45RA | Positive selection to define and isolate specific stem and progenitor cell subsets. |
| Functional Dyes | Hoechst 33342 (for Side Population), Calcium Flux Dyes (e.g., Fluo-4) | Identifies cells based on functional properties like dye efflux (stem cell feature) or signaling activation. |
| Intracellular Staining Reagents | FoxP3 / Transcription Factor Buffer Set, Cytokine Staining Kits | Permeabilization buffers and kits to detect intracellular proteins (e.g., transcription factors, cytokines). |
The resolution of complex stem cell populations is fundamental to advancing both basic research and clinical applications in regenerative medicine and oncology. The integration of defined marker panels, robust high-throughput screening methodologies, and rigorous multi-parameter analysis protocols provides a powerful framework for identifying and characterizing these critical cells. Adherence to detailed experimental and data reporting standards ensures reproducibility and reliability, accelerating the translation of stem cell research into novel therapeutic strategies.
The global flow cytometry market represents a cornerstone technology in life sciences, experiencing robust and sustained growth. This market, valued between USD 5.06 billion and USD 6.13 billion in 2025, is projected to expand at a compound annual growth rate (CAGR) of 7.40% to 8.7%, reaching between USD 9.85 billion and USD 13.5 billion by 2033-2035 [15] [16] [17]. This growth trajectory is fueled by the technology's fundamental role in stem cell research, drug discovery, clinical diagnostics, and the rising prevalence of chronic diseases. Flow cytometry offers rapid, multi-parameter analysis of individual cells within heterogeneous populations, a capability critical for identifying and characterizing rare stem cells based on specific surface and intracellular markers [12]. The market's expansion is further propelled by continuous technological innovations, including spectral cytometry, high-throughput systems, and the integration of artificial intelligence (AI) for data analysis [15] [16] [18].
The application of flow cytometry in stem cell research is particularly significant. Stem cells possess unique features like self-renewal and multipotency, and their identification relies heavily on analyzing the expression of specific markers. Flow cytometry not only quantifies these markers at single-cell resolution but also enables the physical isolation of even rare stem cell populations through fluorescence-activated cell sorting (FACS) [12]. As research in regenerative medicine and stem cell-based therapies advances, the demand for sophisticated flow cytometry tools and services is expected to intensify, solidifying its position as a versatile and indispensable tool in biomedical research and development.
Quantitative Market Analysis
The flow cytometry market demonstrates consistent global expansion, with growth varying by product segment, technology, application, and region. The following tables provide a detailed breakdown of current market valuations and future forecasts.
Table 1: Global Flow Cytometry Market Size and Growth Projections
| Report Source | Market Size (2024/2025) | Projected Market Size (2033-2035) | Forecast Period CAGR |
|---|---|---|---|
| Research and Markets [15] | USD 3.39 billion (2024) | USD 7.37 billion (2035) | 7.40% (2025-2035) |
| Fact.MR [16] | USD 6.1 billion (2025) | USD 13.5 billion (2035) | 8.3% (2025-2035) |
| MarketsandMarkets [17] | USD 5.06 billion (2025) | USD 9.85 billion (2033) | 8.7% (2025-2033) |
| Precedence Research [18] | USD 6.13 billion (2025) | USD 12.11 billion (2034) | 7.80% (2025-2034) |
Table 2: Market Segmentation and Regional Growth Outlook
| Segment | Dominant/Largest Segment | Fastest-Growing Segment | Key Regional Markets (Growth) |
|---|---|---|---|
| Product & Service [17] [6] | Reagents & Consumables | Software (10.34% CAGR) | North America (Largest), Asia-Pacific (Fastest, up to 9.04% CAGR) [15] [16] |
| Technology [17] [6] | Cell-Based Flow Cytometry | Bead-Based Flow Cytometry | Europe (Steady, 7.53% CAGR to reach \$2.04B by 2035) [19] |
| Application [17] [6] | Research Applications | Stem Cell & Regenerative Medicine | Latin America (Notable growth) [18] |
| End User [6] | Hospitals & Clinics | Pharmaceutical & Biotechnology Companies |
The data reveals a market poised for significant growth across all segments. The dominance of reagents and consumables underscores the technology's widespread and recurring use in laboratories [17]. Meanwhile, the rapid growth in software highlights an increasing focus on managing and interpreting the complex, high-dimensional data generated by modern cytometers [6]. Geographically, while North America remains the largest market due to its advanced healthcare infrastructure and high R&D spending, the Asia-Pacific region is emerging as the growth engine, driven by increasing healthcare investments, expanding research infrastructure, and growing biotechnology sectors in China and India [15] [16] [18].
Key Drivers of Market Growth
▲ Rising Disease Burden and Adoption in Clinical Diagnostics
The increasing global prevalence of cancer, HIV/AIDS, autoimmune disorders, and infectious diseases is a primary driver for the flow cytometry market [16] [18]. In clinical diagnostics, flow cytometry has become the gold standard for immunophenotyping in leukemias and lymphomas, and is increasingly used for monitoring minimal residual disease (MRD) and primary immunodeficiency disorders [6]. The recent FDA clearance of 13-color clinical cytometers has reduced validation hurdles, further accelerating its adoption in community pathology labs [6].
▲ Technological Advancements and Product Innovation
Continuous innovation is a hallmark of this market, directly fueling its growth. Key technological trends include:
- Spectral Flow Cytometry: This technology allows for simultaneous detection of dozens of parameters by capturing the full fluorescence spectrum, improving accuracy in complex studies and reducing sample requirements [15] [16].
- Integration of AI and Machine Learning: AI-driven automated gating algorithms and data analysis tools are mitigating operator bottlenecks and simplifying the interpretation of large, complex datasets, making high-parameter cytometry accessible to a broader user base [16] [18] [6].
- High-Throughput and Automated Systems: These systems enhance workflow efficiency and are particularly valuable in drug discovery and cell therapy manufacturing [15] [19].
- Imaging Flow Cytometry: This hybrid technology pools the principles of flow cytometry with microscopy, generating high-resolution images alongside quantitative data, which is crucial for characterizing cells based on morphology and subcellular localization [12].
▲ Growing Applications in Stem Cell Research and Regenerative Medicine
Flow cytometry is indispensable in stem cell research, contributing significantly to market growth. Its applications include:
- Identification and Characterization: Enumerating and characterizing hematopoietic stem cells (HSCs), mesenchymal stem cells (MSCs), and pluripotent stem cells based on specific markers like CD34, CD45, and transcription factors [12].
- Isolation of Rare Populations: Using FACS to physically isolate pure populations of even very rare stem cells for downstream research or therapeutic use [12].
- Cell Therapy Development: As gene-edited and stem cell therapies move toward commercialization, flow cytometry is critical for in-process characterization, quality control, and monitoring immunologic reconstitution after transplantation [12] [6]. Accurate CD34+ HSC enumeration from minimally processed blood, for example, reduces graft adequacy variability and accelerates transplantation decisions [6].
▲ Expansion into Personalized Medicine and Drug Discovery
The shift toward precision medicine and the growth of biologics, immunotherapy, and personalized drug development are creating sustained demand for flow cytometry [16]. It enables the detection of biomarkers, immune profiling, and monitoring of cellular responses to targeted therapies like CAR-T cells [6]. Flow cytometry is also expanding its role in companion diagnostic development, supporting faster treatment-selection cycles in precision oncology [6].
Analysis of Market Restraints
Despite strong growth prospects, the flow cytometry market faces several challenges that could restrain its expansion, particularly in cost-sensitive and resource-limited settings.
- High Capital and Operational Costs: The high initial investment for flow cytometers, often costing hundreds of thousands of dollars, coupled with recurring expenses for reagents, assays, and maintenance, poses a significant barrier to adoption, especially for smaller laboratories and those in developing economies [16] [19] [18].
- Shortage of Skilled Professionals: Operating advanced cytometers, setting up multicolor panels, and interpreting high-dimensional data require specialized training and expertise. A global shortage of skilled cytometrists creates workflow bottlenecks and can drive outsourcing to reference labs, tempering near-term market growth [16] [19] [6].
- Regulatory and Standardization Hurdles: The adoption of flow cytometry in clinical diagnostics faces challenges due to the need for FDA, CE-IVD, or other local approvals. Variability in data reproducibility across labs and a lack of harmonized global guidelines on assay validation can slow down clinical adoption and increase costs for manufacturers [16] [19] [6].
- Data Management Complexities: High-parameter experiments generate massive, gigabyte-scale files that strain local storage and require sophisticated analysis software. Concerns about data integration with laboratory IT systems and cybersecurity in cloud-based workflows can also lengthen procurement cycles [6].
Application Notes: Flow Cytometry in Stem Cell Research
Experimental Protocol: Characterization of Human Hematopoietic Stem and Progenitor Cells (HSPCs)
Objective: To identify, enumerate, and characterize viable human HSPCs from a heterogeneous cell population, such as umbilical cord blood or bone marrow aspirate, using multiparameter flow cytometry.
Principle: Hematopoietic stem cells are rare populations characterized by the surface expression of CD34 and CD45dim, and the absence of lineage commitment markers (Lin-). This protocol uses a combination of fluorochrome-conjugated antibodies to distinguish HSPCs from mature blood cells.
Table 3: Research Reagent Solutions for HSPC Characterization
| Reagent / Material | Function / Specificity | Example |
|---|---|---|
| Viability Dye | Distinguishes live from dead cells to exclude false-positive signals from compromised cells. | Fixable Viability Stain (FVS) |
| Anti-Human CD34 Antibody | Identifies hematopoietic stem and progenitor cells. | Clone 581, conjugated to FITC |
| Anti-Human CD45 Antibody | Pan-leukocyte marker; HSPCs show dim (low) expression. | Conjugated to PerCP-Cy5.5 |
| Lineage Cocktail (Lin1) | Mixture of antibodies against mature cell markers (e.g., CD3, CD14, CD19, CD20, CD56). Cells negative for this cocktail are enriched for primitive cells. | Conjugated to PE |
| FC Receptor Blocking Reagent | Reduces non-specific antibody binding by blocking Fc receptors on cells like monocytes. | Human IgG |
| Cell Staining Buffer | Provides an optimized pH and protein base for antibody binding. | PBS with 2% FBS |
| Flow Cytometer | Instrument for acquisition and analysis of the stained cell suspension. | High-throughput analyzer with minimum 3 lasers (Blue, Red, Violet) |
Procedure:
- Sample Preparation: Obtain human umbilical cord blood or bone marrow aspirate. Isolate mononuclear cells (MNCs) using density gradient centrifugation (e.g., Ficoll-Paque). Wash cells twice in cell staining buffer and count.
- Viability Staining: Resuspend up to 1x10^7 cells in 1 mL of buffer. Add the viability dye as per manufacturer's instructions. Incubate for 10-20 minutes in the dark at 4°C. Wash cells with buffer to remove excess dye.
- FC Blocking: Resuspend the cell pellet in 100 µL of buffer. Add an appropriate amount of human IgG. Incubate for 10 minutes at 4°C.
- Surface Marker Staining: Without washing, add the pre-titrated antibody cocktail (anti-CD34, anti-CD45, Lin1 cocktail). Vortex gently and incubate for 30 minutes in the dark at 4°C.
- Wash and Resuspend: Wash cells twice with 2-3 mL of buffer. Finally, resuspend the cell pellet in 0.5-1 mL of buffer for acquisition. Keep samples on ice and protected from light.
- Data Acquisition: Run samples on a flow cytometer. Adjust photomultiplier tube (PMT) voltages using unstained and single-stained compensation controls. Acquire a minimum of 100,000 events from the live cell gate for statistically robust analysis of rare HSPCs.
- Data Analysis:
- Gate on cells based on FSC-A vs SSC-A to exclude debris.
- Gate on single cells using FSC-H vs FSC-A.
- Gate on viable cells (FVS negative).
- From the live, single-cell population, display CD45 vs SSC. HSPCs typically fall in the CD45dim and low SSC region.
- On the CD45dim population, plot CD34 vs Lin. The HSPC population is identified as CD34+ and Lin-.
- The percentage and absolute count of HSPCs can be calculated from the parent population [12] [20].
Diagram 1: Gating strategy for HSPC identification.
Experimental Protocol: Cell Cycle Analysis of Pluripotent Stem Cells
Objective: To determine the distribution of cells in different phases of the cell cycle (G0/G1, S, G2/M) within a population of pluripotent stem cells (PSCs).
Principle: The protocol uses a fluorescent dye, Propidium Iodide (PI), which stoichiometrically binds to double-stranded DNA. Since DNA content doubles during the S phase, the fluorescence intensity of PI directly correlates with a cell's position in the cell cycle.
Procedure:
- Cell Harvest and Fixation: Culture PSCs to ~70% confluence. Harvest cells gently using enzyme-free dissociation buffer to preserve cell integrity. Wash cells with PBS and carefully resuspend in 0.5 mL of PBS.
- Fixation: Slowly add the cell suspension to 4.5 mL of ice-cold 70% ethanol while vortexing gently to prevent cell clumping. Fix cells for at least 2 hours or overnight at -20°C.
- Staining: Pellet the fixed cells and wash twice with PBS to remove ethanol. Resuspend the cell pellet in 0.5 mL of PI/RNase Staining Buffer (commercially available). The RNase ensures that PI only binds to DNA and not RNA.
- Incubation: Incubate the cells for 30-45 minutes at room temperature in the dark.
- Data Acquisition and Analysis: Analyze samples on a flow cytometer using a 488 nm laser and a detector with a bandpass filter around 617 nm (PE-Texas Red channel). Acquire at least 20,000 events from a singlet gate. Use flow cytometry software with cell cycle fitting algorithms (e.g., Dean-Jett-Fox model) to quantify the percentage of cells in G0/G1, S, and G2/M phases [12].
Diagram 2: Cell cycle analysis workflow.
The flow cytometry market is on a solid growth trajectory, underpinned by its irreplaceable role in basic research, clinical diagnostics, and the burgeoning fields of cell and gene therapy. The future of this market will be shaped by several key developments:
- Technological Convergence: The integration of flow cytometry with other modalities, such as mass spectrometry (CyTOF) and advanced genetic analyses, will provide a more holistic view of cellular function. Furthermore, the "Interact-omics" framework demonstrates the potential of cytometry to move beyond single-cell analysis to map physical cellular interactions at an ultra-high scale, opening new avenues in immunology and drug discovery [21].
- Automation and Accessibility: To address cost and skill-related restraints, the market will see a push towards more compact, benchtop, and automated instruments with simplified workflows. This will make the technology more accessible to smaller labs and point-of-care settings [19].
- Data Integration and AI: The role of AI and cloud-based analytics will become increasingly central, transforming data from complex high-parameter experiments into actionable biological insights efficiently and reproducibly [18] [6].
In conclusion, the multi-billion dollar flow cytometry industry is dynamically evolving. Its growth is not merely a function of market forces but a direct reflection of its critical enabling role in modern biomedical science. For researchers and drug development professionals, staying abreast of these technological and market trends is essential for leveraging the full potential of flow cytometry in pioneering stem cell research and delivering next-generation therapeutics.
High-throughput flow cytometry (HT-FC) has become an indispensable tool in stem cell research and drug discovery, enabling rapid, multiparametric analysis of thousands of cells per second. Two transformative technologies power modern HT-FC systems: spectral flow cytometry and acoustic-assisted hydrodynamic focusing. Spectral technology represents a fundamental shift from conventional flow cytometry by capturing the entire emission spectrum of each fluorochrome, rather than isolating specific wavelengths, enabling superior resolution of overlapping fluorescent signals and more complex panel design [22] [23]. Acoustic focusing technology utilizes ultrasonic waves to precisely align cells within a fluidic stream, maintaining analysis precision even at very high flow rates [24] [25]. The integration of these core technologies addresses critical challenges in stem cell screening, including the need for comprehensive immunophenotyping of heterogeneous populations, detection of rare cell subsets, and maintenance of cell viability during high-speed processing.
Principles of Spectral Flow Cytometry
Spectral flow cytometry fundamentally differs from conventional flow cytometry in its approach to fluorescence detection. While conventional systems use optical filters and dichroic mirrors to direct specific wavelength ranges to discrete detectors, spectral instruments employ detector arrays to capture the full emission spectrum across multiple laser lines [23]. This complete spectral capture enables sophisticated unmixing algorithms to distinguish between fluorochromes with highly overlapping emissions, a capability particularly valuable for high-parameter stem cell panels where marker combinations often exceed 30 colors [23]. The mathematical foundation of spectral unmixing relies on creating a reference library of unique spectral signatures for each fluorochrome, then deconvoluting composite signals from stained cells using linear algebra operations [23]. This approach provides significant advantages for stem cell research, including reduced autofluorescence interference through spectral separation, improved sensitivity for dimly expressed markers, and greater flexibility in panel design without being constrained by traditional filter-based limitations [22] [23].
Principles of Acoustic Focusing Flow Cytometry
Acoustic-assisted hydrodynamic focusing represents a breakthrough in sample core positioning technology. Traditional hydrodynamic focusing relies solely on fluid dynamics to create a laminar flow stream, which can become disrupted at high sample throughput rates, leading to increased coefficient of variation (CV) and reduced data quality. Acoustic focusing technology addresses this limitation by applying precisely controlled ultrasonic standing waves perpendicular to the sample stream, creating pressure nodes that gently position cells into a single-file stream at the center of the flow cell [24]. This acoustic energy acts as a non-contact, non-destructive method for cell alignment, maintaining precise optical interrogation regardless of sample input rate or viscosity variations common in complex stem cell preparations. The technology enables systems like the Attune Xenith to maintain population resolution at flow rates up to 1,000 μL/min, significantly accelerating sample processing while preserving data integrity—a critical advantage for time-sensitive stem cell experiments where preservation of cell viability and function is paramount [22] [24].
Integrated HT-FC Systems for Stem Cell Research
Modern HT-FC platforms combine spectral detection and acoustic focusing with advanced automation to create comprehensive solutions for stem cell screening workflows. Leading instrumentation available in 2025 includes several systems with specialized capabilities:
Table 1: High-Throughput Flow Cytometry Systems with Spectral and Acoustic Technologies
| Instrument | Manufacturer | Core Technologies | Key Specifications | Stem Cell Research Applications |
|---|---|---|---|---|
| Invitrogen Attune Xenith Flow Cytometer | Thermo Fisher Scientific | Acoustic focusing, Spectral unmixing | 6 lasers, 51 fluorescent detectors, 1,000 μL/min max flow rate | High-speed immunophenotyping, Rare population analysis |
| Bigfoot Spectral Cell Sorter | Thermo Fisher Scientific | Spectral cell sorting, Automated setup | 5 lasers, Up to 200 μm nozzle for large cells | Stem cell sorting, Spheroid isolation |
| Cytek Aurora Evo Flow Cytometer | Cytek Biosciences | Full Spectrum Profiling, Automated maintenance | 5 lasers, Standardized instrument harmonization | High-parameter screening, Multi-site studies |
| BD FACSDiscover A8 Cell Analyzer | BD Biosciences | Spectral FX Technology, CellView Imaging | 78 spectral detectors, 35,000 events/sec | Morphological analysis, Image-guided sorting |
| CytoFLEX Mosaic | Beckman Coulter | Modular spectral detection, Dual-mode operation | 88 detection channels, Switchable conventional/spectral | Core facility flexibility, Assay development |
These integrated systems provide the foundation for advanced stem cell screening applications, combining the analytical depth of high-parameter spectral detection with the throughput advantages of acoustic-assisted sample processing [22] [24] [26]. The automation features, including self-cleaning routines, automated quality control, and plate handling capabilities, make these instruments particularly suitable for extended screening campaigns where reproducibility and operational efficiency are critical success factors [27] [28].
Application Notes for Stem Cell Research
Comprehensive Immunophenotyping of Stem Cell Populations
The combination of spectral cytometry and acoustic focusing enables unprecedented depth in stem cell characterization. For heterogeneous populations such as hematopoietic stem cells (HSCs) or mesenchymal stromal cells (MSCs), high-parameter panels (30+ colors) can simultaneously resolve primitive stem cells, lineage-committed progenitors, and differentiated progeny from a single sample aliquot—a crucial advantage when working with precious, low-yield samples [23]. The implementation of a 28-color panel for hematopoietic stem and progenitor cell (HSPC) analysis demonstrates this capability, incorporating markers for stemness (CD34, CD90, CD133), lineage commitment (CD14, CD19, CD11b), functional status (CD38, CD45RA, CD123), and exclusion markers (CD3, CD235a) in a single tube [23]. The spectral platform's ability to resolve dyes with significant emission overlap, such as Brilliant Violet 421 and Brilliant Ultra Violet 395, enables panel configurations that would be challenging with conventional cytometry [27] [22]. When processing bone marrow aspirates or mobilized peripheral blood samples on acoustic-focused instruments, researchers can achieve sample throughput rates up to 40% faster than conventional systems while maintaining population resolution, enabling rapid analysis of multiple donor samples with minimal inter-assay variation [24] [25].
Rare Population Analysis in Stem Cell Screening
Detection and characterization of rare stem cell subsets represents a powerful application for integrated HT-FC systems. For cancer stem cell (CSC) research, spectral technology provides the sensitivity needed to identify populations at frequencies below 0.01% through optimized signal-to-noise ratios and reduced spectral overlap [23]. The implementation of autofluorescence extraction algorithms further enhances rare population detection by removing background signals that can obscure dimly positive events [23]. When studying minimal residual disease (MRD) in leukemic stem cells post-treatment, researchers have validated spectral panels with sensitivity below 0.001%, enabling detection of residual disease that would be missed by conventional methods [23]. The acoustic focusing component ensures consistent detection sensitivity across a wide range of sample input rates, preventing the decreased sensitivity often observed in conventional systems at high throughput settings [22] [24]. This combination is particularly valuable for screening applications where both rare population detection and high sample throughput are required, such as evaluating stem cell responses to compound libraries in drug discovery pipelines [28] [29].
Experimental Protocols
Protocol 1: High-Parameter Immunophenotyping of Hematopoietic Stem Cells
Objective: Comprehensive 28-color immunophenotypic analysis of human hematopoietic stem and progenitor cells from bone marrow or mobilized peripheral blood samples using spectral flow cytometry with acoustic focusing.
Materials:
- Biological Sample: Human bone marrow aspirate or mobilized peripheral blood
- Staining Buffer: PBS containing 2% FBS and 2 mM EDTA
- Viability Dye: Fixable Viability Stain 780 (FVS780)
- FC Receptor Block: Human TruStain FcX
- Antibody Panel: Pre-titrated antibodies conjugated to 28 fluorochromes
- Erythrocyte Lysis Buffer: Ammonium chloride-based solution
- Fixation Buffer: 1-4% paraformaldehyde in PBS
Procedure:
Sample Preparation
- Collect bone marrow aspirate in sodium heparin tubes or mobilized peripheral blood in EDTA tubes
- Perform erythrocyte lysis using 10 mL ammonium chloride buffer per 1 mL sample, incubate 10 minutes at room temperature
- Centrifuge at 500 × g for 5 minutes, discard supernatant
- Wash cells twice with staining buffer, count cells and adjust concentration to 10 × 10^6 cells/mL
- Pass cells through 70 μm cell strainer to remove aggregates
Viability Staining
- Resuspend 1 × 10^7 cells in 1 mL PBS
- Add 1 μL FVS780 viability dye, incubate 10 minutes at room temperature protected from light
- Add 2 mL staining buffer, centrifuge at 500 × g for 5 minutes
- Discard supernatant completely
FC Receptor Blocking
- Resuspend cell pellet in 100 μL staining buffer
- Add 5 μL Human TruStain FcX, incubate 10 minutes at 4°C
Surface Antibody Staining
- Add pre-mixed antibody cocktail in 100 μL staining buffer
- Vortex gently and incubate 30 minutes at 4°C protected from light
- Add 2 mL staining buffer, centrifuge at 500 × g for 5 minutes
- Discard supernatant, repeat wash step
Fixation
- Resuspend cells in 300 μL fixation buffer
- Incubate 15 minutes at room temperature protected from light
- Add 2 mL staining buffer, centrifuge at 500 × g for 5 minutes
- Resuspend in 500 μL staining buffer for acquisition
Instrument Acquisition
- Power on Attune Xenith flow cytometer, perform automated startup and QC
- Set fluidics to high-throughput mode (1,000 μL/min)
- Load sample tube or plate onto automated sampler
- Acquire 1 × 10^6 events per sample using autosampler protocol
- Record data in .fcs format for spectral unmixing
Table 2: Representative 28-Color Hematopoietic Stem Cell Panel
| Marker | Fluorochrome | Biological Function | Population Identified |
|---|---|---|---|
| CD34 | Brilliant Violet 421 | Stem/progenitor marker | Hematopoietic stem cells |
| CD38 | Brilliant Ultra Violet 395 | Activation/differentiation | Primitive vs. committed |
| CD45RA | Brilliant Violet 510 | Isoform expression | Lymphoid priming |
| CD90 | Brilliant Violet 605 | Thy-1 antigen | Primitive HSCs |
| CD133 | Brilliant Violet 650 | Prominin-1 | Stem/progenitor cells |
| CD123 | Brilliant Violet 711 | IL-3 receptor | Myeloid progenitors |
| CD19 | Brilliant Violet 750 | B-lineage marker | B cells |
| CD3 | Brilliant Blue 515 | T-lineage marker | T cells |
| CD14 | Brilliant Blue 700 | Monocyte marker | Monocytes |
| CD11b | Alexa Fluor 488 | Integrin subunit | Myeloid cells |
| Lineage Cocktail | PerCP-Cy5.5 | Mixed lineage | Differentiated cells |
| CD235a | PE | Glycophorin A | Erythroid cells |
| CD41 | PE-Dazzle 594 | Integrin subunit | Megakaryocytic cells |
| CD45 | PE-Cy5 | Pan-hematopoietic | All hematopoietic cells |
| CD49f | PE-Cy7 | Integrin alpha-6 | HSC adhesion |
| CD110 | APC | MPL receptor | Megakaryocyte potential |
| CD135 | APC-R700 | FLT3 receptor | Lymphoid progenitors |
| CD201 | APC-Fire 810 | EPCR | Endothelial-like HSCs |
Protocol 2: High-Throughput Compound Screening on Stem Cell Populations
Objective: Screen 1,000+ small molecule compounds for effects on stem cell differentiation using integrated acoustic focusing and spectral detection.
Materials:
- Stem Cells: Human pluripotent stem cells (hPSCs) or primary hematopoietic stem cells
- Compound Library: 1,280-compound small molecule collection in 384-well format
- Differentiation Media: Cell type-specific induction media
- Staining Antibodies: 20-color spectral flow cytometry panel
- Cell Dissociation Reagent: Enzyme-free dissociation buffer
- 384-Well Plates: U-bottom, tissue culture-treated plates
Procedure:
Cell Preparation and Plating
- Maintain hPSCs in mTeSR1 medium or HSCs in StemSpan medium
- Dissociate cells to single-cell suspension using enzyme-free reagent
- Count cells and adjust concentration to 1 × 10^6 cells/mL
- Dispense 50 μL cell suspension (50,000 cells) to each well of 384-well plate using multidrop dispenser
- Incubate plates overnight at 37°C, 5% CO2
Compound Treatment
- Using automated liquid handler, transfer 100 nL compound from library stock plates to assay plates
- Include DMSO-only wells as negative controls and known differentiation inducers as positive controls
- Incubate plates for 5-7 days with half-medium changes every 2 days
Sample Processing
- Add 20 μL enzyme-free dissociation buffer to each well
- Incubate 15 minutes at 37°C
- Triturate cells 10 times using automated plate washer with 200 μL pipetting head
- Transfer cell suspensions to 384-well V-bottom plates
High-Throughput Staining
- Add 30 μL surface antibody cocktail in staining buffer to each well
- Centrifuge plates at 500 × g for 3 minutes, incubate 30 minutes at 4°C
- Wash cells twice with 100 μL staining buffer using plate washer
- Resuspend in 60 μL staining buffer containing viability dye
Automated Acquisition
- Load 384-well plate onto Attune Xenith autosampler
- Set acquisition to high-throughput mode with 100 μL/min flow rate
- Acquire 10,000 events per well using rapid well-to-well mixing
- Run system for 8 hours unattended using plate stacker
Data Analysis
- Perform spectral unmixing using instrument software
- Export population frequencies for each well
- Calculate Z'-factor for assay quality control (>0.5 acceptable)
- Identify hit compounds with >3-fold change vs. DMSO controls
The Scientist's Toolkit: Essential Research Reagents and Materials
Table 3: Essential Reagents and Materials for Spectral Flow Cytometry in Stem Cell Research
| Category | Specific Product | Function in Workflow | Technical Notes |
|---|---|---|---|
| Viability Dyes | Fixable Viability Stain 780 | Distinguish live/dead cells | Critical for accuracy in screening assays |
| FC Blocking Reagents | Human TruStain FcX | Reduce non-specific binding | Essential for primary tissue samples |
| Lymphocyte Separation | Ficoll-Paque PLUS | Density gradient separation | Maintains cell viability and function |
| Erythrocyte Lysis | Ammonium Chloride Solution | Remove red blood cells | Fast, effective with minimal effect on targets |
| Cell Staining Buffer | PBS with 2% FBS, 0.09% Azide | Antibody dilution and washing | Preserves epitope integrity |
| Fixation Reagents | 4% Paraformaldehyde | Stabilize stained cells | Enables batch acquisition |
| Intracellular Staining | FoxP3/Transcription Factor Kit | Permeabilization and fixation | For nuclear and cytoplasmic targets |
| Reference Beads | Rainbow Calibration Particles | Instrument calibration | Daily QC and performance tracking |
| Antibody Stabilizer | PBS with 0.5% BSA, 10% Sucrose | Long-term antibody storage | Maintains conjugate stability |
Technology Integration and Data Analysis
Spectral Unmixing and Data Deconvolution
The computational backbone of spectral flow cytometry relies on sophisticated unmixing algorithms that separate composite fluorescent signals into their individual components. The fundamental equation governing this process is:
[ S{measured}(\lambda) = \sum{i=1}^{n} ai \cdot Ri(\lambda) + E(\lambda) ]
Where (S{measured}(\lambda)) is the measured spectrum at wavelength λ, (ai) represents the abundance of fluorochrome i, (R_i(\lambda)) is the reference spectrum for fluorochrome i, and (E(\lambda)) accounts for experimental noise and autofluorescence [23]. Advanced implementations, such as the BD SpectralFX Technology, employ AI-optimized optics and system-aware unmixing algorithms that dynamically adjust for detector noise and signal brightness variations on a cell-by-cell basis, significantly minimizing spillover spreading and accurately managing autofluorescence even in panels exceeding 50 colors [22]. For stem cell researchers, proper implementation requires building a robust reference spectrum database using single-stained controls or compensation beads recorded under identical instrument settings as experimental samples. This approach ensures optimal resolution of closely related stem cell populations, such as distinguishing between multipotent progenitors (MPPs) and lineage-restricted progenitors based on subtle differences in marker expression patterns [23].
Automated Data Analysis Pipelines
The high-dimensional data generated by spectral HT-FC systems necessitates automated analysis workflows to efficiently extract biological insights. Modern computational approaches leverage both traditional gating strategies and unsupervised clustering algorithms to comprehensively map stem cell heterogeneity. For basic analysis, researchers can implement sequential bivariate gating to identify major populations, while for more complex datasets, dimensionality reduction techniques such as t-SNE, UMAP, and FlowSOM clustering provide unbiased visualization of cellular diversity [29]. The integration of artificial intelligence and machine learning represents the cutting edge of flow cytometry data analysis, with algorithms capable of identifying rare populations and subtle phenotypic shifts that might escape manual detection [30] [29]. These automated systems not only reduce analyst bias but also dramatically decrease processing time—a single 384-well plate that might require weeks of manual analysis can be processed in hours using optimized machine learning pipelines [29]. For drug screening applications, automated reporting of population frequencies and statistical significance enables rapid triage of compound hits for further validation, accelerating the stem cell drug discovery pipeline.
Troubleshooting and Quality Control
Optimizing Spectral Panel Design
Successful implementation of high-parameter spectral panels requires careful consideration of fluorochrome combinations and staining conditions. Common challenges include spectral overlap exceeding unmixing capabilities, brightness mismatches between markers, and antibody-fluorochrome incompatibilities. To address these issues, employ panel design tools such as FluoroFinder's Spectra Viewer to visualize potential conflicts before experimental implementation [22]. Follow a systematic staining index optimization protocol: (1) assign brightest fluorochromes to dimmest antigens, (2) spread fluorochromes with similar emission spectra across different laser lines when possible, (3) avoid combining fluorochromes with peak emissions less than 20 nm apart, and (4) validate resolution of critical population separations using control samples [23]. Implement single-stained controls for each fluorochrome in your panel, using either compensation beads or cells with known antigen expression, to build accurate reference spectra. For stem cell markers with particularly dim expression (e.g., CD34 on primitive cells), consider using non-visible fluorochromes in the ultraviolet or infrared ranges to minimize background interference [27].
Maintaining System Performance
Consistent data quality in HT-FC workflows depends on rigorous quality control procedures and proper instrument maintenance. Implement a daily quality control protocol including: (1) running calibration beads to verify laser delays and detector voltages, (2) performing spectral unmixing verification using multicolor control beads, and (3) monitoring core stream stability through visual inspection of side scatter plots [27]. For acoustic-focused systems, regularly check for proper ultrasonic transducer function by monitoring sample core width during high-speed acquisition—increased CV values may indicate suboptimal acoustic alignment requiring service intervention [24]. Maintain fluidic system integrity through regular cleaning cycles and use of filtered sheath fluid to prevent nozzle clogs, particularly when working with complex stem cell samples containing cellular aggregates or debris. Document performance metrics over time using statistical process control methods to identify gradual performance degradation before it impacts experimental results. For automated systems, establish regular maintenance schedules for plate loaders, robotic arms, and fluidic interfaces to minimize unplanned downtime during extended screening campaigns [28].
From Workflow to Discovery: Implementing High-Throughput Screening and Phenotypic Assays
The integration of high-throughput flow cytometry (HTFC) into stem cell research represents a paradigm shift, enabling the rapid, multiparametric analysis necessary for advanced drug discovery and therapeutic development. Stem cells, with their unique capabilities for self-renewal and differentiation, reside in complex heterogeneous populations where rare cells, such as cancer stem cells (CSCs), dictate biological outcomes [12]. Traditional flow cytometry, while valuable for its single-cell resolution, has been limited by labor-intensive protocols and relatively low throughput [31]. The creation of a fully automated, high-content HTFC workflow capable of processing 50,000 wells per day successfully addresses these limitations [32]. This application note details the protocols and analytical frameworks for implementing such a system within stem cell screening research, providing scientists with a blueprint for achieving unprecedented scale in phenotypic screening without sacrificing data quality.
The Automated High-Throughput Flow Cytometry Platform
Core System Configuration
The described automated platform is engineered from the ground up to overcome the traditional bottlenecks of sample preparation and data acquisition in flow cytometry. At its heart, the system combines a modular robotic sample handling system (e.g., HighRes Biosolutions) with a high-speed flow cytometer (e.g., IntelliCyt iQue Screener PLUS or ZE5 Cell Analyzer) [32] [33]. This integration facilitates continuous, unattended operation, crucial for achieving a daily throughput of 50,000 wells. The system's elevated event rate of 100,000 events per second prevents data loss from electronic aborts, while its universal plate loader with integrated shaking and temperature control ensures sample integrity during processing [31] [32].
Key System Capabilities and Specifications
Table 1: Key Specifications of the Automated HTFC Platform
| Parameter | Specification | Impact on Throughput |
|---|---|---|
| Theoretical Throughput | 50,000 wells per day [32] | Enables large-scale compound and antibody screening campaigns. |
| Event Rate | Up to 100,000 events/second [31] | Prevents electronic aborts and data loss during high-speed acquisition. |
| Plate Compatibility | 384-well and 1536-well formats [32] | Significantly reduces sample preparation and acquisition time versus tubes. |
| Assay Multiplexing | Yes (multiple cell lines or conditions per well) [33] | Increases data density per well, maximizing information from each experiment. |
| Data Output | Multi-parameter, high-content cell data [32] | Provides simultaneous analysis of phenotype, function, and concentration. |
Protocols for Automated Stem Cell Screening
Protocol 1: High-Throughput Screening of Modulators in Hematopoietic Stem Cell Differentiation
This protocol is designed to identify small molecules or antibodies that influence the differentiation of hematopoietic stem and progenitor cells (HSPCs) into specific lineages, such as megakaryocytes.
1. Sample Preparation and Plating:
- Cell Source: Isolate human CD34+ HSPCs from cord blood via immunomagnetic selection (e.g., using Miltenyi Biotec kits) and confirm purity by flow cytometry [32] [34].
- Cell Culture: Differentiate CD34+ cells into megakaryocytes in serum-free medium supplemented with cytokines (TPO, FLT3-ligand, IL-6, SCF) for 14 days [32].
- Plate Preparation: Use a liquid handler to dispense differentiated cells at a density of 1x10^4 cells per well into 384-well plates pre-spotted with DMSO (negative control), experimental compounds, and a positive control (e.g., 5 µM CHIR99021) [32].
2. Automated Staining and Analysis:
- Staining Cocktail: Prepare a master antibody cocktail containing CD41-PE (1:500) and CD42-APC (1:250) to label megakaryocytes [32].
- Automated Processing: The robotic system executes all subsequent steps:
- Adds antibody cocktail to each well.
- Incubates plates in the dark for a predetermined time.
- Washes cells and resuspends them in FACS buffer containing a viability dye.
- Data Acquisition: Plates are automatically loaded onto the HTFC instrument, which acquires data for all wells.
3. Data Analysis:
- The percentage of CD41+/CD42+ cells in each well is quantified, normalized to controls, and analyzed to identify hits that significantly enhance megakaryocyte differentiation [32].
Protocol 2: Phenotypic Screening for T-Regulatory Cell Induction
This protocol outlines a multiplexed approach to screen for compounds that induce the formation of T-regulatory (Treg) cells from primary human CD4+ T-cells, relevant for immune-oncology and autoimmune disease research.
1. Sample Preparation and Plating:
- Cell Source: Purify naive CD4+ T-cells from human leukapheresis samples using a CD4+ T-cell isolation kit [32].
- Cell Stimulation: Plate cells at 0.5 x 10^6 cells/mL in media containing anti-CD3/anti-CD28-coated beads and a low dose of TGF-β to create a permissive environment for Treg induction [32].
- Compound Addition: Simultaneously add a library of test compounds to the cultures. Incubate for 6 days at 37°C and 5% CO2.
2. Automated Intracellular Staining:
- The automated system performs a complex staining protocol:
- Surface Staining: Adds antibodies against CD4 and CD25.
- Fixation/Permeabilization: Uses a Foxp3 Fix/Perm buffer set.
- Intracellular Staining: Adds an antibody against the key Treg transcription factor, Foxp3 [32].
3. Data Acquisition and Analysis:
- The HTFC instrument acquires data, and analysis software is used to gate on the CD4+CD25+Foxp3+ Treg population. Compounds that increase the frequency of this triple-positive population are identified as hits [32].
Experimental Validation & Data Analysis
Application in Cancer Stem Cell (CSC) Research
The automated HTFC platform has proven highly effective in identifying novel CSC-specific targets. A screening campaign on patient-derived glioblastoma (GBM) cells successfully identified Junctional Adhesion Molecule-A (JAM-A) as a critical adhesion receptor for CSC maintenance [13].
Table 2: Key Reagent Solutions for CSC Screening
| Research Reagent | Function in the Experiment |
|---|---|
| Patient-Derived GBM Xenografts | Biologically relevant source of CSCs for screening [13]. |
| Fluorescently-Conjugated Antibodies | Enable detection of cell surface adhesion receptors via flow cytometry [13]. |
| JAM-A Antibody | Key reagent for validating target identity and function in follow-up studies [13]. |
| Integrin α6 and β1 Antibodies | Used as positive controls, as they are known markers/enrichment factors for CSCs [13]. |
In this study, six different GBM specimens were uniquely barcoded, pooled, and screened against a panel of adhesion molecule antibodies. JAM-A was identified as a top candidate because it was highly expressed on CSCs and its high expression correlated negatively with glioma patient survival, underscoring its clinical relevance [13]. Functional validation confirmed that targeting JAM-A compromised CSC self-renewal and tumor growth without harming normal neural stem cells [13].
Workflow and Signaling Pathway Visualization
The following diagrams illustrate the core screening workflow and the functional role of a key target identified through this platform.
Diagram 1: Automated HTFC Screening Workflow
Diagram 2: JAM-A in Cancer Stem Cell Maintenance
The Scientist's Toolkit
Essential Materials and Reagents
- Primary Cells: Patient-derived xenograft cells, human CD34+ HSPCs, primary human T-cells. The use of biologically relevant cells is paramount for phenotypic screening [32] [13].
- Cell Culture Reagents: Serum-free media, cytokine cocktails (TPO, SCF, FLT3-ligand, IL-6), and differentiation factors specific to the stem cell type being studied [32].
- Antibodies: Titrated, pre-mixed antibody cocktails for surface markers (e.g., CD34, CD41, CD42, CD4, CD25) and intracellular targets (e.g., Foxp3). Pre-mixing enhances reproducibility and speed [31] [32].
- Staining Buffer: FACS buffer (e.g., PBS with 3% FBS, 5 mM EDTA, and 0.1% sodium azide) with added DNase and EDTA to minimize cell clumping [31] [32].
- Automation-Compatible Labware: 384-well and 1536-well microplates, and low-retention tips to ensure accurate liquid handling by robotic systems [32].
Instrumentation and Software
- Robotic Liquid Handler: A system capable of performing precise aspiration, dispensing, and plate washing (e.g., GNF Systems washer-dispenser) [32].
- High-Throughput Flow Cytometer: An analyzer with a high event rate and plate loader, such as the IntelliCyt iQue Screener PLUS or Bio-Rad ZE5 Cell Analyzer [31] [33].
- Data Analysis Software: Advanced informatics solutions capable of handling multi-parameter, high-content data for hit identification and advanced analyses like UMAP [32] [34].
The implementation of a fully automated HTFC workflow, as detailed in these application notes, successfully bridges the gap between complex phenotypic stem cell assays and the demanding throughput requirements of modern drug discovery. The ability to process 50,000 wells per day in a multiplexed, high-content manner allows researchers to deconstruct stem cell heterogeneity with unparalleled statistical power [32]. This platform has already proven its value by uncovering novel therapeutic targets like JAM-A in glioblastoma and identifying compounds that modulate hematopoietic and immune cell differentiation [32] [13]. As flow cytometry technology continues to advance with spectral cytometry, AI-powered data analysis, and even higher levels of automation, its role as a cornerstone technology in stem cell research and therapy development is firmly established [12] [19].
Traditional preclinical models often fall short in predicting clinical outcomes due to limited physiological relevance and lack of critical cellular interactions present in living organisms [35]. The emergence of three-dimensional (3D) culture systems and immune co-culture approaches offers a more representative platform for evaluating anti-cancer therapeutics and immunomodulatory compounds [35] [36]. However, analyzing these complex systems at scale requires robust, high-throughput methodologies capable of capturing multidimensional data at single-cell resolution.
High-throughput flow cytometry has emerged as a powerful solution to this challenge, enabling multiparametric phenotyping and functional assessment within complex co-culture environments [35] [37] [38]. Modern flow cytometers can make optical measurements of 10 or more parameters per cell at tens-of-thousands of cells per second with over five orders of magnitude dynamic range, providing unparalleled quantitative precision for drug screening applications [37]. When integrated with advanced co-culture models that better replicate human physiology, this approach enables more predictive phenotypic drug discovery while reducing reliance on traditional animal testing [39].
Table 1: Comparison of Co-culture Model Systems for Phenotypic Screening
| Model Type | Key Components | Primary Applications | Throughput Capability |
|---|---|---|---|
| TumorGraft3D Co-culture [35] | PDX-derived tumor cells + immune cells | IO drug development, T cell activation studies | High (384-well format) |
| PBMC-based Immunomodulatory [40] | Peripheral blood mononuclear cells + autologous plasma | Vaccine adjuvant discovery, immunomodulator identification | High (384-well format) |
| Tumor Organoid-Immune [36] | Patient-derived tumor organoids + immune populations | Immunotherapy testing, immune-tumor interactions | Medium (96-well format) |
Co-culture Models and Their Applications
TumorGraft3D-Immune Co-culture Platform
Champions Oncology has developed a sophisticated co-culture system using patient-derived xenograft (PDX) models cultured in 3D format [35]. This platform demonstrates high concordance in phenotypic profiles between original PDX tumors and 3D-cultured models across various cancer types including colon, breast, and lung. The integration of immune cells creates a more physiologically relevant microenvironment for evaluating therapeutic responses.
In both monoculture and immune co-culture formats, this system quantifies responses to standard-of-care drugs and immune-mediated tumor killing [35]. The platform can detect T cell activation markers (CD69), immune checkpoint expression (PD-1, TIM-3, CTLA-4), and apoptosis markers following immune or drug challenge. This enables rapid screening of immuno-oncology agents for T cell activation, ADCC activity, reversal of T cell exhaustion, and tumor cell killing [35].
PBMC-based Immunomodulatory Screening Platform
A robust protocol for high-throughput screening of immunomodulatory compounds utilizes human peripheral blood mononuclear cells (PBMCs) cultured in autologous plasma to model the human immune response [40]. This system enables multiplexed readouts including cytokine secretion profiling and cell surface activation marker expression via flow cytometry.
Cryopreserved PBMCs are incubated for 72 hours with small molecule libraries, after which supernatants are harvested for cytokine measurement (TNF-α, IFN-γ, IL-10) via AlphaLISA assays [40]. Simultaneously, cells are fixed and stained for innate immune activation markers (CD80, CD86, HLA-DR, OX40) for high-throughput flow cytometry analysis. This integrated approach facilitates phenotypic identification of novel immunomodulators and potential vaccine adjuvant candidates [40].
Tumor Organoid-Immune Co-culture Models
Tumor organoids have emerged as a highly realistic platform for investigating tumor growth and development, closely mimicking the biological properties and drug responses of primary tumors [36]. However, a limitation of traditional tumor organoids is their lack of diverse cellular composition, particularly immune cells. Co-culturing tumor organoids with immune cells has emerged as an innovative research strategy to model the dynamic interplay between tumors and the immune system [36].
These advanced co-culture models enable researchers to observe how immune cells influence tumor growth and progression. For instance, Dijkstra et al. developed a co-culture platform combining peripheral blood lymphocytes and tumor organoids to enrich tumor-reactive T cells from patients with mismatch repair-deficient colorectal cancer and non-small cell lung cancer [36]. Their findings demonstrated that these T cells could effectively assess cytotoxic efficacy against matched tumor organoids, establishing a methodology to evaluate sensitivity of tumor cells to T cell-mediated attacks at an individualized patient level [36].
Diagram 1: Co-culture Screening Workflow. This diagram illustrates the integrated process from co-culture establishment through multiparametric flow cytometry analysis to phenotypic readout assessment.
High-Throughput Flow Cytometry Platforms
HyperCyt Technology for High-Throughput Screening
Conventional flow cytometers using "sip-and-spit" sampling technology have been restricted to low sample throughput applications [37]. The advent of HyperCyt sampling technology has revolutionized primary screening applications by enabling analysis of tens-of-thousands of compounds per day [37]. This system alternately aspirates samples and air bubbles into a sample line, delivering a segmented sample stream to the flow cytometer via a continuously rotating peristaltic pump.
For highest throughput, aspirated samples are typically 1-2 μL in volume, enabling processing of a 384-well plate in 10 minutes or less [37]. In contrast to the "sip-and-spit" approach, total assay volumes can be as small as 4-5 μL with each aspirated sample analyzed in its entirety, with little measurable dead volume. This technology has been successfully applied to screen more than 60 biological targets, producing more than 13 million data values accessible via PubChem [37].
Target Multiplexing with Bead-Based Approaches
A particularly attractive feature of flow cytometry for drug screening is the high-dimensionality of data that can be obtained [37]. The broad intensity response range of modern instruments (5 orders of magnitude or more) can be exploited for intensity encoding of cells and beads to produce exceptionally high levels of dimensionality.
The bead-based xMAP system from Luminex Corporation exemplifies this approach, using intensity encoding with 10 concentrations each of red and orange fluorescent dyes to produce 100 sets of distinguishable beads [37]. Each bead set can be engineered to express or capture a different target analyte, with a green fluorescent reporter molecule used to quantify the analyte in a third optical parameter channel. This enables quantification of 100 analyte targets in a single well using only 3 fluorescence channels [37].
Table 2: Quantitative Parameters in Flow Cytometry-Based Screening
| Parameter Category | Specific Measurements | Detection Methods | Application in Screening |
|---|---|---|---|
| Cell Surface Markers [35] [40] | CD69, PD-1, TIM-3, CTLA-4, CD80, CD86, HLA-DR, OX40 | Fluorescent antibody staining | Immune activation status, checkpoint expression |
| Intracellular Markers [35] [41] | Phosphorylation events, cytokine production, apoptosis markers | Cell permeabilization + intracellular staining | Signaling pathway activation, cell death mechanisms |
| Secreted Factors [40] | TNF-α, IFN-γ, IL-10 | AlphaLISA assay of supernatant | Cytokine profiling, immunomodulation assessment |
| Functional Assays [42] [41] | Apoptosis (Annexin V/TOPRO-3), cell cycle (propidium iodide) | Vital dyes, DNA binding dyes | Compound toxicity, proliferation effects |
Detailed Experimental Protocols
Protocol 1: High-Throughput Immunomodulatory Compound Screening
This protocol describes a standardized workflow for screening immunomodulatory compounds using PBMCs in 384-well format with multiparametric readouts [40].
Materials and Equipment
- Biological Materials: Cryopreserved human PBMCs (5×10⁷ cells/mL), autologous platelet-poor plasma (PPP)
- Compound Libraries: Small molecule libraries dissolved in DMSO
- Stimulation Reagents: R848 (25 μM), CpG ODN-2395 (1 μM)
- Antibodies: CD134 (OX40)-APC, CD80-PE, CD19-VioBlue, HLA-DR-FITC, CD86-PE (all diluted 1:200 with dPBS)
- Consumables: Corning 3656 384-well clear round bottom non-treated plates, AlphaPlate-384 light gray untreated plates
- Equipment: Thermo Multidrop Combi Reagent Dispenser, IntelliCyt iQue Screener PLUS flow cytometer, Agilent (Velocity11) VPrep for supernatant extraction, Perkin Elmer EnVision plate reader
Step-by-Step Procedure
Preparation of PBMCs
- Thaw autologous PPP completely in a 37°C water bath
- Centrifuge thawed plasma at 3000 × g for 8 minutes (high acceleration/medium deceleration)
- Transfer supernatant to a new 15 mL tube under sterile conditions, avoiding sediments
- Thaw human PBMCs in a 37°C water bath and transfer 1 mL to a new 50 mL tube
- Use 2 mL of autologous PPP to collect remaining cells from cryotube and transfer to the 50 mL tube
- Add 27 mL of Dulbecco's Modified Eagle Medium (DMEM) to the PBMC/plasma mixture
Compound Treatment and Cell Culture
- Dispense 45 μL of cell suspension (containing 2.5×10⁵ cells) into each well of 384-well plates
- Pin 100 nL of compound libraries or controls (DMSO vehicle, reference compounds) into appropriate wells using a compound transfer robot
- Add 5 μL of stimulation reagents (R848, CpG) or media to appropriate wells
- Culture cells for 72 hours at 37°C in a humidity-controlled CO₂ incubator
Supernatant Collection and Cytokine Analysis
- Following incubation, extract 20 μL supernatant using liquid handler for AlphaLISA analysis
- Prepare AlphaLISA acceptor bead cocktail (5 mg/mL acceptor beads + 500 nM biotinylated antibody in 1X AlphaLISA buffer)
- Add 5 μL acceptor bead cocktail to 5 μL supernatant in AlphaPlate-384 plates
- Incubate for 1 hour at room temperature in the dark
- Add 10 μL donor bead cocktail (5 mg/mL donor beads in 1X AlphaLISA buffer)
- Incubate for 30 minutes at room temperature in the dark
- Read plates on Perkin Elmer EnVision plate reader
Cell Staining and Flow Cytometry Analysis
- Add 20 μL of 250 μM EDTA to each well of cell culture plates to detach adherent cells
- Incubate for 10 minutes at room temperature
- Add 20 μL of 1% paraformaldehyde (prepared from 16% stock diluted with dPBS) to fix cells
- Incubate for 20 minutes at room temperature in the dark
- Centrifuge plates at 500 × g for 5 minutes and carefully decant supernatant
- Add 20 μL antibody cocktail in dPBS to each well
- Incubate for 30 minutes at room temperature in the dark
- Add 100 μL dPBS to each well and analyze immediately on IntelliCyt iQue Screener PLUS
Diagram 2: Immunomodulatory Screening Protocol. This workflow illustrates the parallel processing of samples for cytokine analysis and cell surface marker detection.
Protocol 2: TumorGraft3D Co-culture Screening for IO Applications
This protocol outlines the establishment and screening of patient-derived tumor organoids co-cultured with immune cells for immuno-oncology applications [35].
Materials and Equipment
- Biological Materials: Patient-derived tumor organoids, peripheral blood lymphocytes or immune cell subsets
- Extracellular Matrix: Matrigel or similar ECM substrate
- Culture Media: Organoid growth medium with essential factors (Wnt3A, R-spondin-1, Noggin, EGF)
- Antibodies: CD45, CD3, CD8, CD69, PD-1, TIM-3, CTLA-4, Annexin V, viability dyes
- Consumables: 384-well ultra-low attachment plates, cell culture reagents
- Equipment: High-throughput flow cytometer with HyperCyt or similar sampling system
Step-by-Step Procedure
Preparation of Tumor Organoids
- Thaw or passage patient-derived tumor organoids in appropriate growth medium
- Embed organoids in Matrigel droplets (50% Matrigel concentration) in 384-well plates
- Culture for 3-7 days until organoids reach appropriate size and maturity
- Refresh medium every 2-3 days with appropriate growth factors
Immune Cell Preparation and Co-culture Establishment
- Isolate peripheral blood lymphocytes or specific immune subsets from donor blood
- Activate T cells if necessary using anti-CD3/CD28 beads or cytokines
- Seed immune cells into organoid-containing wells at appropriate effector:target ratios
- Add compound libraries using liquid handling systems
- Co-culture for 24-120 hours depending on experimental objectives
Multiparametric Flow Cytometry Analysis
- Harvest cells from co-culture systems using gentle dissociation methods
- Stain with viability dye to exclude dead cells from analysis
- Stain surface markers for immune cell identification (CD45, CD3, CD4, CD8)
- Stain activation markers (CD69), checkpoint inhibitors (PD-1, TIM-3, CTLA-4)
- Stain apoptosis markers (Annexin V) if assessing cell death
- For intracellular staining, permeabilize cells and stain for cytokines or proliferation markers
- Analyze using high-throughput flow cytometer with automated sampling
- Collect at least 10,000 events per sample for robust statistical analysis
Data Analysis and Hit Identification
- Apply gating strategies to distinguish tumor cells from immune populations
- Use fluorescence minus one (FMO) controls to set positive gates
- Quantify percentage of positive cells and mean fluorescence intensity (MFI) for markers
- Calculate fold-changes relative to vehicle controls
- Apply statistical thresholds (e.g., Z-score > 3) for hit identification
- Use multivariate analysis for multiparametric data integration
The Scientist's Toolkit: Essential Research Reagents and Materials
Table 3: Key Research Reagent Solutions for Co-culture Screening
| Reagent Category | Specific Examples | Function in Assay | Considerations for Use |
|---|---|---|---|
| Cell Culture Matrices [36] | Matrigel, ECM extracts, synthetic hydrogels | 3D structural support for organoids | Lot-to-lot variability, growth factor content |
| Cell Separation Media [42] [40] | Ficoll-Paque, Percoll, dextran solutions | Isolation of specific cell populations from blood | Preservation of cell function, minimization of activation |
| Viability & Apoptosis Reagents [42] [41] | Propidium iodide, Annexin V, TOPRO-3, 7-AAD | Discrimination of live/dead cells, apoptosis quantification | Compatibility with fixation, spectral overlap |
| Cell Activation Reagents [40] | R848, CpG ODN, anti-CD3/CD28 beads | Positive controls for immune activation | Concentration optimization, kinetics |
| Cytokine Detection Kits [40] | AlphaLISA kits (TNF-α, IFN-γ, IL-10) | Multiplexed cytokine quantification from supernatant | Sensitivity, dynamic range, interference |
| Flow Cytometry Antibodies [35] [40] | CD markers, checkpoint inhibitors, activation markers | Cell phenotyping and functional assessment | Titration requirements, spectral compatibility |
| Cell Fixation/Permeabilization [41] | Paraformaldehyde, ethanol, Triton X-100 | Cell preservation and intracellular access | Impact on epitope recognition, autofluorescence |
Data Analysis and Interpretation Strategies
Gating Strategies for Complex Co-cultures
Analyzing flow cytometry data from co-culture systems requires sophisticated gating strategies to distinguish different cell populations and their functional states [43] [44]. Initial gating typically begins with forward scatter (FSC) versus side scatter (SSC) plots to identify intact cells and exclude debris [43]. Subsequent gates are applied to eliminate doublets using pulse width versus pulse area analysis, ensuring that only single cells are included in further analysis [41].
For immune cell-tumor co-culture systems, fundamental separation is achieved using lineage markers such as CD45 to distinguish hematopoietic cells from tumor cells [35]. Further subgating of immune populations uses CD3, CD4, CD8, CD19, and CD56 to identify T cell subsets, B cells, and NK cells respectively [40]. Within these populations, activation status is determined using markers such as CD69, while exhaustion profiles are assessed through PD-1, TIM-3, and CTLA-4 expression [35].
Multiparametric Data Analysis Approaches
The high-dimensional data generated from flow cytometry-based screening enables deep profiling of compound effects but requires specialized analysis approaches [38]. For target-based screening, results are often expressed as percent inhibition or percent activation relative to controls, with hit identification based on statistical thresholds such as Z-scores [38].
Phenotypic screening data typically requires more complex analytical frameworks incorporating multiple parameters simultaneously [38]. Multivariate analysis techniques including principal component analysis (PCA) and t-distributed stochastic neighbor embedding (t-SNE) can help visualize complex relationships in high-dimensional data [38]. For large-scale screening efforts, machine learning algorithms are increasingly employed to identify patterns that may not be apparent through conventional gating strategies [38].
When calculating percentages from nested gates, it is essential to back-calculate to the total population [43]. For example, if 30.1% of the total population are neutrophils, and 14.5% of neutrophils express IL-17a, then 4.36% (30.1 × 0.145) of the total sample are IL-17a-expressing neutrophils [43]. This approach ensures accurate quantification of rare populations within complex co-cultures.
The integration of complex co-culture models with high-throughput flow cytometry represents a transformative approach in phenotypic drug discovery [35] [36]. These advanced systems bridge the gap between traditional in vitro models and in vivo physiology, providing more predictive platforms for evaluating therapeutic candidates [39]. The multiparametric single-cell data generated through flow cytometry-based screening delivers unprecedented insights into compound mechanisms and cellular responses, enabling more informed decision-making in early drug discovery [37] [38].
As regulatory landscapes evolve toward reduced animal testing, these physiologically relevant models are poised to play an increasingly central role in drug development pipelines [39]. Continued advancements in 3D culture techniques, microfluidic integration, and analytical capabilities will further enhance the throughput and predictive power of these systems, accelerating the discovery of novel therapeutics for complex diseases [35] [36].
Cancer stem cells (CSCs) reside in specialized niches that regulate the balance between self-renewal and differentiation through adhesion mechanisms, making these interactions promising therapeutic targets [45] [13]. Like normal stem cells, CSCs rely on niche interactions to regulate self-renewal and differentiation, providing pro-survival and therapeutic resistance mechanisms [13]. In glioblastoma (GBM), CSCs are contained within hypoxic and perivascular niches, with adhesion status determining a cell's position within the tumor hierarchy [13].
This case study details the application of high-throughput flow cytometry screening to identify junctional adhesion molecule A (JAM-A) as a critical CSC maintenance factor, outlining the experimental protocols, data analysis, and therapeutic implications of these findings for researchers and drug development professionals.
Background & Scientific Rationale
The CSC Niche Adhesion Paradigm
The interaction between cell adhesion mechanisms generates diverse signaling responses based on cell type, location, and receptor clustering. While similarities exist between CSCs and non-neoplastic stem cells, defining adhesion-specific programs unique to the CSC niche compartment remains challenging as many programs exist in both normal and neoplastic contexts [13]. For example, integrin α6 expression enriches both normal stem cells and CSCs and plays a key role in regulating their growth [13].
JAM-A Biology
JAM-A is a type I transmembrane glycoprotein belonging to the immunoglobulin superfamily, composed of an extracellular domain with two Ig-like loops, a single membrane-spanning region, and a short cytoplasmic tail terminating in a PDZ-binding motif [46]. It facilitates homophilic interactions critical for cell-cell adhesion, leukocyte migration, platelet activation, and angiogenesis [46]. The C-terminal PDZ binding motif facilitates interactions with various scaffold proteins, including Zona Occludens 1 (ZO-1), Afadin-6 (AF-6), and Partitioning defective 3 homolog (PARD3) [46].
Experimental Workflow & Methodologies
High-Throughput Flow Cytometry Screening Protocol
dot Source Code for High-Throughput Screening Workflow
Diagram 1: High-throughput screening workflow for identifying JAM-A as a CSC maintenance factor.
Cell Preparation and Barcoding
- Cell Sources: Utilize 6 different patient-derived GBM specimens with validated differences in self-renewal capacity both in vitro and in vivo [13].
- Barcoding Approach: Each specimen is uniquely identified using a barcoding approach, then all xenografts are pooled together for screening procedures [13].
- Cell Staining: Screen cell adhesion molecules for which antibodies are commercially available, focusing on receptors expressed above 5% for 3 of the 6 GBM specimens [13].
Instrumentation and Data Acquisition
- Flow Cytometry Analysis: Utilize high-throughput flow cytometers capable of rapid sample processing; consider systems with autosamplers for enhanced throughput [47].
- Data Processing: Use appropriate software (e.g., FlowJo, HyperView) for data analysis and visualization [47].
Data Analysis and Bioinformatics Correlation
Survival Correlation Analysis
- Database Integration: Correlate expression of adhesion receptors with patient survival using the National Cancer Institute REpository for Molecular BRAin Neoplastic Data (NCI REMBRANDT) database [13].
- Selection Criteria: Rank identified cell adhesion receptors based on negative correlation to glioma patient survival [13].
Comparative Data Analysis
- Statistical Tools: Utilize data comparison tools (e.g., JMP Compare Data Tables) to align datasets and identify significant differences across experimental conditions [48] [49].
- Key Alignment: Align rows with a key rather than automatically matching rows to ensure accurate comparison of corresponding data points [48].
Results & Data Analysis
Screening Outcomes and Target Identification
The flow cytometry screen identified nine cell surface adhesion receptors that met selection criteria and showed negative correlation with glioma patient survival.
Table 1: Adhesion Receptors Identified in High-Throughput Screen
| Receptor | Alternate Name | Expression Threshold | Median Survival (Months) | Known CSC Association |
|---|---|---|---|---|
| CD321 | JAM-A | >5% in 3/6 specimens | 13.4 | Novel target |
| CD63 | Tetraspannin family member | >5% in 3/6 specimens | Not specified | Novel target |
| CD87 | Urokinase receptor | >5% in 3/6 specimens | Not specified | Linked to GBM survival and invasion |
| CD49e | Integrin α5 | >5% in 3/6 specimens | Not specified | Novel target |
| CD26 | Dipeptidyl peptidase-4 | >5% in 3/6 specimens | Not specified | Colon CSC metastasis regulator |
| CD54 | ICAM1 | >5% in 3/6 specimens | Not specified | Novel target |
| CD29 | Integrin β1 | >5% in 3/6 specimens | Not specified | Published CSC marker |
| CD44 | Hyaluronic acid receptor | >5% in 3/6 specimens | Not specified | Published CSC marker |
| CD49f | Integrin α6 | >5% in 3/6 specimens | Not specified | Published CSC marker |
JAM-A as a Priority Target
JAM-A emerged as a priority target based on its role in cell-to-cell adhesion and facilitation of integrin signaling [13]. These functions had not been previously tested in GBM and represent an important mechanism for CSC communication with the niche's extracellular matrix [13].
Table 2: JAM-A Expression and Functional Correlations Across Cancers
| Cancer Type | JAM-A Expression | Functional Role | Clinical Correlation |
|---|---|---|---|
| Glioblastoma (GBM) | Elevated in CSCs vs. normal brain | CSC maintenance, self-renewal, tumor growth | Negative correlation with patient prognosis [45] [13] |
| Multiple Myeloma | Elevated in patient-derived plasma cells | Migration, colony formation, chemotaxis, proliferation, viability | Poor prognosis, drug resistance [46] |
| Diffuse Large B-Cell Lymphoma | Highly expressed in patients with multiple extranodal lesions | Maintains B-lymphoma cell stemness, invasion, EMT | Associated with extranodal involvement, shorter PFS [50] |
Functional Validation Protocols
JAM-A Loss-of-Function Experiments
Self-Renewal Assessment
- Sphere Formation Assay: Target JAM-A in patient-derived GBM cells and assess sphere formation capacity as a measure of self-renewal [45] [13].
- Validation: Demonstrate compromised self-renewal upon JAM-A targeting while confirming dispensability for normal neural stem/progenitor cell function [45].
In Vivo Tumorigenicity
- Xenograft Models: Utilize murine xenograft models to evaluate the effect of JAM-A inhibition on tumor growth and progression [46].
- Therapeutic Assessment: Treat with anti-JAM-A monoclonal antibodies and monitor tumor progression and dissemination [46].
Mechanism of Action Studies
dot Source Code for JAM-A Signaling Mechanism
Diagram 2: JAM-A signaling mechanism in CSC maintenance and therapeutic targeting.
Signaling Pathway Analysis
- Pathway Profiling: Perform PCR gene array and RNA sequencing to identify signaling pathways activated by JAM-A overexpression [50].
- Inhibitor Studies: Utilize specific pathway inhibitors (e.g., TGF-β/NODAL/Smad inhibitor SB431542) to confirm mechanism [50].
Stemness and EMT Evaluation
- Stem Cell Markers: Assess expression of cancer stem-cell markers (CD133, CD34) following JAM-A modulation [50].
- EMT Markers: Evaluate epithelial (E-Cadherin) and mesenchymal (Fibronectin, Vimentin) markers to determine JAM-A's role in epithelial-to-mesenchymal transition [50].
The Scientist's Toolkit: Research Reagent Solutions
Table 3: Essential Research Reagents for JAM-A and CSC Screening Studies
| Reagent/Resource | Specific Example | Application | Experimental Consideration |
|---|---|---|---|
| Cell Lines | Patient-derived GBM cells, THP-1, RPMI-8226, DB, SU-DHL-4 | Screening, functional validation | Ensure authentication, monitor drift [13] [47] |
| Antibodies for Flow Cytometry | Anti-JAM-A FITC (clone OV5B8), CD274 (PD-L1) PE (clone MIH1) | Target detection, phenotyping | Validate specificity, titrate concentration [47] [46] |
| Small Molecule Inhibitors | JAK Inhibitor I, SB431542 | Pathway inhibition, mechanism studies | Optimize concentration, monitor toxicity [47] [50] |
| siRNA/shRNA | JAM-A targeted sequences: 5'-GAAGUGAAGGAGAAUUCAATT-3' | Gene silencing, functional studies | Include non-targeting controls, optimize delivery [46] |
| Cytokines/Stimuli | IFN-γ recombinant human protein | Induction of target expression | Aliquot for single use, optimize timing [47] |
| Cell Culture Media | RPMI 1640 with FBS, antibiotic-antimycotic | Cell maintenance, assays | Quality test, limit storage duration [47] |
| Flow Cytometry Instruments | FACS Canto II, CyAn ADP, HyperCyt Autosampler | High-throughput screening | Regular calibration, standardized protocols [47] [46] |
Discussion & Therapeutic Implications
JAM-A as a Therapeutic Target
The identification of JAM-A through high-throughput flow cytometry screening demonstrates the power of this approach for discovering novel therapeutic targets. JAM-A represents a promising target because:
- Differential Expression: JAM-A expression is reduced in normal brain versus GBM, and it is dispensable for normal neural stem/progenitor cell function, suggesting a potential therapeutic window [45] [13].
- Multi-Cancer Relevance: JAM-A's role extends beyond GBM to multiple myeloma and diffuse large B-cell lymphoma, indicating broad significance in oncology [46] [50].
- Biomarker Potential: Circulating soluble JAM-A (sJAM-A) shows promise as a serum-based marker for clinical stratification [46].
Clinical Translation
Therapeutic targeting of JAM-A has shown promise in preclinical models. In multiple myeloma, anti-JAM-A monoclonal antibody treatment impaired tumor progression in murine xenograft models [46]. In DLBCL, lenalidomide downregulated JAM-A and NODAL expression, resulting in inhibition of B-lymphoma cell invasion and epithelial-to-mesenchymal transition [50]. These findings support continued development of JAM-A-targeted therapies.
This case study demonstrates that high-throughput flow cytometry screening of adhesion receptors effectively identifies novel CSC maintenance factors like JAM-A. The detailed protocols provided herein offer researchers a roadmap for implementing similar screening approaches in their investigations of CSC biology and therapeutic development. JAM-A represents both a promising therapeutic target and a biomarker across multiple cancers, with particular significance in glioblastoma, multiple myeloma, and diffuse large B-cell lymphoma.
High-throughput flow cytometry (HTFC) has emerged as a transformative technology in biomedical research, enabling multiparametric analysis of single cells at unprecedented speed and scale. This technological evolution addresses critical bottlenecks in drug discovery and development, particularly for complex biological systems where understanding cellular heterogeneity is paramount [32] [51]. By integrating advanced automation with sophisticated data analysis, HTFC platforms can achieve throughput of up to 50,000 wells per day, transforming flow cytometry from a low-throughput analytical tool into a powerful screening methodology [32]. This application note details standardized protocols and analytical frameworks for HTFC within three pivotal research domains: immuno-oncology, hematopoietic stem cell expansion, and infectious disease, providing researchers with validated methodologies to accelerate therapeutic development.
Application Note: Immuno-Oncology Research
Key Workflows and Research Applications
Immuno-oncology research leverages flow cytometry to dissect the complex interactions between the immune system and tumor microenvironment. Advanced flow cytometric platforms enable simultaneous detection of multiple immune checkpoint proteins, comprehensive T-cell characterization, and functional assessment of immune cell responses [52]. The PrimeFlow RNA assay technology employs a proprietary fluorescent in situ hybridization (FISH) and branched DNA (bDNA) signal amplification technique that enables detection of up to four RNA transcripts in a single cell, combinable with standard antibody staining [52]. This approach is particularly valuable for analyzing gene expression dynamics as immune cells become activated or exhausted within suppressive tumor microenvironments.
For cell-based therapies, flow cytometry provides essential tools for CAR T-cell characterization, quantifying transduction efficiency, and monitoring phenotypic markers throughout manufacturing [52]. Proliferation assays using CellTrace dyes or Click-iT EdU offer sensitive measurement of immune cell expansion, critical for assessing therapeutic potential [52]. Additionally, apoptosis assays enable researchers to study mechanisms of cell death and survival as a critical aspect of toxicological profiling during drug discovery.
Experimental Protocol: Immunophenotyping of Human T-Cell Subsets from Tumor Tissue
Sample Preparation:
- Generate single-cell suspensions from tumor tissue using mechanical dissociation followed by enzymatic treatment (e.g., collagenase/DNase) [52].
- Wash cells with PBS containing 5-10% fetal calf serum and filter through 70μm strainer.
- Determine total cell count and assess viability (>90% recommended) [53].
Viability Staining:
- Resuspend cell pellet at 1×10^6 cells/mL in cold buffer.
- Add fixable viability dye (e.g., 7-AAD, DAPI, or TOPRO-3) according to manufacturer's instructions [53].
- Incubate 30 minutes in the dark at 4°C.
- Wash twice with cold buffer (centrifuge at 200×g for 5 minutes at 4°C).
Surface Marker Staining:
- Resuspend cell pellet in FcR blocking buffer (e.g., 2-10% goat serum, human IgG, or mouse anti-CD16/CD32).
- Incubate 30-60 minutes in the dark at 4°C [53].
- Add fluorochrome-conjugated antibodies against surface markers (CD3, CD4, CD8, CD45, CD25, PD-1, CTLA-4) at predetermined optimal concentrations.
- Incubate 30 minutes in the dark at 4°C.
- Wash twice with cold buffer.
Intracellular Staining (FoxP3):
- Fix cells with 1-4% paraformaldehyde for 15-20 minutes on ice.
- Wash twice with buffer.
- Permeabilize cells with 0.1-1% Triton X-100 or saponin-based buffer for 10-15 minutes at room temperature [53].
- Add fluorochrome-conjugated anti-FoxP3 antibody.
- Incubate 30 minutes in the dark at room temperature.
- Wash twice with buffer.
- Resuspend in flow cytometry buffer for acquisition.
Data Acquisition and Analysis:
- Acquire data on HTFC instrument (e.g., iQue HTS cytometer) using appropriate laser configurations and detector settings.
- Use forward scatter (FSC) vs. side scatter (SSC) to gate on viable lymphocytes.
- Exclude dead cells based on viability dye positivity.
- Analyze T-cell subsets using sequential gating strategies (CD3+ → CD4+/CD8+ → FoxP3+ for Tregs, etc.).
- For high-throughput applications, utilize automated gating templates in software such as iQue Forecyt [54].
Table 1: Key Immune Cell Markers for Immuno-Oncology Research
| Cell Population | Surface Markers | Intracellular Markers | Functional Significance |
|---|---|---|---|
| Cytotoxic T-cells | CD3+, CD8+, CD45+ | Perforin, Granzyme B | Direct tumor cell killing |
| Helper T-cells | CD3+, CD4+, CD45RO+ | Various cytokines | Immune response coordination |
| T-regulatory cells | CD3+, CD4+, CD25+ | FoxP3+ | Immune suppression |
| Exhausted T-cells | CD3+, CD8+, PD-1+ | TIM-3, LAG-3 | Dysfunction in tumor microenvironment |
| CAR T-cells | CD3+, CD19+ (for CD19-targeting CAR) | Varies by construct | Engineered antitumor activity |
Application Note: Hematopoietic Stem Cell Expansion
High-Throughput Screening for Stem Cell Agonists
High-throughput flow cytometry has revolutionized the identification of small molecules that promote ex vivo expansion of hematopoietic stem cells (HSCs). This application is particularly valuable for overcoming the limitation of insufficient HSC numbers for transplantation and gene-based therapies [55]. Phenotypic screening approaches using HTFC enable researchers to screen compound libraries in an automated manner without requiring complete understanding of the molecular mechanisms, potentially discovering novel molecular mechanisms of action [32]. The power of this approach was demonstrated by Boitano et al., who identified StemRegenin1 (SR1), a purine derivative that promotes ex vivo expansion of human CD34+ hematopoietic stem cells without inhibiting differentiation capacity [32]. This compound has since advanced into clinical trials based on its ability to expand hematopoietic stem cells from cord blood for stem cell transplantation.
Experimental Protocol: Small Molecule Screening for HSC Expansion
CD34+ Cell Isolation:
- Obtain mononuclear cells from umbilical cord blood or peripheral blood via Ficoll density gradient centrifugation [56].
- Isolate CD34+ hematopoietic progenitor cells using immunomagnetic selection according to manufacturer's protocol.
- Assess purity by flow cytometry (typically >90% CD34+ cells).
- Cryopreserve cells or use immediately for expansion cultures.
Ex Vivo Expansion Culture:
- Prepare complete expansion medium (e.g., StemSpan SFEM Serum-free Medium) supplemented with cytokines: 50 ng/mL thrombopoietin, 50 ng/mL Flt3 ligand, 50 ng/mL interleukin-6, and 50 ng/mL stem cell factor [32].
- Thaw and wash CD34+ cells if cryopreserved.
- Plate cells in 384-well format at density of 1×10^4 cells/well in expansion medium containing test compounds or DMSO control [32].
- Include positive controls (e.g., 5 μM CHIR99021) [32].
- Culture cells for 14 days at 37°C, 5% CO2 with partial medium changes every 3-4 days.
High-Throughput Flow Cytometric Analysis:
- Harvest expanded cells from 384-well plates using automated liquid handling systems.
- Transfer cells to analysis plates and stain with viability dye (e.g., propidium iodide) and fluorochrome-conjugated antibodies against CD34, CD45, CD38, and lineage-specific markers (CD41, CD42, CD15) [32] [56].
- Incubate 30 minutes in the dark at 4°C.
- Wash cells and resuspend in flow cytometry buffer.
- Acquire data on HTFC platform (e.g., CyAn ADP Analyzer or iQue HTS cytometer).
- Use counting beads for absolute quantification of cell populations.
Data Analysis:
- Gate on viable cells based on light scatter properties and viability dye exclusion.
- Identify hematopoietic stem/progenitor cells as CD34+ CD38- CD45RA- CD71- [56].
- Quantify expansion fold relative to day 0 controls.
- Assess differentiation status by analyzing lineage-committed populations (CD41+ for megakaryocytic, CD15+ for granulocytic).
Table 2: Validation Parameters for Expanded Hematopoietic Stem Cell Products
| Quality Parameter | Analytical Method | Acceptance Criteria | Reference Method |
|---|---|---|---|
| Viability | 7-AAD exclusion | >90% | ISHAGE guidelines [57] |
| CD34+ Purity | Flow cytometry | >70% CD34+ cells | Single-platform flow cytometry [57] |
| CD34+ Absolute Count | Flow cytometry with counting beads | Variable based on application | ISHAGE guidelines [57] |
| Lineage Differentiation | Colony-forming unit (CFU) assay | Multilineage potential | Methylcellulose culture [56] |
| T-cell Content | CD3 staining | <5×10^4/kg for allogeneic | Extended ISHAGE [57] |
Application Note: Infectious Disease Research
Host-Pathogen Interactions and Immune Monitoring
Advanced flow cytometry platforms provide powerful approaches for characterizing host immune responses to infectious agents and evaluating therapeutic interventions. The technology enables comprehensive immune profiling through multiplexed analysis of cell phenotypes, cytokines, and functional markers in a high-throughput format [58]. During the SARS-CoV-2 pandemic, high-throughput flow cytometry played a crucial role in vaccine development and immune response characterization, with one vaccine candidate developed using these approaches receiving FDA emergency use authorization [58]. The iQue Advanced Flow Cytometry Platform has been utilized in numerous infectious disease studies, including research on Ebola virus, Zika virus, and HIV, demonstrating the versatility of HTFC across diverse pathogens [58].
Experimental Protocol: High-Throughput Immune Monitoring in Viral Infection
Sample Processing:
- Collect peripheral blood from infected subjects or appropriate controls.
- Isolate peripheral blood mononuclear cells (PBMCs) by density gradient centrifugation.
- Alternatively, use whole blood staining protocols with red blood cell lysis [53].
- Count cells and adjust concentration to 1×10^6 cells/mL in flow cytometry buffer.
Viability and Surface Staining:
- Add viability dye (e.g., fixable viability dye eFluor 506) and incubate 20 minutes at 4°C.
- Wash cells with PBS containing 2% FBS.
- Add Fc receptor blocking solution and incubate 15 minutes at 4°C.
- Add surface antibody panel (CD3, CD4, CD8, CD45, CD56, CD19, CCR7, CD45RA, CD38, HLA-DR) and incubate 30 minutes at 4°C in the dark.
- Wash cells twice with flow cytometry buffer.
Intracellular Cytokine Staining:
- Stimulate cells with pathogen-specific antigens or positive control (e.g., PMA/ionomycin) in the presence of protein transport inhibitor (e.g., brefeldin A) for 4-6 hours at 37°C.
- Fix cells with 1-4% paraformaldehyde for 15 minutes at room temperature.
- Permeabilize cells with saponin-based permeabilization buffer.
- Add intracellular antibodies (IFN-γ, TNF-α, IL-2, IL-4, IL-17, Ki-67) and incubate 30 minutes at room temperature in the dark.
- Wash cells twice with permeabilization buffer, then once with flow cytometry buffer.
- Resuspend in fixation buffer for acquisition.
High-Throughput Acquisition and Analysis:
- Acquire data on HTFC platform with automated plate handling capability.
- Use standardized gating strategy to identify major immune subsets and their activation states.
- Analyze antigen-specific T-cells based on cytokine production following pathogen antigen stimulation.
- Utilize automated analysis pipelines for rapid data processing across large sample sets.
Table 3: Key Immune Parameters for Infectious Disease Monitoring
| Immune Parameter | Analytical Markers | Biological Significance | Application Examples |
|---|---|---|---|
| T-cell Activation | CD38+, HLA-DR+ | Recent antigen exposure | HIV disease progression, COVID-19 severity |
| Memory Differentiation | CD45RA, CCR7, CD27 | Immune history and protection | Vaccine response evaluation |
| Cytokine Production | IFN-γ, TNF-α, IL-2 | Functional capacity | Pathogen-specific immunity |
| Cell Proliferation | Ki-67, CFSE dilution | Immune expansion and turnover | Acute vs. chronic infection |
| Exhaustion Status | PD-1, TIM-3, LAG-3 | Immune dysfunction | Chronic viral infections |
The Scientist's Toolkit: Essential Research Reagent Solutions
Table 4: Key Reagent Solutions for High-Throughput Flow Cytometry Applications
| Reagent Category | Specific Examples | Application | Key Features |
|---|---|---|---|
| Viability Dyes | 7-AAD, DAPI, Fixable Viability Dyes eFluor | Live/Dead discrimination | Distinguish viable and non-viable cells; fixable dyes maintain signal after permeabilization |
| Antibody Panels | Super Bright Polymer Dyes, eBioscience Antibodies | Multiplexed phenotyping | Enable high-parameter analysis; specifically validated for flow cytometry |
| Cell Preparation | Dynabeads, RBC Lysis Buffer | Sample processing | Efficient cell activation and expansion; remove interfering red blood cells |
| Intracellular Staining | Foxp3/Transcription Factor Staining Buffer Set | Transcription factor detection | Optimized for nuclear antigen detection |
| RNA Detection | PrimeFlow RNA Assay | RNA and protein co-detection | Detect up to 4 RNA targets with protein markers in single cells |
| Cell Proliferation | CellTrace Dyes, Click-iT EdU | Division tracking | Sensitive measurement of cell division without DNA denaturation |
| Bead-based Assays | Human Immuno-oncology Checkpoint Panel (14-plex) | Soluble factor measurement | Simultaneously detect multiple soluble immune checkpoint molecules |
Workflow and Signaling Pathway Diagrams
High-Throughput Screening Workflow for Stem Cell Expansion
Comprehensive Immune Monitoring Workflow
Integrated Screening Platform for Therapeutic Discovery
Maximizing Data Quality: A Practical Guide to Troubleshooting and Optimizing HT-FC Assays
In high-throughput flow cytometry stem cell screening research, the integrity of data is paramount. A weak or absent fluorescence signal can compromise entire datasets, leading to inaccurate conclusions and wasted resources. This application note addresses the three most critical technical pillars—antibody titration, fixation and permeabilization, and fluorochrome selection—to diagnose and resolve signal deficiencies. Stem cell populations, often characterized by low antigen density, present unique challenges that require optimized protocols to ensure signal clarity and experimental reproducibility in drug development pipelines.
Troubleshooting Weak or No Signal
A systematic approach is essential for diagnosing the root cause of poor fluorescence signals. The following flow chart outlines a step-by-step troubleshooting pathway, categorizing problems into antibody-related, sample-related, and instrument-related issues, each with corresponding solutions.
Quantitative Fluorochrome Performance for Stem Cell Markers
Selecting the appropriate fluorochrome is critical when analyzing stem cell markers, which are often expressed at low levels. The brightness and spectral characteristics of a fluorochrome directly impact the resolution of dim populations. The following table summarizes key performance metrics for modern fluorochromes relevant to stem cell screening, based on empirical flow cytometry data.
Table 1: Fluorochrome Performance Characteristics for High-Resolution Applications
| Fluorochrome | Excitation Laser | Emission Peak (nm) | Relative Brightness | Photostability | Recommended Application |
|---|---|---|---|---|---|
| BD Horizon RealBlue 780 (RB780) [59] | Blue (488 nm) | 780 | High (Winner - Resolution) | High | Low-expression markers, multicolor panels |
| BD Horizon RealYellow 703 (RY703) [59] | Yellow-Green (561 nm) | 703 | High | High (Winner - Photostability) | Long experiments, intracellular staining |
| NovaFluor Blue 690 (NFB690) [59] | Blue (488 nm) | 690 | High | Data Not Specified | Panels requiring low spillover |
| PE [60] [61] | Blue (488 nm) | 578 | Very High | Moderate | Very low-expression antigens |
| APC [60] [61] | Red (635-640 nm) | 660 | Very High | Moderate | Very low-expression antigens |
| PE/Dazzle 594 [59] | Blue (488 nm) | 594 | High | High | Compatible with intracellular staining |
Core Protocols for Signal Optimization
Protocol 1: Antibody Titration for Optimal Signal-to-Noise
Background: Antibody titration is the foundational step for achieving optimal population resolution. Using too little antibody results in a weak signal, while excess antibody increases background noise and spillover spreading (SIR) [62]. For high-throughput stem cell screening, this is a critical pre-requisite to ensure consistency and minimize reagent costs.
Materials:
- Antibody to be titrated
- Positive control cells expressing the target antigen
- Staining buffer (e.g., PBS with 1-5% FBS)
- V-bottom 96-well plate
- Flow cytometer
Method:
- Cell Preparation: Harvest and resuspend positive control cells in staining buffer at a concentration of 2 × 10^6 cells/mL [62].
- Dilution Series: Prepare a 2-fold serial dilution of the antibody in a 96-well plate. A 8-12 point dilution series is recommended, starting from the manufacturer's suggested concentration or, for antibodies with mass concentrations, beginning at 1000 ng/test [62].
- Staining: Add 100 µL of cell suspension (200,000 cells) to each well containing the antibody dilutions. Mix gently by pipetting.
- Incubation: Incubate for 20 minutes at room temperature in the dark. Adhere to the staining volume and conditions (e.g., 4°C) planned for your final assay [62].
- Washing: Centrifuge the plate at 400 × g for 5 minutes, decant the supernatant, and blot on a paper towel. Resuspend the pellet in 200 µL of staining buffer and repeat the wash step twice [62].
- Acquisition: Resuspend cells in a suitable volume of buffer and acquire data on a flow cytometer.
- Analysis: For each dilution, plot the median fluorescence intensity (MFI) of the positive population and the signal-to-noise ratio (MFI-positive / MFI-negative). The optimal titer is the concentration that provides the highest signal-to-noise ratio before the MFI plateau [62].
Protocol 2: Fixation and Permeabilization for Intracellular Staining
Background: For stem cell research involving transcription factors (e.g., Oct4, Nanog) or intracellular cytokines, effective fixation and permeabilization (FP) is non-negotiable. Inadequate FP renders the target inaccessible, leading to a weak or absent signal [60] [53].
Materials:
- Single-cell suspension
- Fixative (e.g., 1-4% Paraformaldehyde (PFA), 90% Methanol, or Acetone)
- Permeabilization solution (e.g., Triton X-100, Saponin)
- Wash buffer (PBS with 1-5% FBS)
Method:
- Surface Stain (Optional): If combining surface and intracellular markers, complete the surface antibody staining first, followed by washing [53].
- Fixation:
- Washing: Wash cells twice with wash buffer to remove residual fixative.
- Permeabilization:
- Resuspend the fixed cell pellet in a permeabilization detergent.
- Incubate for 10-15 minutes at room temperature.
- Detergent Selection: Use harsh detergents (e.g., 0.1-1% Triton X-100) for nuclear antigens. Use mild detergents (e.g., 0.2-0.5% Saponin) for cytoplasmic antigens or to preserve cell surface proteins for concurrent staining [53].
- Note: Acetone fixation also permeabilizes cells, making this step unnecessary [53].
- Intracellular Staining: Proceed with antibody staining in a buffer containing the permeabilization agent.
Protocol 3: Strategic Fluorochrome Selection and Panel Design
Background: Pairing the right fluorochrome with the target antigen is a strategic decision. The rule of thumb is to match bright fluorochromes with low-abundance antigens and dimmer fluorochromes with highly expressed antigens [61]. This practice maximizes resolution and minimizes spillover-related issues.
Method:
- Antigen Density Assessment: Classify your target antigens based on expected expression levels (low, medium, high) from literature or preliminary data.
- Assign Bright Fluorochromes: Assign the brightest fluorochromes (e.g., PE, APC, BD Horizon RealBlue/Yellow dyes) to the least abundant markers, such as key stem cell markers like SSEA-4 or CD34 [59].
- Assign Dim Fluorochromes: Assign dimmer fluorochromes (e.g., FITC, Pacific Blue) to highly abundant antigens (e.g., CD45, CD44) [61].
- Check for Interference: Place low-expression antigens in "clean" channels that receive minimal spillover from other fluorochromes in your panel. Avoid placing a high-expression antigen in a channel that spills over into the channel of a low-expression antigen [61].
- Consider Tandem Dyes: Be aware that tandem dyes (e.g., PE-Cy7) can be susceptible to photobleaching or breakdown, which increases background in the donor channel (PE). Validate their performance, especially in fixed samples [59] [61].
The Scientist's Toolkit: Essential Reagent Solutions
The following table lists critical reagents and their functions for ensuring robust fluorescence signals in flow cytometry, with a focus on stem cell applications.
Table 2: Key Research Reagent Solutions for Flow Cytometry
| Reagent / Material | Function / Application | Example Use-Case in Stem Cell Research |
|---|---|---|
| Viability Dye (e.g., 7-AAD, Fixable Viability Dyes) [53] | Distinguishes live from dead cells; dead cells bind antibodies non-specifically, increasing background. | Gating out dead cells in primary stem cell cultures or post-thaw samples to improve analysis clarity. |
| Fc Receptor Blocking Buffer [53] | Blocks non-specific antibody binding via Fc receptors on immune cells. | Essential when analyzing hematopoietic stem cells (HSCs) or mesenchayml stem cells (MSCs) to reduce false positives. |
| GMP-Grade Antibody Panels [63] | Pre-validated, high-quality reagents for regulated workflows. | Critical for drug development and clinical trial screening where reproducibility and compliance are mandatory. |
| Brefeldin A [60] [64] | Golgi transport blocker used to inhibit protein secretion. | Accumulates intracellular cytokines or transcription factors within the cell for enhanced detection. |
| Compensation Beads [60] | Particles used to calculate spectral overlap (compensation) between channels. | Setting up multicolor panels for deep immunophenotyping of heterogeneous stem cell populations. |
| Permeabilization Reagents (e.g., Saponin, Triton X-100) [53] | Disrupts cell membrane to allow antibody access to intracellular targets. | Staining for crucial pluripotency factors like Oct-3/4 and Nanog in embryonic stem cells. |
Optimizing fluorescence signals in high-throughput stem cell screening is a multifaceted process that demands rigorous attention to reagent concentration, sample preparation, and panel design. The systematic implementation of antibody titration, validated fixation/permeabilization protocols, and strategic fluorochrome pairing, as outlined in this note, provides a robust framework for generating high-quality, reproducible data. For researchers in drug development, these protocols are not merely best practices but essential steps in building a reliable pipeline from discovery to clinical application.
Strategies to Minimize High Background and Autofluorescence
In high-throughput flow cytometry screening for stem cell research, the presence of high background and cellular autofluorescence presents a significant challenge to data accuracy and interpretation. Cellular autofluorescence arises from intrinsic biological molecules such as collagen, elastin, NADPH, flavins, mitochondria, and lysosomes [65]. These compounds typically absorb light in the UV to blue range (355-488 nm) and emit in the blue to green range (350-550 nm), which can severely interfere with fluorochromes operating in that spectrum—such as FITC, GFP, and Pacific Blue—by reducing signal sensitivity and resolution [65]. For researchers and drug development professionals working with stem cell populations, which often exhibit heightened autofluorescence, implementing strategies to minimize these effects is crucial for achieving reliable, high-quality data in screening campaigns.
Autofluorescence in fluorescence-based cell detection methods stems from multiple sources, each requiring specific intervention strategies. Biological molecules inherent to cells constitute a primary source, with flavins and NADPH emitting in the 500-600 nm range, and collagen and elastin contributing significantly to background signal [65]. Cellular components such as mitochondria and lysosomes also exhibit natural fluorescence, which is particularly problematic when working with inherently fluorescent cell types like neutrophils [65].
Experimental reagents and procedures introduce additional challenges. Fetal calf serum (FCS) present in staining buffers and culture media absorbs light in the violet and blue spectra, thereby increasing background fluorescence [65]. Aldehyde fixatives like paraformaldehyde (PFA) react with amines and proteins to form fluorescing molecules, with this effect intensifying with rising PFA concentration and prolonged exposure duration [65]. Dead cells and cellular debris bind reagents non-specifically and significantly elevate autofluorescence through extracellular matrix components, while unlysed red blood cells or lingering hemoglobin from incomplete lysis can absorb light at 541 and 577 nm, interfering with PE and PE-tandem dyes [65].
Table 1: Common Sources of Autofluorescence and Their Spectral Characteristics
| Source | Excitation Range (nm) | Emission Range (nm) | Primary Interference |
|---|---|---|---|
| NADPH, Flavins | 355-488 | 350-550 | FITC, GFP, Pacific Blue |
| Collagen, Elastin | 355-488 | 350-550 | FITC, GFP, Pacific Blue |
| Hemoglobin | 541, 577 | N/A (Absorbs) | PE, PE-tandem dyes |
| Dead Cells/Debris | Multiple | Multiple | Broad-spectrum |
| Fetal Calf Serum | Violet-Blue | Violet-Blue | Violet-excited dyes |
Strategic Approaches to Minimize Autofluorescence
Sample Preparation and Handling Optimization
Proper sample preparation provides the first line of defense against autofluorescence. The following evidence-based practices are recommended:
FCS Concentration Optimization: Standardize the lowest effective concentration of FCS in staining buffer, typically between 1-10%. Lower concentrations effectively reduce autofluorescence while maintaining sufficient blocking of non-specific antibody binding. For persistent issues, switch to bovine serum albumin (BSA) as an alternative [65].
Dead Cell and Debris Removal: Implement rigorous procedures to remove dead cells and extracellular matrix debris through low-speed spinning, Ficoll gradient centrifugation, or DNase I incubation. Include live/dead cell discriminating dyes in staining panels to facilitate gating out dead cells prior to analyzing target sub-populations [65].
Complete RBC Lysis and Washing: Ensure proper lysis of red blood cells using validated lysis buffers according to established protocols. Follow with multiple PBS washes to remove all traces of free hemoglobin, which absorbs at wavelengths critical for PE and PE-tandem dye detection [65].
PFA Concentration and Exposure Titration: Titrate PFA to the lowest effective concentration for fixation—a 0.5% solution may work as effectively as 4% in some applications. Analyze fixed cells within 24 hours of staining to minimize fixation-induced fluorescence, as signal increases with prolonged PFA exposure [65].
Fluorochrome Selection and Panel Design
Strategic fluorochrome selection represents one of the most powerful approaches to circumvent autofluorescence issues:
Bright Fluorochrome Selection: For inherently fluorescent cells (e.g., neutrophils), choose bright fluorochromes such as PE, APC, and their tandem derivatives. The high intensity of these signals makes background autofluorescence less relevant to detection and analysis [65].
Spectral Shifting: Design panels that shift detection to longer wavelengths where autofluorescence is diminished. Replace fluorochromes like FITC with Alexa Fluor 488, or PerCP with PerCP-Cy5.5, to move signal detection to "redder" spectral regions [65].
Spectral Flow Cytometry Applications: With spectral cytometers, leverage the full fluorescence spectrum of fluorophores and subsequent spectral separation to overcome traditional limitations. This technology enables discrimination of fluorophores with significant emission overlap, such as PerCP and PerCP-eFluor 710, which would be challenging to resolve on conventional cytometers [66]. Spectral cytometry also facilitates autofluorescence extraction during the unmixing process, effectively removing it to reveal true fluorescent signals [66].
Table 2: Recommended Fluorochrome Choices to Circumvent Autofluorescence
| Application Scenario | Recommended Fluorochromes | Alternative Options | Rationale |
|---|---|---|---|
| Highly Autofluorescent Cells | PE, APC, Tandems | PE-Cy7, APC-Cy7 | Brightness outweighs background |
| Blue-Green Autofluorescence | PerCP-Cy5.5, Alexa Fluor 647 | PE-Cy5, APC-Cy7 | Spectral shifting to red |
| Complex Panels | Spark dyes, Super Bright dyes | Qdot nanocrystals | Novel dyes with better separation |
| Spectral Cytometry | Multiple overlapping spectra | N/A | Unmixing algorithms resolve signals |
Instrumentation and Detection Strategies
Modern flow cytometry technologies offer advanced solutions for background reduction:
Spectral Flow Cytometry: Unlike conventional cytometers that use optical filters to direct specific wavelength ranges to detectors, spectral cytometers capture the full emission spectrum across a wide range of wavelengths using detector arrays [67]. This enables sophisticated unmixing algorithms that can identify and subtract autofluorescence signatures, significantly improving signal-to-noise ratios for dim markers [66].
Laser Configuration Considerations: In spectral systems, lasers excite fluorochromes beyond their specific excitation maxima. For example, a violet laser will excite all fluorochromes, not just those with violet-range excitation maxima, providing additional spectral data for enhanced unmixing and background discrimination [67].
Proper Compensation Controls: Implement rigorous compensation controls using single-stain cells or antibody-capture beads for each fluorophore in the panel. The positive population in compensation controls must be at least as bright as in experimental samples, and the negative control should match the autofluorescence of experimental samples [68] [69].
Experimental Protocols for High-Throughput Stem Cell Screening
Protocol: Sample Preparation for Low-Autofluorescence Stem Cell Analysis
Principle: Minimize introduction of autofluorescence sources during sample preparation through optimized reagents and procedures.
Reagents:
- Staining buffer with reduced FCS (1-2%) or BSA
- DNase I solution (100 µg/mL in PBS)
- Live/Dead discriminator dye (e.g., Fixable Viability Dye)
- Validated RBC lysis buffer
- Low-concentration PFA (0.5-1%) for fixation
Procedure:
- Harvest cells using gentle enzymatic dissociation to minimize cell death.
- Incubate cell suspension with DNase I (100 µg/mL) for 15 minutes at 37°C to reduce debris.
- Perform RBC lysis if working with whole blood or buffy coats:
- Add 10 volumes of pre-warmed RBC lysis buffer to 1 volume of cell suspension.
- Incubate for 10 minutes at room temperature with gentle mixing.
- Centrifuge at 300 × g for 5 minutes and carefully discard supernatant.
- Repeat wash with PBS twice to ensure complete hemoglobin removal.
- Stain with Live/Dead discriminator dye according to manufacturer's instructions.
- Proceed with antibody staining in reduced-FCS or BSA-containing buffer.
- If fixation is required, use freshly prepared 0.5% PFA for no more than 1 hour.
- Acquire data within 24 hours of staining, storing samples at 4°C in darkness if necessary.
Protocol: Autofluorescence Subtraction in Spectral Flow Cytometry
Principle: Leverage spectral unmixing capabilities to identify and mathematically subtract autofluorescence signatures.
Reagents:
- Fully stained stem cell samples
- Unstained control samples from identical source
- Single-color controls for all fluorophores used
Procedure:
- Prepare single-color controls and unstained cells using the same cell type as experimental samples.
- Acquire data for all controls and experimental samples on spectral cytometer.
- Create spectral library using single-color controls.
- Identify autofluorescence signature from unstained control.
- Include autofluorescence as a "fluorophore" during the unmixing process.
- Apply unmixing algorithm to experimental samples, which will mathematically separate and subtract the autofluorescence component.
- Verify results by comparing signals before and after autofluorescence subtraction.
Visualization of Key Workflows
Sample Preparation Strategy
Autofluorescence Reduction Strategy Selection
The Scientist's Toolkit: Essential Research Reagents
Table 3: Key Reagents for Autofluorescence Reduction in Stem Cell Screening
| Reagent Category | Specific Products | Function | Application Notes |
|---|---|---|---|
| Viability Dyes | Fixable Live/Dead stains, PI, 7-AAD | Discriminate dead cells | Gate out autofluorescent dead cells |
| Serum Alternatives | BSA, Synthetic serum replacements | Reduce FCS autofluorescence | Use at 1-2% concentration |
| RBC Lysis Buffers | Commercial ammonium chloride kits | Remove hemoglobin interference | Multiple washes critical |
| Low-Autofluorescence Antibodies | Spark, Super Bright, eFluor | Enhanced brightness | Better signal-to-noise ratio |
| Tandem Dyes | PE-Cy7, APC-Cy7, Brilliant Violet | Spectral shifting | Move detection to less noisy regions |
| Fixation Alternatives | Low PFA, Pre-fixation staining | Reduce aldehyde fluorescence | Limit concentration and exposure time |
| Reference Controls | Compensation beads, Unstained cells | Proper compensation | Match sample autofluorescence |
| Enzymatic Cleaners | DNase I, Collagenase | Reduce cellular debris | Minimize ECM autofluorescence |
Implementing a comprehensive strategy that addresses sample preparation, fluorochrome selection, and appropriate instrumentation is essential for minimizing high background and autofluorescence in high-throughput flow cytometry screening of stem cells. By combining optimized sample handling procedures with strategic panel design and leveraging advanced technologies like spectral flow cytometry, researchers can significantly improve data quality and reliability. These approaches are particularly valuable in stem cell research and drug development, where accurate detection of dimly expressed markers and rare cell populations is often critical to success. Through systematic application of these protocols, scientists can overcome the challenges posed by autofluorescence and generate robust, publication-quality data from their flow cytometry screening campaigns.
In high-throughput flow cytometry screening for stem cell research, the quality of sample preparation directly determines the reliability of experimental data. Contamination from cellular aggregates, doublets, and dead cells represents a fundamental challenge that can compromise data interpretation, particularly when analyzing rare populations such as cancer stem cells. These artifacts contribute to false-positive signals, increased background noise, and inaccurate population statistics, ultimately threatening experimental validity. This application note provides detailed methodologies to address these critical issues within the context of stem cell research and drug development workflows.
The Critical Impact of Sample Artifacts on Data Quality
The presence of aggregates, doublets, and dead cells in flow cytometry samples creates specific analytical challenges that are particularly problematic in stem cell research:
Dead Cells: Necrotic and apoptotic cells bind antibodies and dyes non-specifically, leading to elevated background fluorescence and false-positive results in stem cell marker identification [70]. This is especially problematic when analyzing rare cancer stem cell populations where precision is critical.
Cellular Doublets and Aggregates: These events are misinterpreted by analysis software as single cells with abnormal characteristics, creating false populations that can be mistaken for rare stem cell subtypes or affecting cell cycle analysis [71]. In high-throughput screening, this significantly compromises data integrity and reproducibility.
Compromised Stem Cell Viability: Stem cells are particularly sensitive to processing conditions. Suboptimal handling during tissue dissociation or staining can alter surface epitopes critical for stem cell identification and sorting, potentially skewing experimental outcomes [12] [70].
Essential Protocols for High-Quality Sample Preparation
Generation of Single-Cell Suspensions from Solid Tissues
The preparation of high-quality single-cell suspensions from solid tissues, including tumors and stem cell-derived organoids, requires optimized dissociation protocols that balance cell yield with preservation of cell surface markers.
Enzymatic Dissociation Protocol for Neural Tissues/Organoids [72] [73]:
- Prepare digestion buffer containing Collagenase IV (0.2 mg/mL) + DNase I (0.05 mg/mL) in RPMI 1640 with 10% FBS.
- Transfer tissue sample (approximately 1-2 cm³) to a tube containing 0.5 mL digestion buffer.
- Using sterile scissors, mince tissue into tiny pieces (1-2 mm) to increase surface area for enzyme penetration.
- Transfer minced tissue and buffer to a six-well plate, adding additional digestion buffer to 4 mL total volume.
- Incubate for 1 hour at 37°C with occasional gentle agitation.
- At end of incubation, gently pipette mixture 6-8 times with a 10 mL serological pipette to dissociate remaining clusters.
- Filter suspension through a 70 μm cell strainer into a 50 mL conical tube.
- Rinse well with 1 mL PBS and pass through the same strainer.
- Centrifuge at 365 × g for 5 minutes at 4°C and proceed with density gradient centrifugation or direct staining.
Note: For tissues with high lipid content (e.g., neural tissue), additional myelin removal steps using 30% Percoll gradients or anti-myelin beads may be necessary [70].
Comprehensive Workflow for Sample Preparation and Analysis
The following diagram illustrates the complete workflow from sample collection to data acquisition, highlighting critical control points for quality assurance:
Strategic Approach to Dead Cell Exclusion and Viability Staining
Maintaining high cell viability (>85%) throughout sample processing is essential for reliable stem cell analysis [71]. Multiple strategies can be employed to address dead cell contamination:
Viability Dye Staining Protocol [70] [73]:
- Prepare single-cell suspension and adjust concentration to 1-5×10⁶ cells/mL.
- Add viability dye (PI, 7-AAD, or DAPI) to cell suspension at manufacturer-recommended concentration.
- Incubate for 5-10 minutes at 4°C protected from light.
- Proceed with surface marker staining or analysis immediately.
- During flow acquisition, gate out viability dye-positive cells before analysis of stem cell markers.
Fixation Considerations for Stem Cell Markers [70]:
- Aldehyde-based fixatives (paraformaldehyde) generally provide superior epitope preservation for stem cell surface markers.
- Avoid ethanol fixation when using large fluorescent proteins (PE, APC) for staining.
- Note that tandem dyes (APC-Cy7, PE-Cy7) degrade upon fixation - use formamide-stable alternatives (APC-H7) or synthetic dyes (Alexa Fluor, Brilliant Violet) for fixed samples.
- Fixation increases recovery of lymphocytes and monocytes but may alter staining patterns for specific antibody clones.
Quantitative Assessment and Quality Control Metrics
Establishing rigorous quality control checkpoints throughout sample preparation is essential for generating publication-quality flow cytometry data in stem cell research.
Acceptance Criteria for Sample Quality
Table 1: Quality Control Parameters for Flow Cytometry Sample Preparation
| Parameter | Target Value | Corrective Action |
|---|---|---|
| Cell Viability | >85% | Use dead cell removal kit or density gradient centrifugation |
| Cell Concentration | 1-5×10⁶ cells/mL | Concentrate via centrifugation or dilute with buffer |
| Aggregation Level | <5% doublets in FSC-A/FSC-H | Increase DNase concentration; additional filtration |
| Background Staining | MFI ratio <3:1 (positive:negative) | Optimize antibody titration; enhance blocking |
| Recovery Yield | >70% of expected | Modify dissociation protocol; reduce processing time |
Troubleshooting Common Sample Preparation Issues
Table 2: Troubleshooting Guide for Sample Preparation Artifacts
| Problem | Potential Causes | Solutions |
|---|---|---|
| High Background Fluorescence | Inadequate washing; antibody aggregation; non-specific binding | Increase wash volume/cycles; filter antibodies; optimize blocking |
| Poor Cell Viability | Osmotic stress; temperature fluctuations; toxic reagents | Maintain consistent 4°C temperature; check buffer osmolarity/pH |
| Weak Signal Intensity | Antibody degradation; suboptimal staining conditions | Verify antibody storage; perform titration; adjust cell concentration |
| Cellular Aggregation | DNA release from dead cells; inadequate dissociation | Add DNase (0.05 mg/mL) to buffer; filter through cell strainer |
| Compensation Difficulties | Poor single-color controls; autofluorescence mismatch | Use bright, single-color controls matched to sample cell type |
The Scientist's Toolkit: Essential Research Reagents
Table 3: Essential Reagents for High-Quality Flow Cytometry Sample Preparation
| Reagent Category | Specific Examples | Function in Sample Preparation |
|---|---|---|
| Enzymatic Dissociation Reagents | Collagenase IV, DNase I, Trypsin, Liberase | Breakdown extracellular matrix; reduce cell clumping |
| Viability Dyes | Propidium iodide, 7-AAD, DAPI, Fixable Viability Dyes | Identification and exclusion of dead cells during analysis |
| Blocking Reagents | Fc Receptor Blockers, Normal Serum, BSA | Reduce non-specific antibody binding and background |
| Fixation/Permeabilization | Paraformaldehyde, Methanol, Triton X-100, Saponin | Preserve cell structure; enable intracellular staining |
| Fluorophore-Conjugated Antibodies | CD133, CD44, CD49f, JAM-A | Identification and isolation of stem cell populations |
| Specialized Buffers | PBS/BSA/Azide, RBC Lysis Buffer, Sort Buffer | Maintain cell integrity; remove contaminating cells |
Decision Framework for Addressing Sample Preparation Challenges
The following diagram provides a systematic approach to identifying and resolving common sample preparation issues in stem cell flow cytometry:
Advanced Applications: Flow Cytometry in Stem Cell Organoid Research
The emergence of complex three-dimensional stem cell models presents unique challenges for flow cytometry sample preparation. Glioblastoma organoids (GBOs) and other stem cell-derived organoids require specialized processing to maintain cell viability while achieving effective single-cell dissociation [73].
Organoid Dissociation Protocol for Cell Death Analysis [73]:
- Generate single-cell suspensions from densely-packed organoids through combined enzymatic and mechanical dissociation.
- Permeabilize cells with 0.1% Triton X-100 to enable nuclear dye access.
- Stain with propidium iodide (PI) to label fragmented nuclear DNA in apoptotic cells.
- Analyze using flow cytometry, identifying a hypodiploid sub-G1 peak that marks cell death.
- Validate results with alternative viability assays (Hoechst 33258, lactate dehydrogenase release).
This approach has demonstrated sensitivity in detecting treatment-induced cell death, with temozolomide and lomustine treatments in GBOs producing cell death rates up to 63% in validation studies [73].
Meticulous attention to sample preparation details is fundamental to success in high-throughput stem cell flow cytometry screening. The systematic implementation of the protocols and quality control measures outlined in this application note—including proper tissue dissociation, dead cell exclusion, aggregate removal, and rigorous viability assessment—ensures the generation of high-quality data essential for accurate stem cell characterization. As flow cytometry continues to evolve with advanced spectral technologies and increased parameter capabilities [67], the principles of optimal sample preparation remain the critical foundation supporting all subsequent analysis, particularly in the context of drug development and translational stem cell research.
High-throughput flow cytometry (HTFC) has become an indispensable tool in modern stem cell research and drug discovery, enabling the multiparametric analysis of thousands of samples at single-cell resolution. The integration of HTFC into stem cell screening pipelines allows researchers to rapidly profile complex cellular phenotypes, identify novel cell subpopulations, and evaluate therapeutic compounds across vast libraries. However, maximizing throughput while maintaining data quality presents significant challenges. This application note details optimized methodologies for three critical pillars of HTFC throughput optimization: implementation of plate-based formats, strategic management of sample concentration, and rigorous instrument maintenance. By addressing these interconnected components, research and drug development professionals can significantly enhance their screening capabilities, reduce operational costs, and accelerate discovery timelines.
Plate-Based Formats for High-Throughput Screening
Transitioning from tube-based to plate-based sample processing represents the most fundamental step in increasing flow cytometry throughput. This approach standardizes workflows, minimizes handling time, and enables integration with automated liquid handling systems.
Plate Format Selection and Experimental Design
The choice between 96-well, 384-well, and 1536-well formats depends on the specific screening requirements, including library size, available cell numbers, and reagent costs. The 384-well format has emerged as the preferred balance between throughput and practical feasibility for many applications [47]. A well-designed plate layout must account for control wells and minimize edge effects, which can be achieved by excluding perimeter wells from test compounds [47].
Table 1: Comparison of Plate-Based Formats for High-Throughput Flow Cytometry
| Plate Format | Typical Assay Volume | Wells Available for Tests (excluding controls) | Approximate Processing Time | Best Use Cases |
|---|---|---|---|---|
| 96-well | 100-200 µL | 80-88 | ~1 hour [37] | Smaller libraries, pilot studies, assays requiring large cell numbers |
| 384-well | 10-50 µL | 240-360 | ~10 minutes [37] | Primary screening of medium to large compound libraries |
| 1536-well | 2-10 µL | 1,000+ | Similar to 384-well with specialized systems [37] | Ultra-high-throughput screening, limited cell availability |
Automated sample acquisition is critical for plate-based workflows. Systems like the HyperCyt Autosampler can process a 384-well plate in under 10 minutes by serially aspirating samples from each well, separating them with air gaps, and continuously acquiring data into a single, time-resolved file [37]. This "sip-and-whiff" approach eliminates the dead time associated with traditional "sip-and-spit" sampling, where each sample requires separate aspiration and back-flush cycles [37]. Modern instruments like the ZE5 Cell Analyzer can process a 96-well plate in less than 15 minutes, while the iQue HTS Cytometer can complete a 96-well plate in approximately 5 minutes using air-gap technology to prevent sample carryover [31] [74].
Protocol: High-Throughput Screening in 384-Well Format
This protocol adapts established methodologies for high-throughput compound screening [47] to stem cell applications.
Materials
- Cell line: Appropriate stem cell population (e.g., human pluripotent stem cells)
- Plate: 384-well, tissue culture-treated, μClear, black plates (e.g., Greiner Bio-One, Cat#781092)
- Compound source: 384-well compound library plates (e.g., polypropylene, Greiner Bio-One, Cat#781201-906)
- Liquid handler: Automated workstation (e.g., Biomek FX) with pintool attachment
- Plate washer: Automated plate washer (e.g., BioTek ELx405)
- Reagent dispenser: Peristaltic pump-based dispenser (e.g., BioTek MicroFlo or Thermo Fisher Multidrop Combi)
- Flow cytometer: HTFC system with autosampler (e.g., Attune NxT, ZE5, or iQue Screener)
Procedure
Cell Seeding:
- Harvest and resuspend stem cells in appropriate maintenance medium.
- Dispense 40 µL cell suspension (containing 2,000-5,000 cells) to each well of the 384-well assay plate using a Multidrop Combi reagent dispenser.
- Centrifuge plates at 300 × g for 1 minute to settle cells.
Compound Transfer:
- Using a Biomek FX pintool, transfer 100 nL of compound from source plates to assay plates.
- Perform pintool washing between transfers with the following sequence:
- DMSO (HPLC grade)
- Isopropyl alcohol
- Methanol
- Blot on filter paper and dry with fan after each solvent [47].
Stimulation and Incubation:
- Add 10 µL of appropriate stem cell differentiation or signaling modulator (e.g., IFN-γ for PD-L1 induction in protocol adaptation) using a reagent dispenser.
- Incubate plates for prescribed duration (e.g., 72 hours) under standard culture conditions.
Staining and Fixation:
- Add 20 µL of staining cocktail containing fluorophore-conjugated antibodies against target markers and viability dye (e.g., Fixable Viability Dye 660).
- Incubate for 30-60 minutes protected from light.
- Wash cells twice with 50 µL FACS buffer (DPBS with 2% FBS and 1 mM EDTA) using an automated plate washer set to leave 7-9 µL residual volume.
- Fix cells with 20 µL of 4% paraformaldehyde for 20 minutes.
Data Acquisition:
- Resuspend cells in 40 µL FACS buffer.
- Acquire data on HTFC system with autosampler, collecting 1,000-5,000 events per well.
Figure 1: Workflow for high-throughput screening in 384-well format.
Sample Concentration and Preparation
Optimizing sample concentration is essential for maintaining high event rates without compromising data quality through increased doublets or electronic aborts.
Principles of Sample Concentration Optimization
Maintaining an adequate cell concentration is crucial for achieving high event rates without increasing sample flow rate, which negatively impacts data resolution [31]. Overly concentrated samples increase the likelihood of doublet events (two or more cells passing through the laser simultaneously) and can lead to clogs in the fluidics system [31]. Conversely, overly dilute samples reduce throughput by requiring longer acquisition times to collect sufficient events.
The optimal concentration range depends on the specific instrument, but generally falls between 1×10^6 to 1×10^7 cells/mL [47] [75]. For the Attune NxT Flow Cytometer, which uses a unique volumetric syringe-based fluidics system, samples can be acquired at rates up to 35,000 cells/second while maintaining data quality [75]. Higher-end systems like the ZE5 Cell Analyzer can handle event rates of 100,000 events/second without electronic aborts [31].
Table 2: Sample Concentration Optimization Parameters
| Parameter | Too Low | Optimal Range | Too High | Impact |
|---|---|---|---|---|
| Cell Concentration | <1×10^6 cells/mL | 1-10×10^6 cells/mL | >1×10^7 cells/mL | Low event rate vs. increased doublets/clogging |
| Event Rate | <1,000 events/sec | 10,000-35,000 events/sec | >100,000 events/sec | Increased acquisition time vs. electronic aborts [31] |
| Sample Flow Rate | Low | Manufacturer's recommendation | High | Reduced data resolution [31] |
| Doublet Frequency | Low | <5% of events | High | Data must be discarded [31] |
Protocol: Sample Preparation for High-Throughput Flow Cytometry
Proper sample preparation is critical for generating high-quality HTFC data. This protocol outlines key steps from cell harvesting to data acquisition.
Materials
- Cell suspension: Stem cells at appropriate differentiation stage
- Viability dye: Fixable Viability Dye (e.g., Fixable Viability Dye 660, Thermo Fisher Cat#65-0864-14)
- Antibodies: Titrated, fluorophore-conjugated antibodies against target markers
- Staining buffer: DPBS with 2% FBS and 1 mM EDTA [47]
- DNase I: For reducing cell aggregates
- Filtration system: Appropriate cell strainer (e.g., 40 µm)
Procedure
Cell Harvesting:
- Gently dissociate stem cell cultures using appropriate enzyme-free dissociation buffer.
- Avoid using freshly thawed cells; instead, rest cells post-thaw for 24-48 hours before analysis [31].
Cell Counting and Concentration Adjustment:
- Count cells using automated cell counter (e.g., Countess II).
- Adjust concentration to 5×10^6 cells/mL in staining buffer.
- For rare populations, consider concentrating samples to 1×10^7 cells/mL.
Viability Staining:
- Resuspend cell pellet in protein-free buffer (e.g., PBS) at 1×10^7 cells/mL.
- Add Fixable Viability Dye at titrated concentration.
- Incubate for 10-20 minutes at 4°C protected from light.
- Wash with protein-containing buffer (PBS with 1% BSA or FBS) to eliminate unbound dye [76].
Antibody Staining:
- Prepare antibody cocktail in staining buffer using premixed antibodies when possible to increase reproducibility [31].
- For surface markers, incubate for 20-30 minutes at 4°C protected from light.
- For intracellular targets, perform fixation and permeabilization after surface staining.
Reduction of Aggregates:
- Add DNase I (10-100 µg/mL) and EDTA (1-5 mM) to minimize cell aggregates [31].
- Filter samples through appropriate cell strainer immediately before acquisition.
Data Acquisition Setup:
Instrument Maintenance and Quality Control
Regular, thorough instrument maintenance is paramount for successful HTFC, where large numbers of samples increase wear and the risk of downtime.
Comprehensive Maintenance Protocol
Implementing rigorous cleaning and quality control procedures ensures consistent performance and data quality throughout extended screening campaigns.
Daily Maintenance
Startup Quality Control:
- Run quality control beads (e.g., fluorescent calibration beads) to verify laser alignment and detector sensitivity.
- Check instrument sensitivity using calibration beads and document performance metrics [77].
Pre-Run Cleaning:
- In shared facilities, run a cleaning cycle before your experiment to remove potential contaminants from previous users [31].
- Flush system with appropriate cleaning solution (e.g., distilled water or manufacturer-recommended cleanser).
Performance Verification:
- Verify fluidics pressure remains within normal operating range.
- Confirm stable stream and time delay for sort-capable instruments.
Weekly Maintenance
Deep Cleaning:
- Thoroughly clean fluidics system with 10% bleach solution for 20-30 minutes, followed by extensive rinsing with distilled water.
- Clean sample line and probe with appropriate cleaning solutions.
Laser Performance Check:
- Document laser power outputs and compare to specifications.
- Check for consistent optical alignment using multi-color calibration beads.
Fluidics System Inspection:
- Check for leaks or air bubbles in sheath and sample lines.
- Replace tubing if signs of wear or discoloration are present.
Monthly Maintenance
Comprehensive System Validation:
- Run full validation panel with characterized control cells.
- Verify detection sensitivity and dynamic range across all parameters.
- Document all quality control metrics for longitudinal performance tracking.
Preventative Parts Replacement:
- Replace fluidics filters according to manufacturer's schedule.
- Check and clean air filters on instrument and computer.
Figure 2: Instrument maintenance schedule for high-throughput flow cytometry.
The Scientist's Toolkit: Essential Research Reagents and Materials
Table 3: Essential Research Reagent Solutions for High-Throughput Flow Cytometry
| Reagent/Material | Function | Example Products | Application Notes |
|---|---|---|---|
| 384-well plates | High-density sample format | Greiner Bio-One, Cat#781092 | Tissue culture-treated, μClear bottom for possible imaging |
| Fixable Viability Dyes | Discrimination of live/dead cells | Fixable Viability Dye 660 | Stain before fixation in protein-free buffer [76] |
| Quality Control Beads | Instrument calibration and performance tracking | IntelliCyt QC Beads, AbC Total Antibody Compensation Bead Kit | Use for daily quality control and compensation setup [75] |
| FcR Blocking Reagent | Reduce nonspecific antibody binding | Human FcR Blocking Reagent, Miltenyi Biotec Cat#130-059-901 | Critical for staining immune cells and stem cells |
| EDTA | Anticoagulant and aggregate reducer | UltraPure 0.5M EDTA, pH 8.0 | Use in FACS buffer at 1-5 mM to minimize cell clumping [47] [31] |
| DNase I | Reduces cell aggregates | Recombinant DNase I | Add during sample preparation at 10-100 µg/mL [31] |
| Multicolor Antibody Panels | Multiplexed detection of cell markers | Pre-designed panels or custom conjugates | Titrate all antibodies; use bright fluorophores for low-abundance targets [78] |
| Stain Buffer | Antibody dilution and cell washing | PBS with 1-2% FBS and optional EDTA | Protein content reduces nonspecific binding |
The optimization strategies detailed in this application note provide a comprehensive framework for implementing high-throughput flow cytometry in stem cell screening research. By integrating plate-based formats, optimizing sample concentration, and maintaining rigorous instrument quality control, researchers can achieve unprecedented throughput while maintaining data quality. These methodologies enable the screening of complex compound libraries against biologically relevant stem cell models, accelerating both basic research and drug discovery efforts. As HTFC technology continues to evolve with advances in automation, imaging cytometry, and data analysis, these foundational practices will remain essential for maximizing the value of high-throughput screening campaigns.
Beyond Throughput: Validating Discoveries and Comparing HT-FC with Emerging Technologies
High-throughput flow cytometry screening has emerged as a powerful methodology for identifying novel regulatory nodes in complex biological systems, particularly in stem cell and cancer biology. This approach enables the prospective enrichment of rare cell populations, such as cancer stem cells (CSCs), and provides a platform for studying specific cell surface interactions on intact cells [13]. The ability to perform multi-parameter analysis at single-cell resolution makes flow cytometry particularly valuable for dissecting cellular heterogeneity within tumors and identifying unique CSC niche mechanisms that represent immediate priorities for developing more effective therapies [12].
Within the context of glioblastoma (GBM), a devastating cancer with limited treatment options, flow cytometry screening has revealed junctional adhesion molecule-A (JAM-A) as a critical maintenance factor for CSCs [13]. This discovery exemplifies the "screen to clinic" pipeline, where unbiased screening approaches identify novel targets that can be subsequently validated through functional assays and developed into therapeutic strategies. The validation of such targets requires a comprehensive approach, integrating biochemical, molecular, and biological analyses to establish their essential roles in self-renewal and tumor growth [13].
JAM-A: From Screening Hit to Therapeutic Candidate
Identification of JAM-A Through Flow Cytometry Screening
The journey of JAM-A from screening hit to therapeutic candidate began with a high-throughput flow cytometry screen performed on patient-derived glioblastoma cells. Researchers utilized six different GBM specimens with validated differences in self-renewal capacity, employing a bar-coding approach to pool xenografts for the screening procedure [13]. The screen evaluated cell adhesion molecules with commercially available antibodies, selecting targets expressed above 5% in at least three of the six GBM specimens. These candidates were then evaluated for correlation to glioma patient survival using the NCI REMBRANDT database [13].
This integrated approach identified nine cell adhesion receptors with negative correlation to glioma patient survival, including JAM-A (CD321), which demonstrated a median survival of 13.4 months for patients with high expression [13]. The presence of established CSC markers (CD49f, CD29, and CD44) among the hits validated the screening methodology, while JAM-A emerged as a particularly interesting candidate due to its reported role in cell-to-cell adhesion and facilitation of integrin signaling—functions likely important for CSC communication with its niche [13].
Table 1: Cell Adhesion Receptors Identified in Flow Cytometry Screen Correlated with Patient Survival
| Receptor | Common Name | Expression Threshold | Functional Role |
|---|---|---|---|
| CD321 | JAM-A | >5% in 3/6 specimens | Cell-cell adhesion, integrin signaling |
| CD63 | Tetraspannin | >5% in 3/6 specimens | Cell adhesion, signaling |
| CD87 | Urokinase receptor | >5% in 3/6 specimens | Invasion, survival |
| CD49e | Integrin α5 | >5% in 3/6 specimens | ECM adhesion |
| CD26 | Dipeptidyl peptidase-4 | >5% in 3/6 specimens | Metastasis, interacts with integrin β1 |
| CD54 | ICAM1 | >5% in 3/6 specimens | Cell adhesion, immune response |
| CD29 | Integrin β1 | >5% in 3/6 specimens | CSC marker, ECM adhesion |
| CD44 | Hyaluronic acid receptor | >5% in 3/6 specimens | CSC marker, cell adhesion |
| CD49f | Integrin α6 | >5% in 3/6 specimens | CSC marker, ECM adhesion |
JAM-A as a Prognostic and Predictive Biomarker
Beyond glioblastoma, JAM-A has emerged as a significant prognostic factor across multiple cancer types. In multiple myeloma (MM), elevated JAM-A levels in patient-derived plasma cells strongly correlate with poor prognosis [46]. Furthermore, circulating soluble JAM-A (sJAM-A) levels were significantly increased in MM patients compared with controls, suggesting its potential as a serum-based marker for clinical stratification [46].
The prognostic significance of JAM-A extends to its role in CSC maintenance. In GBM, JAM-A expression is reduced in normal brain versus GBM tissue, and targeting JAM-A specifically compromises CSC self-renewal without affecting normal neural stem/progenitor cell function [13]. This cancer-specific essentiality presents a therapeutic opportunity, suggesting that JAM-A inhibition could target the CSC population while sparing normal tissue.
Table 2: JAM-A as a Biomarker Across Cancer Types
| Cancer Type | Prognostic Value | Functional Role | Therapeutic Potential |
|---|---|---|---|
| Glioblastoma (GBM) | Negative correlation with patient survival (13.4 months median) | CSC maintenance, self-renewal, niche adhesion | High (dispensable for normal NPC function) |
| Multiple Myeloma (MM) | High expression correlates with poor prognosis | Migration, colony formation, chemotaxis, proliferation, viability | High (in vivo antibody treatment impairs progression) |
| Solid Tumors | Associated with invasion, metastasis, and poor prognosis | Cell adhesion, signaling | Under investigation |
| Diabetic Wounds | Reduced in diabetic environment | Angiogenesis, endothelial cell function | Potential for promoting wound healing |
Experimental Protocols for JAM-A Functional Validation
High-Throughput Flow Cytometry Screening Protocol
Objective: To identify cell adhesion receptors differentially expressed on cancer stem cells with correlation to patient prognosis.
Materials:
- Patient-derived glioblastoma cells (6 different specimens)
- Commercial antibodies against cell adhesion molecules
- Bar-coding reagents for sample multiplexing
- Flow cytometer with high-throughput capability
- Ficoll gradient for cell separation
- Fluorescence-activated cell sorting (FACS) buffer: HBSS with 2 mM EDTA and 0.5% FCS [79]
Procedure:
- Prepare single-cell suspensions from patient-derived GBM xenografts using enzymatic digestion (collagenase I, collagenase IV, and DNase I in RPMI) [79].
- Unique bar-coding of each specimen for subsequent pooling.
- Pool all six specimens for simultaneous screening.
- Incubate pooled cells with fluorescently labeled antibodies against cell adhesion molecules for 20 minutes at 4°C.
- Wash cells and resuspend in FACS buffer.
- Analyze using flow cytometry, gating on live cells.
- Set selection threshold at 5% expression in at least three of the six GBM specimens.
- Cross-reference selected targets with patient survival data from NCI REMBRANDT database.
- Validate top candidates using human protein atlas for tumor-specific expression [13].
JAM-A Functional Validation Using siRNA Knockdown
Objective: To assess the functional consequences of JAM-A inhibition on cancer cell phenotypes.
Materials:
- JAM-A siRNA oligonucleotides: 5'-GAAGUGAAGGAGAAUUCAATT-3' (sense) and 5'-UUGAAUUCUCCUUCACUUCTT-3' (antisense) [46]
- Non-targeting siRNA control
- Transfection reagent
- Cell culture plates coated with fibronectin (10 μg/ml)
- Flow cytometer for efficiency assessment
Procedure:
- Seed cancer cells (e.g., RPMI-8226 multiple myeloma cells) onto fibronectin-coated plates.
- Transfert cells with JAM-A-specific siRNA or non-targeting control using appropriate transfection reagent.
- Incubate for 48-72 hours to allow for protein knockdown.
- Assess knockdown efficiency by flow cytometry using anti-JAM-A antibody.
- Evaluate functional phenotypes:
- Viability and proliferation: Perform Ki-67 evaluation and apoptosis assays
- Migration: Conduct scratch assay by creating a "wound" with pipette tip on confluent cells
- Clonogenic capacity: Perform colony-forming assay with crystal violet staining
- Chemotaxis: Use ThinCert assay with appropriate chemoattractants [46]
In Vivo Therapeutic Assessment of JAM-A Inhibition
Objective: To evaluate the efficacy of JAM-A targeting in preclinical models.
Materials:
- Anti-JAM-A monoclonal antibody (αJAM-A moAb)
- Control IgG
- Murine xenograft models (e.g., MM-bearing mice)
- Caliper for tumor measurement
- Serum collection tubes for sJAM-A assessment
Procedure:
- Establish xenograft models by subcutaneously injecting cancer cells (3×10⁶ cells for LLC model) into mouse flank [79].
- Randomize mice into treatment and control groups when tumors become palpable.
- Administer anti-JAM-A monoclonal antibody or control IgG via appropriate route.
- Monitor tumor growth regularly by caliper measurements, calculating volume using formula: V = π × (d² × D)/6, where d is shortest diameter and D is longest diameter.
- Continue treatment until control tumors reach maximum allowable size (e.g., 1500 mm³).
- Collect tumors, blood, and other relevant tissues for analysis.
- Assess circulating sJAM-A levels using ELISA kit per manufacturer's instructions [46].
- Process tissues for immunohistochemical analysis of JAM-A expression and downstream signaling effects.
Signaling Pathways and Molecular Mechanisms of JAM-A
JAM-A orchestrates multiple signaling pathways that contribute to its function in cancer progression and stem cell maintenance. The diagram below illustrates the key molecular mechanisms associated with JAM-A signaling in cancer and endothelial cells.
JAM-A mediates its effects through multiple interconnected signaling pathways. In glioblastoma, JAM-A interacts with integrin β1, a known CSC regulator, forming complexes that promote niche adhesion and maintenance of stemness [13]. This interaction facilitates inside-out integrin activation via Rap1, a key regulator of cell adhesion and migration processes [79]. Additionally, JAM-A engagement activates the PI3K/AKT/mTOR pathway, which enhances cell survival, proliferation, and angiogenesis—critical processes in tumor progression and diabetic wound healing [80].
The diagram illustrates how JAM-A's ability to co-cluster with integrins and activate downstream signaling cascades positions it as a central regulator of cancer stem cell behavior and tumor progression. These molecular mechanisms provide rationale for therapeutic targeting of JAM-A in multiple cancer types.
The Scientist's Toolkit: Essential Research Reagents
Table 3: Essential Research Reagents for JAM-A and Flow Cytometry Studies
| Reagent/Category | Specific Examples | Function/Application | Experimental Notes |
|---|---|---|---|
| Flow Cytometry Antibodies | Anti-JAM-A FITC (clone OV5B8) [46] | Detection and quantification of JAM-A expression | Use after Fc receptor block with CD16/CD32-specific antibody |
| siRNA Reagents | JAM-A siRNA: 5'-GAAGUGAAGGAGAAUUCAATT-3' [46] | Gene knockdown studies | Include non-targeting siRNA controls; assess efficiency at 48-72h |
| Functional Assay Reagents | Fibronectin (10μg/ml coating) [46], Collagenase I/IV, DNase I [79] | Cell adhesion, migration, and tissue dissociation | Optimize enzyme concentrations for different tissue types |
| Cell Culture Models | Patient-derived GBM cells, RPMI-8226, U266, OPM-2, NCI-H929 [46] | In vitro screening and validation | Use low-passage patient-derived cells for CSC studies |
| In Vivo Reagents | Anti-JAM-A monoclonal antibody [46], LLC/Py8119 cell lines [79] | Therapeutic assessment in preclinical models | Monitor tumor volume with caliper measurements |
| Detection Assays | JAM-A ELISA kit [46], Colony formation assay reagents | Quantification of soluble JAM-A and clonogenic potential | Use conditioned media for sJAM-A detection |
| Instrumentation | BD FACS Canto II [46], High-throughput flow cytometers | Cell analysis and sorting | Implement bar-coding for multiplexed samples |
Clinical Translation and Therapeutic Development
Regulatory Framework for Stem Cell-Based Therapies
The translation of novel targets like JAM-A from basic research to clinical application occurs within a well-defined regulatory framework. The International Society for Stem Cell Research (ISSCR) provides comprehensive guidelines that address the international diversity of cultural, political, legal, and ethical issues associated with stem cell research and its translation to medicine [81]. These guidelines maintain widely shared principles in science that call for rigor, oversight, and transparency in all areas of practice, providing assurance that stem cell research is conducted with scientific and ethical integrity and that new therapies are evidence-based [81].
A critical distinction in therapeutic development is between FDA-authorized trials and FDA-approved products. An Investigational New Drug (IND) application allows a company to begin human trials after FDA permission, but full approval requires a Biologics License Application (BLA) after successful trials demonstrating that a product is safe, pure, and potent for its intended use [82]. This distinction is crucial for understanding the development pathway for JAM-A-targeted therapies.
Current Landscape of Stem Cell Clinical Trials
The clinical landscape for stem cell therapies has evolved significantly, with notable regulatory approvals and advancing clinical trials. As of 2025, the field has witnessed several important developments:
- Ryoncil (remestemcel-L): Received FDA approval in December 2024 as the first MSC therapy for pediatric steroid-refractory acute graft versus host disease [82].
- Omisirge (omidubicel-onlv): Approved in April 2023 for patients with hematologic malignancies undergoing cord blood transplantation [82].
- Pluripotent Stem Cell Trials: A major review identified 115 global clinical trials involving 83 distinct PSC-derived products, with over 1,200 patients dosed and no significant safety concerns reported [82].
This progressive regulatory environment provides a pathway for JAM-A-targeted therapies, particularly as research continues to validate its role across multiple cancer types and its potential as both a therapeutic target and biomarker.
The validation of JAM-A as a critical cancer stem cell maintenance factor exemplifies a successful "screen to clinic" pipeline that integrates high-throughput flow cytometry screening with functional validation assays. The comprehensive approach outlined in this application note—from initial identification through in vivo therapeutic assessment—provides a roadmap for researchers pursuing novel targets in stem cell and cancer biology.
Future directions for JAM-A research include the development of more specific inhibitory agents, combination therapies with existing treatments, and expanded biomarker validation across cancer types. The continued refinement of high-throughput flow cytometry technologies, including spectral flow cytometry and high-parameter systems, will further enhance our ability to identify and validate novel targets in increasingly complex biological systems [15]. As single-cell technologies advance and our understanding of cancer stem cell niches deepens, targets like JAM-A represent promising opportunities for developing more effective therapies against treatment-resistant cancers.
Within stem cell research and drug discovery, the ability to conduct robust, information-rich screening is paramount. Two powerful technologies dominate this landscape: High-Throughput Flow Cytometry (HT-FC) and High-Content Imaging (HCI), often implemented as High-Content Screening (HCS). While both are high-throughput, single-cell analysis platforms, their underlying principles, applications, and data outputs differ significantly. For researchers engaged in stem cell screening, understanding this distinction is crucial for selecting the optimal tool. HT-FC excels in the rapid, multi-parametric phenotyping and functional analysis of cells in suspension, whereas HCI provides deep morphological profiling and subcellular contextual information, typically from adherent cell systems or complex 3D models like organoids [83] [84] [85]. This application note delineates the operational parameters of each technology and provides a foundational protocol for their application in stem cell screening.
The core difference between the technologies lies in their analytical focus: HT-FC is optimized for high-speed quantification of surface and intracellular markers on a per-cell basis, while HCI is designed for extracting quantitative morphological data from cell images [84] [85].
Table 1: Core Characteristics of HT-FC and HCI
| Feature | High-Throughput Flow Cytometry (HT-FC) | High-Content Imaging (HCI) |
|---|---|---|
| Primary Readout | Fluorescence intensity & light scatter of individual cells in suspension [85]. | High-resolution microscopic images (e.g., fluorescence, brightfield) [83] [86]. |
| Key Strength | Very high speed; extensive multiparametric immunophenotyping (up to 27+ parameters) [28]. | Spatial context; subcellular localization; morphological analysis [83] [87]. |
| Typical Sample | Optimal for suspension cells (e.g., hematopoietic stem cells) [85]. | Optimal for adherent cells, 3D cultures (e.g., organoids, stem cell-derived cells) [84] [12]. |
| Throughput (Cell Count) | Very High (up to 100,000 cells/second) [28]. | Lower (tens to hundreds of cells/second imaged) [85]. |
| Throughput (Plate Reading) | A 384-well plate in <1 hour [28]. | A 384-well plate in 5-60 minutes, highly dependent on imaging parameters [85]. |
| Data Output | Quantitative, numerical data for statistical analysis [12] [85]. | Quantitative, multi-parametric image-based data and visual information [83] [84]. |
| Spatial Information | No | Yes, a defining feature [84] [87]. |
Application in Stem Cell Research
Both technologies are versatile, but their unique strengths make them particularly suited for specific questions in stem cell biology.
2.1 High-Throughput Flow Cytometry Applications: HT-FC is indispensable for the identification and isolation of rare stem cell populations. Key applications include:
- Immunophenotyping: Simultaneously measuring the expression of multiple cell surface markers (e.g., CD34, CD45, CD133) to identify and quantify distinct stem cell and progenitor populations from a heterogeneous sample [12].
- Cell Cycle and Apoptosis Analysis: Using DNA-binding dyes and markers like Annexin V to determine the proliferative status and health of stem cell cultures [12].
- Functional Assays: Measuring intracellular protein expression (e.g., transcription factors like Nanog, Oct-4), calcium flux, or cytokine production at the single-cell level [28].
- Isolation of Pure Populations: Using Fluorescence-Activated Cell Sorting (FACS), a feature of many flow cytometers, to physically isolate stem cell subpopulations for downstream culture or -omics analysis [12].
2.2 High-Content Imaging Applications: HCI is the preferred method for understanding the morphological and functional consequences of genetic or compound perturbations on stem cells.
- Phenotypic Screening: Observing alterations in cellular phenotypes, such as changes in cell shape, size, cytoskeletal organization, or nuclear morphology in response to treatments [83] [87].
- Lineage Tracing and Differentiation: Monitoring stem cell differentiation in real-time or endpoint assays using fluorescent reporters for specific lineage markers and analyzing complex morphological changes [83].
- Organoid and 3D Model Analysis: Characterizing the complex structure, cellular heterogeneity, and organization of stem cell-derived organoids [84] [12]. HCI can quantify the size, shape, and number of structures within these 3D cultures.
- Mechanistic Toxicology: Identifying off-target effects and cellular toxicities, such as induction of apoptosis, protein aggregation, or stress granule formation, that may not be detected by single-parameter assays [83].
Experimental Protocols
Below are generalized protocols for screening a compound library for modulators of stem cell differentiation using each technology.
Protocol 1: HT-FC for High-Throughput Stem Cell Immunophenotyping This protocol is designed for screening suspension cells or dissociated adherent stem cells to quantify differentiation markers.
1. Key Research Reagent Solutions
- Single-Cell Suspension: Stem cells prepared using gentle dissociation enzymes to preserve surface epitopes.
- Multicolor Antibody Panel: Fluorochrome-conjugated antibodies against target antigens (e.g., stem cell and differentiation markers).
- Viability Dye: e.g., Propidium Iodide or DAPI to exclude dead cells.
- Staining Buffer: PBS supplemented with protein (e.g., BSA) to block non-specific binding.
- HT-FC System: e.g., IntelliCyt HTFC system or Bio-Rad ZE5 Cell Analyzer, capable of automated plate sampling [85] [28].
2. Workflow
- Step 1: Cell Preparation and Compound Treatment. Plate cells in 384-well plates. Treat with compound library for the desired duration to induce differentiation.
- Step 2: Harvest and Stain. Transfer cells to a round-bottom plate. Centrifuge, wash, and resuspend in staining buffer containing the pre-titrated antibody cocktail and viability dye. Incubate for 30-60 minutes on ice in the dark.
- Step 3: Data Acquisition. Add wash buffer to the plates and centrifuge. Resuspend cells in a fixed volume of buffer. Load the plate onto the HT-FC system with an autosampler. The system automatically samples from each well, using air gaps to separate samples, and acquires data for thousands of cells per well in minutes [85].
- Step 4: Data Analysis. Use the instrument's software to gate on single, live cells and then analyze the fluorescence intensity for each marker. Hits are identified based on a significant shift in marker expression compared to controls.
The following diagram illustrates the automated sampling and analysis process:
HT-FC Automated Workflow
Protocol 2: HCI for Morphological Analysis of Stem Cell Differentiation This protocol is designed for screening adherent stem cells to quantify differentiation-induced morphological changes.
1. Key Research Reagent Solutions
- Adherent Stem Cells: Plated in optically clear, flat-bottom microplates (e.g., 384-well).
- Fixative: e.g., 4% Paraformaldehyde.
- Permeabilization Buffer: e.g., Triton X-100.
- Multiplex Fluorescent Probes: Including specific antibodies for target proteins, nuclear stains (e.g., Hoechst), and fluorescent dyes for actin (e.g., Phalloidin).
- High-Content Imager: e.g., PerkinElmer Opera QEHS or GE IN Cell Analyzer, with automated microscopy and environmental control [87].
2. Workflow
- Step 1: Cell Plating and Compound Treatment. Plate adherent stem cells in 384-well imaging plates. Allow to attach, then treat with the compound library.
- Step 2: Fixation and Staining. At assay endpoint, fix cells with paraformaldehyde. Permeabilize cells and stain with a multiplexed panel of fluorescent dyes and antibodies. Wash to remove unbound stain.
- Step 3: Image Acquisition. Load plates onto the automated HCI system. The system uses predefined parameters to automatically focus and acquire multiple high-resolution images per well across all fluorescence channels.
- Step 4: Image and Data Analysis. Use integrated software (e.g., using machine learning algorithms) to segment images based on the nuclear stain, identify individual cells, and then quantify dozens of morphological parameters (e.g., nuclear area, cell perimeter, fluorescence intensity and texture, organelle count) for each cell [84] [87]. Hits are identified by clustering phenotypes or measuring significant changes in these multiparametric profiles.
The following diagram outlines the key steps in this protocol:
HCI Staining and Analysis Workflow
Data Output and Analysis
The nature of the data generated by HT-FC and HCI dictates the subsequent analytical approaches.
Table 2: Data Output and Hit Identification Strategies
| Aspect | High-Throughput Flow Cytometry (HT-FC) | High-Content Imaging (HCI) |
|---|---|---|
| Data Format | Numerical values (fluorescence intensity, scatter) for each cell and parameter [85]. | High-resolution images and numerical data extracted from them (e.g., >100 morphological features per cell) [84] [87]. |
| Primary Analysis | Gating on bivariate plots to identify cell subpopulations based on marker co-expression [12]. | Image segmentation to identify cellular and subcellular compartments, followed by feature extraction [84]. |
| Hit Identification | Thresholds set on fluorescence intensity for specific markers (uni-variate) [85]. | Multi-parametric analysis (e.g., Mahalanobis distance to positive control) or machine learning-based phenotypic clustering, which reduces false positives [87]. |
| Key Advantage | Speed and objectivity in quantifying predefined populations. | Unbiased discovery of novel phenotypes and rich mechanistic insight. |
HT-FC and HCI are highly complementary, not competing, technologies in the stem cell researcher's toolkit. The choice between them is dictated by the specific biological question. HT-FC is the superior choice for projects requiring the ultra-high-speed quantification of molecular markers across vast numbers of cells in suspension, such as immunophenotyping hematopoietic stem cells or screening for surface receptor modulators. In contrast, HCI is unparalleled when the experimental goal is to understand the morphological and spatial consequences of a treatment, such as in phenotypic screens for differentiation inducers or toxicological assessments in complex organoid models. A synergistic strategy, using HT-FC for initial high-speed hit finding and HCI for secondary, in-depth mechanistic profiling on the most promising hits, represents a powerful pipeline for accelerating stem cell research and drug discovery.
Imaging flow cytometry (IFC) represents a transformative advancement in cellular analysis, effectively merging the high-throughput, multi-parameter capabilities of conventional flow cytometry with the detailed imaging power of microscopy [3] [88]. This technology has emerged as a cutting-edge tool that provides high-resolution morphological imaging alongside quantitative data, enabling a more comprehensive understanding of complex biological systems at the single-cell level [3]. The genesis of IFC stemmed from integrating the hydraulic system of a flow cytometer with advanced camera technology, facilitating morphological analysis of cell populations at a high-throughput scale [88].
The evolution of IFC has revolutionized the landscape of cytometry by addressing a critical limitation of conventional flow cytometry: the lack of visual context for the measured signals [89]. While traditional flow cytometry provides robust quantitative data on fluorescence intensity and light scatter properties, it cannot visualize cell morphology, subcellular localization, or cell-cell interactions [3] [89]. IFC bridges this gap by capturing high-resolution images of each cell as it passes through the detection system, preserving spatial relationships while maintaining analytical throughput [3] [88].
For researchers engaged in high-throughput stem cell screening, IFC offers particular value by enabling the analysis of complex cellular phenotypes, differentiation states, and functional responses within heterogeneous populations [32] [88]. The technology's ability to combine the statistical rigor of high-throughput analysis with morphological validation makes it uniquely suited for demanding applications in drug discovery, regenerative medicine, and functional genomics [32] [90].
Technical Principles and Comparative Advantages
System Architecture and Working Principle
The core architecture of an imaging flow cytometer consists of four integrated systems that work in concert to generate quantitative and visual data [3]:
- Fluidics System: Hydrodynamically focuses cells into a single-file stream, ensuring they pass sequentially through the interrogation point. This precise alignment is crucial for obtaining clear, individual cell images [3] [88].
- Optics System: Comprises laser sources and optical filters that generate excitation light and isolate specific emission wavelengths from fluorescently labeled cells [3].
- Imaging System: Incorporates high-precision cameras (such as CCD or CMOS sensors) or innovative technologies like optical time-stretch (OTS) imaging to capture high-resolution cellular images at rapid speeds [3] [91].
- Electronic System: Processes optical signals into electrical data, converting captured images into analyzable digital information for subsequent computational analysis [3].
The general workflow begins with cell preparation and fluorescent labeling, followed by hydrodynamic focusing of cells through the imaging path. As each cell passes through the detection zone, it is illuminated by lasers, and both scattered light and fluorescence emissions are captured simultaneously [3]. Advanced detectors then record multichannel images for each event, combining brightfield, darkfield, and multiple fluorescence channels to create comprehensive cellular profiles [3] [88].
Performance Comparison: Traditional Flow Cytometry vs. Imaging Flow Cytometry
Table 1: Comparative analysis of flow cytometry technologies
| Feature | Conventional Flow Cytometry | Imaging Flow Cytometry |
|---|---|---|
| Throughput | High (10,000+ events/sec) [89] | Medium to High (1-1,000,000+ events/sec depending on technology) [89] [91] |
| Data Type | Quantitative fluorescence intensity and light scatter [89] | Quantitative fluorescence intensity plus high-resolution morphological data [3] [89] |
| Spatial Context | Lost during analysis [89] | Preserved through cellular imaging [89] |
| Morphological Information | Limited to derived parameters (size, granularity) | Detailed analysis of size, shape, subcellular structure, and localization [3] [88] |
| Best Applications | High-throughput screening, immunophenotyping, cell sorting [89] [54] | Rare cell analysis, subcellular localization, cell-cell interactions, morphological assessment [3] [89] [88] |
| Cell Sorting Capability | Yes (FACS systems) | Limited, primarily analytical [89] |
Recent technological breakthroughs have dramatically enhanced IFC capabilities. Optical time-stretch (OTS) imaging systems have pushed throughput boundaries to unprecedented levels, with one recently demonstrated system achieving real-time analysis exceeding 1,000,000 events per second while maintaining sub-micron spatial resolution [91]. This represents a 100-fold improvement over conventional IFC systems and opens new possibilities for large-scale cell analysis applications in stem cell research and drug discovery [91].
Applications in Stem Cell Research and Drug Discovery
High-Throughput Stem Cell Screening Applications
IFC has become an indispensable technology in stem cell research, where it enables multidimensional analysis of complex cellular phenotypes and functional states. The following applications demonstrate its particular utility in high-throughput screening environments:
Stem Cell Differentiation Tracking: IFC enables simultaneous monitoring of surface marker expression, morphological changes, and subcellular transitions during stem cell differentiation. This is particularly valuable for assessing heterogeneity in differentiation outcomes and identifying rare subpopulations with distinct developmental potential [32] [88].
Cell Cycle and Division Analysis: The technology provides robust methods for analyzing cell cycle distribution, proliferation dynamics, and asymmetric cell division in stem cell populations. By combining DNA content quantification with morphological profiling, researchers can obtain comprehensive cell cycle status while correlating it with phenotypic characteristics [92] [88].
Mitochondrial Dynamics Assessment: IFC introduces novel, unbiased approaches for measuring mitochondrial function and fusion activity in stem cells. Research applications have demonstrated the ability to detect and analyze fused cells based on co-localization of different mitochondrially targeted proteins, providing insights into metabolic regulation during stem cell fate decisions [88].
Senescent Cell Detection: IFC protocols allow simple, rapid, and quantitative detection of senescent cell populations, including in live cells without requiring specialized staining. This application is particularly relevant for screening compounds that modulate cellular senescence in stem cell cultures [88].
Extracellular Vesicle Analysis: Advanced IFC enables detailed analyses of extracellular vesicle (EV) subset composition and cellular origin. This capability provides insights into the functional role of stem cell-derived EVs in intercellular communication and their potential applications as therapeutic vehicles [88].
Quantitative Performance in High-Throughput Screening
Table 2: IFC performance metrics in high-throughput screening applications
| Application Domain | Throughput Capacity | Key Measurable Parameters | Reference |
|---|---|---|---|
| Drug Discovery Screening | 50,000 wells per day | Multiplexed phenotypic analysis, cell viability, surface marker expression | [32] |
| T-regulatory Cell Screening | 384-well plates in 20 minutes | FoxP3 nuclear localization, CD4/CD25 surface expression, proliferation markers | [32] |
| Platelet Production from Stem Cells | 1,000-10,000 cells per second | CD41/CD42 expression, morphological maturation, cytoplasmic complexity | [32] |
| Natural Killer Cell Activation | 1536-well plate compatibility | Activation markers, cytotoxic granule release, cell conjugation | [32] |
| Ultra-High-Throughput Analysis | >1,000,000 events per second | Morphological profiling, rare cell detection, population heterogeneity | [91] |
Detailed Experimental Protocols
Protocol 1: High-Throughput Screening of Compounds Modulating Stem Cell Differentiation
This protocol adapts established high-throughput flow cytometry methods [32] for imaging flow cytometry applications in stem cell research, enabling compound screening with morphological validation.
4.1.1 Research Reagent Solutions and Materials
Table 3: Essential reagents and materials for stem cell differentiation screening
| Item | Function/Application | Specifications |
|---|---|---|
| Stem Cell Population | Primary screening material | CD34+ hematopoietic stem cells or pluripotent stem cell-derived progenitors |
| Differentiation Media | Supports lineage-specific differentiation | Serum-free formulations with defined growth factors |
| Compound Library | Small molecules for screening | FDA-approved compounds or targeted libraries in DMSO |
| Multiplexed Fluorescent Antibodies | Cell surface and intracellular marker detection | CD34, CD41, CD42, CD45, lineage-specific markers |
| Viability Dye | Discrimination of live/dead cells | Propidium iodide or similar membrane-impermeant dyes |
| Cell Encoding Dyes | Sample multiplexing for throughput enhancement | Fluorescent cell barcoding dyes (e.g., Cell Proliferation Dyes) |
| Fixation/Permeabilization Buffer | Intracellular antigen detection and sample preservation | Commercial buffer systems (e.g., Foxp3 Fix/Perm buffer) |
| Microplates | High-throughput screening format | 384-well or 1536-well plates with ultra-low evaporation lids |
4.1.2 Step-by-Step Procedure
Cell Preparation and Plating:
- Obtain CD34+ stem cells through immunoselection from cord blood or mobilized peripheral blood according to manufacturer recommendations [32]. Confirm purity by flow cytometry (>90% CD34+).
- Plate cells in serum-free medium at optimized density (2-5×10^4 cells/well) in 384-well format using automated liquid handling systems.
- Add compound library using pin transfer or acoustic dispensing technology, including appropriate controls (DMSO vehicle, known differentiation inducers).
Differentiation Culture:
- Maintain cultures for 14 days in appropriate differentiation conditions with medium exchange at day 7.
- For megakaryocyte differentiation, use media containing thrombopoietin (100 ng/mL), FLT3 ligand (50 ng/mL), interleukin-6 (50 ng/mL), and stem cell factor (50 ng/mL) [32].
- Include CHIR99021 (5 μM) as positive control for enhanced platelet production.
Sample Processing and Staining:
- Harvest cells by gentle pipetting and transfer to V-bottom plates for staining.
- Implement fluorescent barcoding for sample multiplexing by labeling different experimental conditions with distinct fluorescent dyes (e.g., APC-, APC-Cy7-, or PE-Cy7-conjugated streptavidin with biotinylated cells) [32].
- Perform surface staining with CD41-PE (1:500 dilution) and CD42-APC (1:250 dilution) for 60 minutes at 4°C.
- Wash cells twice with FACS buffer (DPBS, 3% FBS, 5 mM EDTA, 0.1% sodium azide) using automated plate washers.
- Fix cells with 2% paraformaldehyde for 15 minutes, then permeabilize for intracellular staining if required.
IFC Data Acquisition:
- Acquire data on imaging flow cytometer with appropriate configuration for high-throughput sampling.
- For systems with automated plate loaders, configure method files for continuous acquisition of entire plates.
- Collect a minimum of 5,000-10,000 events per well to ensure statistical robustness for rare population detection.
Data Analysis:
- Use integrated software for initial population identification based on brightfield and darkfield characteristics.
- Apply morphological filters for cell size, aspect ratio, and internal complexity to distinguish different maturation stages.
- Quantify fluorescence intensity for differentiation markers and normalize to control conditions.
- Employ machine learning algorithms for automated classification of differentiation stages based on combined morphological and fluorescence patterns.
Protocol 2: Analysis of Subcellular Localization in Stem Cell Signaling
This protocol leverages IFC's unique capability to quantify protein translocation and subcellular distribution in response to signaling pathway activation, providing insights into stem cell regulatory mechanisms.
4.2.1 Step-by-Step Procedure
Cell Stimulation and Fixation:
- Culture stem cells under defined conditions to maintain pluripotency or initiate differentiation.
- Stimulate with pathway-specific agonists/antagonists for optimized timepoints (typically 15 minutes to 24 hours).
- Immediately fix cells with 4% paraformaldehyde for 15 minutes at room temperature to preserve subcellular localization.
Immunofluorescence Staining:
- Permeabilize cells with 0.1% Triton X-100 for 10 minutes.
- Block with 5% normal serum for 30 minutes.
- Incubate with primary antibodies against target proteins (transcription factors, signaling molecules) for 60 minutes.
- Use fluorescently conjugated secondary antibodies for detection, with careful validation of specificity.
- Include nuclear counterstain (DAPI or Hoechst) for spatial reference.
IFC Data Acquisition and Analysis:
- Acquire images using high-resolution mode (40× or 60× objective) to resolve subcellular details.
- Collect sufficient events for statistical power (minimum 10,000 cells per condition).
- Utilize spot counting algorithms for discrete puncta analysis or granularity features.
- Apply morphological masks to define cellular compartments (nucleus, cytoplasm).
- Calculate translocation indices using ratiometric measurements of fluorescence distribution between compartments.
- Implement correlation analysis for co-localization of multiple targets.
Advanced Technological Innovations
Ultra-High-Throughput IFC Systems
Recent breakthroughs in optical time-stretch (OTS) imaging have transformed the throughput capabilities of IFC systems. The latest OTS-IFC technology demonstrates remarkable performance metrics [91]:
- Throughput: Real-time analysis exceeding 1,000,000 events per second, representing a 100-fold improvement over conventional IFC systems.
- Spatial Resolution: Sub-micron resolution (780 nm) enabling detailed morphological analysis even at extreme throughput rates.
- Flow Velocity: Cell analysis at speeds up to 15 meters per second, facilitated by advanced microfluidic focusing.
- Data Processing: Integrated field-programmable gate arrays (FPGAs) for real-time image processing and classification, addressing the traditional bottleneck of data handling in high-speed systems.
This unprecedented throughput enables applications previously impractical with conventional IFC, including comprehensive analysis of rare stem cell subpopulations in heterogeneous cultures, large-scale compound screening campaigns, and detailed kinetic studies of dynamic cellular processes.
Artificial Intelligence and Machine Learning Integration
The integration of artificial intelligence (AI) and machine learning (ML) technologies represents the most significant advancement in IFC data analysis, addressing the challenge of extracting biologically meaningful information from complex image datasets [3] [88]. Current applications include:
- Automated Cell Classification: Deep learning algorithms trained to recognize specific cell types, differentiation states, or pathological features based on combined morphological and fluorescence patterns.
- Morphological Phenotyping: Unsupervised clustering approaches to identify novel cellular subtypes based on subtle morphological differences not discernible by conventional analysis.
- Predictive Modeling: Correlation of IFC-derived features with functional outcomes to build predictive models of stem cell behavior or therapeutic potential.
- Quality Control: Automated detection of sample preparation artifacts or instrument anomalies to ensure data quality in high-throughput environments.
These computational advances substantially enhance the objectivity, reproducibility, and information yield of IFC experiments, particularly in complex applications such as stem cell characterization and quality assessment for cellular therapies.
Implementation Considerations and Future Directions
Practical Implementation Guidelines
Successful implementation of IFC in high-throughput stem cell screening requires careful consideration of several practical aspects:
- Sample Preparation Optimization: Maintain single-cell suspensions without aggregates through enzymatic dissociation and filtering. Optimize cell density to balance throughput with image quality.
- Fluorescent Panel Design: Account for potential spectral overlap across both fluorescence and brightfield channels. Include compensation controls and validate antibody performance in IFC applications.
- Data Management Strategy: Implement robust data storage solutions capable of handling large image file sizes (typically 1-10 MB per cell). Consider tiered storage approaches with immediate access to analysis results and archival of raw images.
- Quality Control Procedures: Establish routine performance tracking using standardized reference materials. Monitor key parameters including laser power, detector efficiency, and image resolution.
Emerging Applications and Future Development
The future trajectory of IFC technology points toward several promising directions with particular relevance for stem cell research and drug discovery:
- Live-Cell Dynamics: Implementation of environmental control systems for extended live-cell imaging to track temporal processes such as stem cell division, migration, and differentiation dynamics.
- Spatial Omics Integration: Combination of IFC with spatial transcriptomics and proteomics methods to correlate morphological features with comprehensive molecular profiles.
- Clinical Translation: Development of standardized IFC assays for quality control of stem cell-based therapeutics and clinical monitoring of cellular responses.
- Microenvironment Modeling: Advancement of co-culture systems and 3D analysis capabilities to study stem cell behavior in more physiologically relevant contexts.
As IFC technology continues to evolve, its unique combination of high-throughput capability and rich morphological information positions it as an increasingly essential tool for unraveling the complexity of stem cell biology and accelerating the development of regenerative therapies.
The integration of artificial intelligence (AI) and machine learning (ML) is fundamentally transforming data analysis within high-throughput flow cytometry, a cornerstone technology in stem cell research. As flow cytometry advances towards higher-color panels and increased sample throughput, the volume and complexity of data generated have surpassed the capabilities of traditional manual analysis [93]. This evolution is particularly critical in stem cell screening, where the precise characterization of cell populations—such as assessing the pluripotency of induced pluripotent stem cells (iPSCs) or validating differentiation protocols—is essential for regenerative medicine and drug discovery [94]. AI and ML not only automate labor-intensive analytical tasks but also uncover subtle, multidimensional patterns in single-cell data that are often invisible to the human eye, thereby setting a new benchmark for performance in accuracy, reproducibility, and speed.
The Data Challenge in Modern Flow Cytometry
The transition to high-dimensional flow cytometry is a key driver for adopting computational methods. Modern instruments can measure over 40 parameters simultaneously at speeds of tens of thousands of cells per second, generating enormous, intricate datasets [29]. In stem cell research, this high-throughput capability is applied to tasks like lineage differentiation and functional characterization, but it creates a significant bottleneck in data interpretation.
Traditional manual gating, where analysts sequentially select cell populations on two-dimensional scatter plots, is poorly suited to this new reality. It is inherently low-dimensional, subjective, time-consuming, and struggles to integrate information across all measured parameters effectively [93]. Furthermore, the lack of standardization in gating strategies across different laboratories and instruments leads to significant variability, siloing millions of datasets and limiting their utility for collaborative AI applications [95]. This directly impacts the reproducibility of stem cell research, where consistent identification of pluripotent or early-differentiated cell populations is critical.
A Primer on Machine Learning Methods for Flow Cytometry
Machine learning offers a suite of tools to overcome the limitations of manual analysis. The core ML paradigms—supervised, unsupervised, and weakly supervised learning—each address different analytical challenges in the flow cytometry workflow. The table below summarizes their key characteristics and applications in stem cell research.
Table 1: Machine Learning Paradigms in Flow Cytometry Data Analysis
| ML Paradigm | Core Principle | Common Algorithms | Representative Applications in Stem Cell Research |
|---|---|---|---|
| Supervised Learning | Models are trained on data with pre-defined "ground truth" labels provided by experts [93]. | Logistic Regression, Support Vector Machines, Neural Networks [93]. | Automated classification of cell types (e.g., pluripotent vs. differentiated); disease state detection (e.g., AML vs. non-neoplastic) [96]. |
| Unsupervised Learning | Identifies inherent structures or groupings in data without pre-defined labels [93]. | k-means, FlowSOM, t-SNE, UMAP [93]. | Discovery of novel or rare cell populations; hypothesis generation during differentiation; quality control of cell cultures. |
| Weakly/Semi-Supervised | Leverages a limited set of labels, often inferred from dataset structure, to improve model performance [93]. | Various custom frameworks. | Analyzing large datasets where exhaustive manual labeling is impractical; improving model generalizability. |
A critical consideration in deploying any ML model is the bias-variance trade-off. An over-simplified model with high bias may underfit the data, failing to capture relevant biological patterns. Conversely, an overly complex model with high variance may overfit the training data, learning noise and performing poorly on new, unseen data [93]. Techniques like cross-validation and regularization are essential to strike a balance and ensure the model generalizes effectively to data from different instruments, protocols, or cell lines [93].
Benchmarking ML Performance in Stem Cell Applications
The performance of ML models is quantitatively benchmarked using well-established metrics. In a seminal study demonstrating cross-institute standardization, a machine learning framework for differentiating acute myeloid leukemia (AML) from non-neoplastic conditions achieved exceptional performance [96]. The following table benchmarks its results on training and independent validation cohorts, highlighting its robust generalizability.
Table 2: Performance Benchmark of an ML Framework for AML Classification via Flow Cytometry [96]
| Performance Metric | Training Set (215 Samples) | Independent Validation Set (196 Samples) |
|---|---|---|
| Accuracy | 98.15% | 93.88% |
| Area Under Curve (AUC) | 99.82% | 98.71% |
| Sensitivity | 97.30% | Information Not Specified |
| Specificity | 99.05% | Information Not Specified |
This framework's success is attributed to its focus on 16 common parameters (e.g., CD34, CD45, CD117) found across different institutional panel designs, proving that standardized analysis is achievable despite technical variability [96]. For stem cell researchers, this approach can be adapted to standardize the analysis of key markers like those for pluripotency (e.g., TRA-1-60, SSEA-4) or early lineage commitment across different laboratory setups.
Experimental Protocols for ML-Enhanced Stem Cell Analysis
Basic Protocol: AI-Ready Staining of iPSCs for Pluripotency Assessment
This protocol is optimized for the efficient measurement of undifferentiated stem cell markers in human iPSCs, generating high-quality data suitable for downstream ML analysis [94].
Key Reagent Solutions:
- Culture Medium: Appropriate iPSC maintenance medium.
- Dissociation Reagent: Animal component-free cell dissociation buffer.
- Staining Buffer: Phosphate-buffered saline (PBS) supplemented with fetal bovine serum (FBS) or bovine serum albumin (BSA).
- Viability Stain: e.g., Fixable Viability Dye.
- Antibody Panel: Fluorochrome-conjugated antibodies against undifferentiated stem cell markers.
Methodology:
- iPSC Culture and Collection: Grow iPSCs to ~80% confluency. Dissociate into a single-cell suspension using a gentle dissociation reagent. Quench the reaction with culture medium and perform a cell count.
- Cell Staining: a. Viability Staining: Resuspend the cell pellet in staining buffer containing a fixable viability dye. Incubate in the dark for 20-30 minutes, then wash. b. Surface Marker Staining: Resuspend the cell pellet in staining buffer containing a pre-titrated cocktail of antibodies against surface markers (e.g., CD90, CD73, CD105, CD45). Incubate in the dark for 30 minutes on ice, then wash. c. Fixation and Permeabilization: Fix and permeabilize the cells using a commercial intracellular staining kit. d. Intracellular Marker Staining: Resuspend the fixed/permeabilized cells in a permeabilization buffer containing a pre-titrated cocktail of antibodies against intracellular markers (e.g., Nanog, OCT-3/4). Incubate in the dark for 30-60 minutes, then wash and resuspend in staining buffer [94].
- Flow Cytometry Acquisition: Acquire data on a flow cytometer. It is critical to establish and consistently apply instrument settings (laser voltages, compensation) using control samples (unstained, single-color controls, and fluorescence-minus-one (FMO) controls). Record data for a statistically significant number of events (e.g., >10,000 viable single cells) [94].
Advanced Protocol: Building a Supervised Classifier for Pluripotency Status
This protocol outlines the process of developing an ML model to automatically classify the pluripotency status of iPSC samples based on flow cytometry data.
Workflow:
Methodology:
- Data Preprocessing:
- Data Cleaning: Apply quality control gates to remove debris (low FSC-A/SSC-A), doublets (using FSC-H vs. FSC-A), and dead cells (using viability dye) [93].
- Transformation: Apply appropriate transformations (e.g., arcsinh, logicle) to the fluorescence data to make it more suitable for ML algorithms [93].
- Standardization: Use algorithms like FlowSOM or dimension reduction techniques like UMAP to align and standardize data from different batches or experiments, mitigating technical variance [93].
- Expert Manual Annotation (Labeling): A subject matter expert (e.g., a pathologist or senior scientist) reviews the preprocessed data from a representative set of samples and assigns a "ground truth" label to each cell or sample. For example: "Pluripotent," "Early Differentiated," or "Differentiated" [93]. This creates the labeled dataset for supervised learning.
- Model Training & Validation:
- The curated dataset is split into a training set (e.g., 70-80%) and a hold-out test set (e.g., 20-30%).
- A model, such as a Support Vector Machine (SVM) or a simple neural network, is trained on the training set to learn the relationship between the input parameters (marker expression levels) and the expert-assigned labels [93] [96].
- Model performance is rigorously evaluated on the hold-out test set using the metrics in Table 2 (Accuracy, AUC, etc.) to ensure it generalizes to new data [93].
The Scientist's Toolkit: Essential Research Reagents and Materials
The following table details key reagents and materials essential for conducting robust, AI-ready flow cytometry experiments in stem cell research.
Table 3: Essential Research Reagent Solutions for AI-Ready Stem Cell Flow Cytometry
| Item | Function & Importance | Example Application |
|---|---|---|
| GMP-grade, Animal-Free Cell Culture Media | Ensures cell expansion under defined, reproducible conditions, minimizing batch-to-batch variability and enhancing translational potential [97]. | Culturing iPSCs prior to analysis or differentiation [97]. |
| Validated Antibody Panels | Fluorochrome-conjugated antibodies against key markers. Pre-titrated and validated panels are crucial for consistent, high-quality data. | Staining for pluripotency (OCT-4, SOX2, NANOG), surface markers (CD73, CD90, CD105), and lineage exclusion (CD45) [94] [97]. |
| Viability Stains | Distinguishes live from dead cells during analysis, a critical pre-processing step for accurate interpretation and gating. | Fixable viability dyes are preferred to avoid interference with antibody staining. |
| Single-Color Controls & Compensation Beads | Essential for setting up the cytometer and calculating spectral overlap compensation, ensuring fluorescence signal accuracy. | Used during data acquisition for all experiments. |
| Reference Control Cells | Provides a biological standard for instrument performance and assay validation, critical for cross-institute data harmonization [95]. | Including known positive (e.g., a validated pluripotent line) and negative (e.g., a fully differentiated line) controls in every run. |
Visualization and Interpretation of ML Results
Understanding how an ML model reaches its conclusions is as important as the classification itself. Dimension reduction techniques are invaluable for visualizing high-dimensional data in two or three dimensions.
By comparing a UMAP plot colored by expert annotation with one colored by the ML model's predictions, researchers can visually benchmark the model's performance, identify any consistent misclassifications, and potentially discover new, biologically relevant cell states that were not part of the original labeling schema [93]. This iterative process of validation and discovery is a key strength of the ML-integrated workflow.
The benchmarking data and protocols presented herein unequivocally demonstrate that AI and machine learning are not merely incremental improvements but are fundamental to the future of high-throughput flow cytometry in stem cell research. By providing a path toward standardized, reproducible, and high-dimensional analysis, ML directly addresses the core challenges of scalability and objectivity. As these tools become more accessible and integrated into laboratory information management systems, they will accelerate the translation of basic stem cell research into reliable clinical applications and therapeutic discoveries, ultimately setting a new standard for performance and precision in the field.
Conclusion
High-throughput flow cytometry stands as an indispensable pillar in modern stem cell research and drug discovery, uniquely enabling the rapid, multi-parametric analysis of complex cellular systems at a single-cell resolution. By integrating robust foundational principles with automated methodological workflows, researchers can effectively deconvolute stem cell heterogeneity and identify novel therapeutic targets, as demonstrated by discoveries like JAM-A in glioblastoma. While technical challenges exist, they are surmountable with systematic optimization and troubleshooting. Looking ahead, the convergence of HT-FC with cutting-edge technologies like ultra-high-speed imaging flow cytometry, artificial intelligence, and advanced data analytics promises to further revolutionize the field. This evolution will enhance our ability to not only understand stem cell biology at an unprecedented scale but also to accelerate the development of targeted therapies for cancer, regenerative medicine, and a host of other clinical applications.
References
- 1. Flow Cytometry: a versatile tool for stem cell research [https://pubmed.ncbi.nlm.nih.gov/41289730/]
- 2. Flow Cytometry Applications: Advanced Uses, Benefits ... [https://cellcarta.com/science-hub/flow-cytometry-applications-advanced-uses-benefits-and-limitations/]
- 3. Imaging flow cytometry: from high - resolution ... [https://www.frontiersin.org/journals/bioengineering-and-biotechnology/articles/10.3389/fbioe.2025.1580749/full]
- 4. High-throughput fluorescence lifetime imaging flow cytometry [https://www.nature.com/articles/s41467-024-51125-y]
- 5. FACS-Based Assessment of Human Hematopoietic Stem ... [https://pmc.ncbi.nlm.nih.gov/articles/PMC12429214/]
- 6. Flow Cytometry Market Size, Growth & Trends Report 2030 [https://www.mordorintelligence.com/industry-reports/global-flow-cytometry-market-industry]
- 7. Validated methods for isolation and qualification of ... [https://translational-medicine.biomedcentral.com/articles/10.1186/s12967-025-06972-8]
- 8. Comprehensive Flow Cytometry Protocol for Profiling B ... [https://www.protocols.io/view/from-bone-to-flow-comprehensive-flow-cytometry-pro-ha2ib2gcf.html]
- 9. Powerful flow cytometry technology accelerates stem cell ... [https://www.selectscience.net/article/powerful-flow-cytometry-technology-accelerates-stem-cell-research]
- 10. Multi-Parameter Fluorescence-Activated Cell Sorting and ... [https://pmc.ncbi.nlm.nih.gov/articles/PMC3052971/]
- 11. Flow cytometry markers guide [https://www.abcam.com/en-us/knowledge-center/flow-cytometry/flow-cytometry-markers]
- 12. Flow Cytometry: a versatile tool for stem cell research [https://www.sciencedirect.com/science/article/abs/pii/S0006291X25017498]
- 13. High throughput flow cytometry screening reveals a novel ... [https://pmc.ncbi.nlm.nih.gov/articles/PMC3899718/]
- 14. Publishing flow cytometry data - PMC [https://pmc.ncbi.nlm.nih.gov/articles/PMC2822558/]
- 15. Flow Cytometry Market Analysis and Forecast, 2025-2035 [https://finance.yahoo.com/news/flow-cytometry-market-analysis-forecast-151100522.html]
- 16. Flow Cytometry Market Size and Share Forecast Outlook ... [https://www.factmr.com/report/4633/flow-cytometry-market]
- 17. Flow Cytometry Industry worth $9.85 billion by 2033 [https://www.marketsandmarkets.com/PressReleases/flow-cytometry.asp]
- 18. Flow Cytometry Market Size and Forecast 2025 to 2034 [https://www.precedenceresearch.com/flow-cytometry-market]
- 19. Europe Flow Cytometry Research Report 2025: Market to [https://www.globenewswire.com/news-release/2025/09/18/3152221/28124/en/Europe-Flow-Cytometry-Research-Report-2025-Market-to-Surpass-2-Billion-by-2035-Expanding-Use-in-Drug-Discovery-Translational-Research-and-Clinical-Trials.html]
- 20. Protocol Resources for Flow Cytometry [https://www.stemcell.com/technical-resources/methods-library/characterization-assays/protocols/flow-cytometry.html]
- 21. Ultra-high-scale cytometry-based cellular interaction ... [https://www.nature.com/articles/s41592-025-02744-w]
- 22. New & Emerging Spectral Flow Cytometry Instrumentation [https://fluorofinder.com/new-and-emerging-spectral-flow-cytometry-instrumentation/]
- 23. Beyond the Limits: How Is Spectral Flow Cytometry ... [https://www.mdpi.com/2073-4409/14/13/997]
- 24. Thermo Fisher Scientific Launches New Spectral Flow ... [https://www.pharmafocusamerica.com/pharma-exclusives/press-releases/thermo-fisher-scientific-launches-new-spectral-flow-cytometer-offering]
- 25. Thermo Fisher Scientific Launches New Spectral Flow ... [https://www.diagnosticsworldnews.com/news/2025/05/30/thermo-fisher-scientific-launches-new-spectral-flow-cytometer-offering-increased-speed-versatility-and-reliability-to-labs]
- 26. Flow Cytometry Market 2025-2033 Trends [https://www.datamintelligence.com/research-report/flow-cytometry-market]
- 27. Bigfoot Spectral Cell Sorter Resources [https://www.thermofisher.com/ng/en/home/life-science/cell-analysis/flow-cytometry/flow-cytometers/bigfoot-spectral-cell-sorter/resources.html]
- 28. How high-throughput flow cytometry is transforming drug ... [https://www.drugdiscoverynews.com/how-high-throughput-flow-cytometry-is-transforming-drug-discovery-16312]
- 29. The future direction and applications of flow cytometry [https://www.ddw-online.com/the-future-direction-and-applications-of-flow-cytometry-34291-202504/]
- 30. Imaging flow cytometry: from high - resolution morphological ... [https://pmc.ncbi.nlm.nih.gov/articles/PMC12098090/]
- 31. 10 Tips for High-Throughput Flow Cytometry [https://www.bioradiations.com/10-tips-for-optimizing-high-throughput-flow-cytometry-assays1125/]
- 32. A Fully Automated High-Throughput Flow Cytometry ... [https://pmc.ncbi.nlm.nih.gov/articles/PMC6055113/]
- 33. Automated High-Throughput Flow Cytometry for ... [https://www.sciencedirect.com/science/article/pii/S2472555222068940]
- 34. Quantitative phase imaging with temporal kinetics predicts ... [https://www.nature.com/articles/s41467-025-61846-3]
- 35. High throughput phenotyping | Cancer Drug Screening [https://www.championsoncology.com/2025aacr-high-throughput-phenotyping-and-drug-discovery-using-the-tumorgraft3d-co-culture-platform-and-flow-cytometry]
- 36. Tumor organoid-immune co-culture models: exploring a ... [https://www.nature.com/articles/s41420-025-02407-x]
- 37. Flow Cytometry: Impact On Early Drug Discovery - PMC [https://pmc.ncbi.nlm.nih.gov/articles/PMC4606936/]
- 38. Advancing Drug Discovery: The Power of Flow Cytometry ... [https://kcasbio.com/blogs/advancing-drug-discovery-the-power-of-flow-cytometry-in-compound-screening/]
- 39. Building complex in vitro models to support new approach ... [https://www.drugdiscoverynews.com/building-complex-in-vitro-models-to-support-new-approach-methodologies-16466]
- 40. A protocol for high - throughput for immunomodulatory... screening [https://pmc.ncbi.nlm.nih.gov/articles/PMC10365952/]
- 41. with PI staining | Abcam Flow cytometry [https://www.abcam.com/en-us/technical-resources/protocols/flow-cytometry-with-propidium-iodide-staining]
- 42. Isolation and High Apoptosis Assay of... Throughput Flow Cytometric [https://bio-protocol.org/en/bpdetail?id=3640&type=0]
- 43. Data analysis in flow cytometry [https://www.abcam.com/en-us/technical-resources/guides/flow-cytometry-guide/data-analysis-in-flow-cytometry]
- 44. How to Interpret Flow Cytometry Data [https://www.fortislife.com/resources/antibody-resources/how-to-interpret-flow-cytometry-data]
- 45. High-throughput flow cytometry screening reveals a role for ... [https://pubmed.ncbi.nlm.nih.gov/24373972/]
- 46. JAM-A as a prognostic factor and new therapeutic target in ... [https://www.nature.com/articles/leu2017287]
- 47. Protocol for high-throughput compound screening using ... [https://pmc.ncbi.nlm.nih.gov/articles/PMC7985391/]
- 48. Comparing Data Tables - New in JMP 16 [https://community.jmp.com/t5/Learning-Center/Comparing-Data-Tables-New-in-JMP-16/ta-p/381892]
- 49. Compare Data Tables - JMP User Community [https://community.jmp.com/t5/JMP-On-Air/Compare-Data-Tables/ta-p/257361]
- 50. JAM-A overexpression is related to disease progression in ... [https://www.nature.com/articles/s41598-017-07964-5]
- 51. Application of High-Throughput Flow Cytometry in Early ... [https://www.sciencedirect.com/science/article/pii/S2472555222068903]
- 52. Immuno-Oncology Research Using Flow Cytometry [https://www.thermofisher.com/us/en/home/life-science/cell-analysis/flow-cytometry/research-areas-methods-flow-cytometry/immuno-oncology-research-using-flow-cytometry.html]
- 53. Flow Cytometry Protocol | Abcam [https://www.abcam.com/en-us/technical-resources/protocols/flow-cytometry-for-intracellular-and-extracellular-targets]
- 54. High Throughput Screening by Cytometry [https://www.sartorius.com/en/products/high-throughput-cytometry]
- 55. Robust Expansion of Hematopoietic Stem Cells Ex Vivo ... [https://pubmed.ncbi.nlm.nih.gov/?term=Methods+Mol+Biol%5Bjour%5D+AND+2024%2F11%2F26%5Bedat%5D]
- 56. Hematopoietic Stem Cell Culture Methods [https://www.sigmaaldrich.com/US/en/technical-documents/protocol/cell-culture-and-cell-culture-analysis/stem-cell-culture/hematopoietic-stem-cell-culture-protocols?srsltid=AfmBOooOVPN1YMYCQ0Jr3Wtr0a7yOV3bzax0NugIxTjs064DEa9eIVSZ]
- 57. Widely applicable, extended flow cytometric stem cell ... [https://www.nature.com/articles/s41598-022-22339-1]
- 58. Infectious Disease Research: Forging Ahead with ... [https://www.sartorius.com/en/knowledge/science-snippets/infectious-disease-research-forging-ahead-with-advanced-flow-cytometry-1447314]
- 59. Fluorochrome Faceoff Series: Performance Data ... [https://www.bdbiosciences.com/en-us/learn/science-thought-leadership/blogs/flow-cytometry-fluorochrome-performance-data-results]
- 60. No or weak signal in Flow cytometry [https://www.abcam.cn/technical-resources/troubleshooting/no-or-weak-signal-flow-cytometry]
- 61. Flow Cytometry Color Matching Principles: Lesson 2 [https://www.elabscience.com/resources/flow-cytometry-experiment-guidelines-and-q&a/1860?srsltid=AfmBOoqtYfoAuDfHU7F9VvSm38fNEPC2G0_vIBv38a6cM-_oIT9eNyDF]
- 62. The Power of Reagent Titration in Flow Cytometry - PMC [https://pmc.ncbi.nlm.nih.gov/articles/PMC11506663/]
- 63. Top 7 Flow Cytometer Reagents Companies in Global 2025 [https://www.globalgrowthinsights.com/blog/flow-cytometer-reagents-companies-807]
- 64. Troubleshooting Flow Cytometry Issues [https://www.bosterbio.com/protocol-and-troubleshooting/flow-cytometry-troubleshooting?srsltid=AfmBOoq04e_9XJKEr_1YGHvLTBrF8SgmVqQ3vzQU1SsOEHIKQGOXAO09]
- 65. 5 Tips To Reduce Autofluorescence [https://www.bosterbio.com/blog/post/5-tips-to-reduce-autofluorescence?srsltid=AfmBOoruayjukg8IW7uja3sidZUnl5VhG-DfGyB2z_I7or-tyx2t7rp7]
- 66. A Guide to Spectral Flow Cytometry Fluorophore Selection [https://www.thermofisher.com/us/en/home/life-science/cell-analysis/flow-cytometry/flow-cytometry-learning-center/flow-cytometry-resource-library/flow-cytometry-methods/spectral-flow-cytometry-fluorophore-selection.html]
- 67. Spectral Flow Cytometry: The Current State and Future of ... [https://pmc.ncbi.nlm.nih.gov/articles/PMC12193525/]
- 68. Compensation Controls - McGovern Medical School [https://med.uth.edu/imm/flow-cytometry-services/protocols-and-guidelines/compensation-controls/]
- 69. Compensation in Flow Cytometry [https://fluorofinder.com/compensation-flow-cytometry/]
- 70. Flow Cytometry Sample Preparation: Best Practices [https://kcasbio.com/blogs/sample-preparation-for-flow-cytometry-best-practices/]
- 71. Flow Cytometry Sample Preparation Protocol [https://anilocus.com/flow-cytometry-sample-preparation-protocol/?srsltid=AfmBOoohIbw0qS_EIy96PkEJBiXC7EaeIIAUe57AozwGD8fr7g7ybLeA]
- 72. Guidelines for preparation and flow cytometry analysis of ... [https://pmc.ncbi.nlm.nih.gov/articles/PMC11739683/]
- 73. Flow cytometry protocol for cell death analysis in glioblastoma ... [https://journals.plos.org/plosone/article?id=10.1371/journal.pone.0327660]
- 74. The Basics of High-Throughput Screening (HTS), through ... [https://www.sartorius.com/en/products/high-throughput-cytometry/high-throughput-cytometry-resources/the-basics-of-high-throughput-screening-through-flow-cytometry]
- 75. High-Throughput Automation With the Attune NxT ... [https://www.thermofisher.com/us/en/home/life-science/cell-analysis/flow-cytometry/flow-cytometry-learning-center/flow-cytometry-resource-library/flow-cytometry-application-notes/high-throughput-automation-attune-nxt-autosampler.html]
- 76. 7 Tips for Optimizing Your Flow Cytometry Experiments [https://www.bdbiosciences.com/en-us/learn/science-thought-leadership/blogs/optimizing-tips-flow-cytometry-experiments]
- 77. Optimizing Flow Cytometry Experiments – Reddot Biotech [https://www.bio-connect.nl/news/optimizing-flow-cytometry-experiments-reddot-biotech/]
- 78. Ten Tips for Successful Flow Cytometry [https://www.biotechniques.com/cell-and-tissue-biology/how-to-10-tips-for-successful-flow-cytometry/]
- 79. Junctional adhesion molecule-A is dispensable for myeloid ... [https://www.frontiersin.org/journals/immunology/articles/10.3389/fimmu.2022.1003975/full]
- 80. Junctional adhesion molecule A orchestrates endothelial ... [https://www.sciencedirect.com/science/article/pii/S104366182500221X]
- 81. Guidelines — International Society for Stem Cell Research [https://www.isscr.org/guidelines]
- 82. Current Landscape of FDA Stem Cell Approvals and Trials ... [https://www.reprocell.com/blog/current-landscape-of-fda-stem-cell-approvals-and-trials-2023-2025]
- 83. High-Content Screening (HCS) and High-Throughput ... [https://biobide.com/difference-between-hcs-and-hts]
- 84. High Content What? Deciphering between ... [https://blog.crownbio.com/differences-between-hci-hcs-hca]
- 85. Cell-Based Screening Using High-Throughput Flow Cytometry [https://pmc.ncbi.nlm.nih.gov/articles/PMC3045571/]
- 86. Evolution and impact of high content imaging [https://www.sciencedirect.com/science/article/pii/S2472555223000667]
- 87. When High Content Screening Meets High Throughput [https://www.ddw-online.com/when-high-content-screening-meets-high-throughput-1151-201112/]
- 88. Imaging Flow Cytometry: Development, Present Applications, and Future Challenges - PMC [https://pmc.ncbi.nlm.nih.gov/articles/PMC11054958/]
- 89. Comparing Flow Cytometry with Imaging Cytometry [https://www.labx.com/resources/comparing-flow-cytometry-with-imaging-cytometry/5523]
- 90. The rise of high-throughput flow cytometry in drug discovery [https://www.drugtargetreview.com/article/34829/the-rise-of-high-throughput-flow-cytometry-in-drug-discovery/]
- 91. Imaging flow cytometry with a real-time throughput beyond 1,000,000 events per second | Light: Science & Applications [https://www.nature.com/articles/s41377-025-01754-9]
- 92. Imaging Flow Cytometry: Methods and Protocols [https://link.springer.com/book/10.1007/978-1-4939-3302-0]
- 93. Machine Learning Methods in Clinical Flow Cytometry - PMC [https://pmc.ncbi.nlm.nih.gov/articles/PMC11816335/]
- 94. Optimized, Efficient Measurement of the Expression ... [https://pubmed.ncbi.nlm.nih.gov/40028708/]
- 95. AI and flow cytometry - PubMed - NIH [https://pubmed.ncbi.nlm.nih.gov/41212078/]
- 96. A machine learning framework for cross-institute ... [https://www.sciencedirect.com/science/article/pii/S0010482525007450]
- 97. Optimizing mesenchymal stem cell therapy: from isolation to ... [https://bmcmolcellbiol.biomedcentral.com/articles/10.1186/s12860-025-00539-7]