Flow Cytometry vs. Mass Cytometry for Stem Cell Research: A Comprehensive Guide for 2025
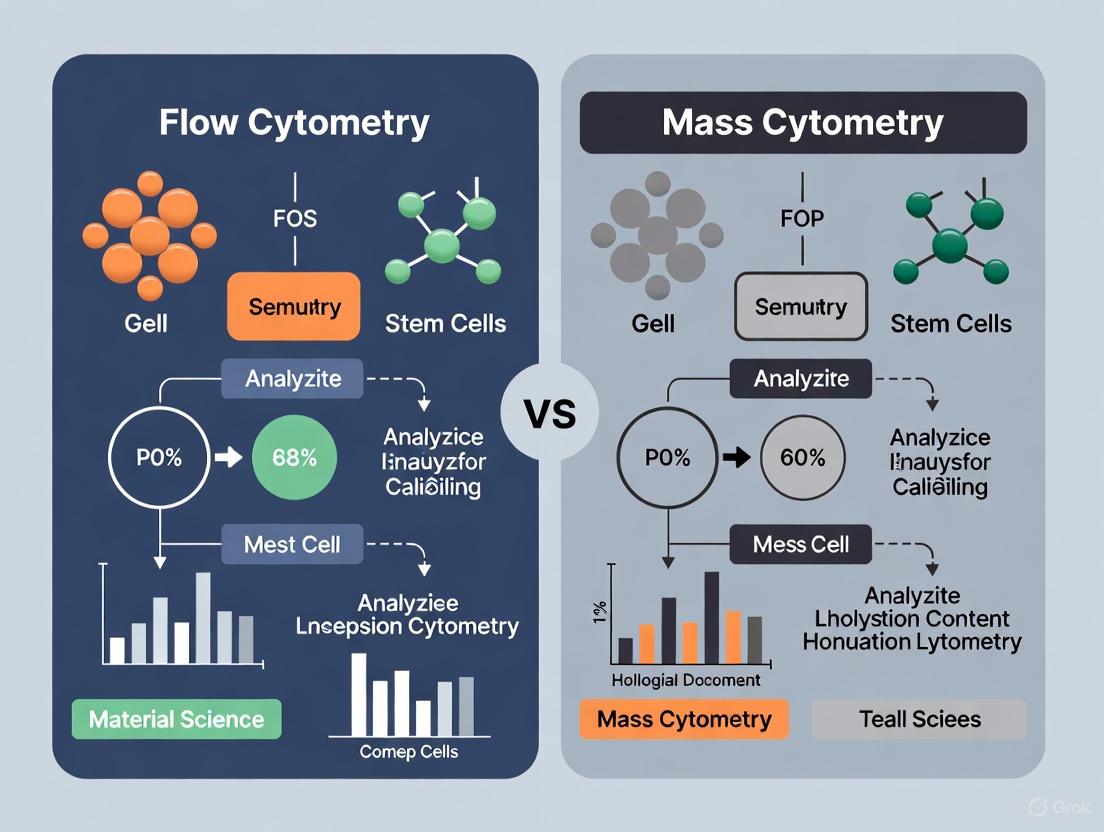
This article provides a detailed comparison of flow cytometry and mass cytometry, specifically tailored for stem cell researchers and drug development professionals.
Flow Cytometry vs. Mass Cytometry for Stem Cell Research: A Comprehensive Guide for 2025
Abstract
This article provides a detailed comparison of flow cytometry and mass cytometry, specifically tailored for stem cell researchers and drug development professionals. It covers the foundational principles of both technologies, explores their specific methodological applications in stem cell analysis—from immunophenotyping to tracking reprogramming dynamics—and offers practical troubleshooting guidance for panel design and sample preparation. A direct, evidence-based comparison equips scientists to select the optimal platform, balancing panel size, throughput, and sensitivity to overcome the unique challenges of studying rare and heterogeneous stem cell populations.
Core Principles: Demystifying Flow Cytometry and Mass Cytometry Technologies
In the field of single-cell proteomics, particularly within stem cell and drug development research, two high-dimensional technologies have emerged as leaders: flow cytometry (utilizing fluorescence detection) and mass cytometry (utilizing mass detection). While they share the common goal of characterizing individual cells, their fundamental detection principles create a divergence in their capabilities, applications, and optimal use cases. Flow cytometry detects the light emitted by fluorescent tags, a well-established method now supercharged by spectral technology which unmixes the full emission spectrum of fluorochromes [1]. In contrast, mass cytometry, or Cytometry by Time-of-Flight (CyTOF), represents a paradigm shift, using inductively coupled plasma mass spectrometry to detect antibodies tagged with heavy metal isotopes [2]. This article provides a detailed, objective comparison of these technologies, framing them within the context of stem cell research, and is supported by experimental data and methodological protocols to guide researchers and drug development professionals in their selection process.
Core Detection Principles and Instrumentation
The most fundamental difference between these technologies lies in their core detection systems, which dictates every subsequent aspect of performance, from panel design to data analysis.
Fluorescence-Based Detection (Flow Cytometry)
In conventional flow cytometry, the optical system is built on lasers, dichroic mirrors, and bandpass filters. Each fluorescent molecule has a characteristic emission spectrum, and the system uses filters to direct a narrow band of wavelengths to a specific detector, following a "one detector–one fluorophore" approach [1]. The complexity of this optical system grows with the number of parameters, as a 12-color instrument may contain over 40 optical filters [1]. Spectral flow cytometry revolutionizes this by capturing the entire emission spectrum of every fluorophore across a wide wavelength range (e.g., 32-73 detection channels) using a prism or diffraction grating [3] [1]. Mathematical unmixing algorithms then deconvolute these full spectra to identify the contribution of each individual fluorophore, significantly increasing the number of markers that can be analyzed simultaneously.
Mass-Based Detection (Mass Cytometry)
Mass cytometry replaces fluorochromes with stable heavy metal isotopes (e.g., lanthanides) as antibody tags. The detection system is fundamentally different: labeled cells are nebulized into a cloud of droplets, which are then vaporized, atomized, and ionized in an inductively coupled argon plasma [2]. The resulting ions, representing the metal tags, are passed through a time-of-flight mass spectrometer, which separates them based on their mass-to-charge ratio [2]. This process atomizes the cell, allowing for straightforward detection of intracellular markers without physical barriers [2]. A key advantage is the minimal background, as biological samples have virtually no endogenous signals in the metal mass ranges used (100-200 Dalton) [3] [2].
The diagram below illustrates the core detection workflows for each technology:
Figure 1: Core Detection Workflows for Fluorescence and Mass Cytometry
Comparative Performance Characteristics
The different detection principles of fluorescence and mass cytometry lead to distinct performance profiles, which are critical for experimental design. The table below summarizes key quantitative differences.
Table 1: Performance Comparison Between High-Parameter Fluorescence and Mass Cytometry
| Characteristic | Spectral Flow Cytometry | Mass Cytometry (CyTOF) |
|---|---|---|
| Detection Principle | Full fluorescence spectrum [1] | Heavy metal mass detection [2] |
| Max Parameters (Simultaneous) | Up to 40-50+ markers [1] | Up to 50+ markers (>100 channels theoretically) [3] [2] |
| Throughput (Cells/Sec) | High (~20,000 cells/sec) [4] | Low (~300-500 cells/sec) [4] |
| Sensitivity | ~40 molecules/cell [4] | ~400-500 molecules/cell [4] |
| Spectral Overlap/Spillover | Requires unmixing, even in spectral [1] | Minimal to no spillover [3] [2] |
| Autofluorescence | Affected by cellular autofluorescence [4] | No interference [2] [4] |
| Compensation | Required (complex for large panels) [1] | Not required [2] |
| Cell Sorting | Possible | Not possible [1] |
| Sample Throughput | High (rapid acquisition) [4] | Low (acquisition can take hours) [4] |
Analysis of Comparative Data
A 2023 study directly compared the performance of spectral flow cytometry and mass cytometry for studying innate myeloid cell populations, using panels with 21 common markers [4]. The research found an excellent correlation (Pearson's ρ=0.99) in the relative distribution of 24 identified leukocyte populations between the two technologies [4]. However, significant differences emerged in practical workflow metrics: SFC showed lower intra-measurement variability (median coefficient of variation of 42.5% vs. 68.0% for MC) and significantly shorter acquisition times (median 16 minutes vs. 159 minutes) [4]. Cell recovery rates were also higher in SFC (median 53.1% vs. 26.8% for MC), highlighting SFC's advantage for rapid analysis of large cell numbers [4].
Experimental Design and Methodologies
The choice between fluorescence and mass detection significantly impacts experimental design, from panel configuration to sample processing. Below are detailed protocols adapted from recent studies.
Protocol 1: Mass Cytometry for Stem Cell Reprogramming Analysis
This protocol is adapted from a 2019 study that used mass cytometry to analyze the reprogramming process of human induced pluripotent stem cells (hiPSCs) [5].
Table 2: Key Research Reagents for Mass Cytometry Stem Cell Analysis
| Reagent/Material | Function/Purpose |
|---|---|
| MaxPar X8 Antibody Labeling Kit | Conjugate antibodies to lanthanide metals |
| Cell-ID Intercalator-Ir | DNA intercalator for cell viability assessment |
| Antibodies: OCT4, SOX2, NANOG, TRA-1-60 | Pluripotency markers |
| Antibodies: CD44, c-MYC | Reprogramming progression markers |
| Antibodies: pRB, Cyclin B1, Ki67, pHistone H3 | Cell cycle analysis markers |
| Helios Mass Cytometer | Instrument for data acquisition |
Methodology:
- Reprogramming Timeline: Initiate hiPSC reprogramming from human fibroblasts using an episomal vector system. Sample cells at critical timepoints: day 0 (fibroblasts), day 10 (early reprogramming), day 20 (late reprogramming), and fully reprogrammed hiPSCs (day 30+) [5].
- Cell Staining:
- Resuspend up to 3×10^6 cells in PBS.
- Stain with cisplatin for viability assessment.
- Incubate with Fc receptor blocking antibody for 20 minutes.
- Add surface antibody cocktail, incubate for 15 minutes at 37°C followed by 15 minutes at 22°C.
- Fix and permeabilize cells using FoxP3 Fix/Perm buffer.
- Stain intracellular antigens for 2 hours at 4°C.
- Resuspend cells in Cell-ID Intercalator-Ir for DNA staining [5].
- Data Acquisition: Acquire data on a Helios mass cytometer with signal normalization using EQ normalization beads [5].
- Data Analysis: Apply computational tools like SPADE, PhenoGraph, and diffusion mapping to identify intermediate cell populations and track reprogramming trajectories [5].
Protocol 2: Comparative Analysis of Cytometry Technologies
This protocol is adapted from a 2023 Frontiers in Immunology study that directly compared SFC and MC performance for immune cell profiling [4].
Methodology:
- Sample Preparation: Collect fresh peripheral blood from healthy donors. Isolate peripheral blood mononuclear cells (PBMC) by Ficoll-Paque Plus gradient centrifugation within 2 hours of collection [4].
- Panel Design:
- Design two parallel panels (SFC and MC) with 21 common markers for cross-platform comparison.
- Use the same antibody clones whenever possible.
- Titrate all antibodies for optimal signal-to-noise ratio prior to the experiment [4].
- Staining and Acquisition:
- Stain 5×10^6 PBMC with each panel according to platform-specific protocols.
- Acquire SFC data on a Cytek Northern Lights instrument.
- Acquire MC data on a Helios mass cytometer.
- Data Analysis:
- Use unsupervised clustering analysis (e.g., FlowSOM) to identify cell populations.
- Compare relative population distributions, staining resolution, and technical variability between platforms.
- Assess correlation using statistical methods (e.g., Pearson's ρ) [4].
Applications in Stem Cell Research and Drug Development
Both technologies provide powerful insights into stem cell biology, albeit with different strengths that suit particular applications.
Stem Cell Research Applications
- Characterizing Reprogramming Intermediates: Mass cytometry has been successfully used to identify and track transient intermediate populations during hiPSC reprogramming that express neither fibroblast nor pluripotency markers, revealing distinct cell clusters along the reprogramming route [5].
- Hematopoietic Stem Cell (HSC) Profiling: A 2023 study demonstrated mass cytometry's utility in characterizing CD45dim/CD34+ stem cells in apheresis products from patients with hematological malignancies, showing excellent agreement with flow cytometry while enabling deeper subpopulation analysis [6].
- Cell Cycle and Pluripotency Interplay: Mass cytometry enables the correlation of pluripotency marker expression with cell cycle status. For example, research has revealed distinctive OCT4 expression patterns in the pHistone-H3high population (M phase) of hiPSCs, offering insights into cell cycle regulation in stem cells [5].
Drug Development Applications
- High-Content Immune Profiling: Mass cytometry excels in comprehensive immune monitoring to assess response to therapeutics, enabling the simultaneous measurement of phenotype and function to investigate drug interactions with the immune system [2].
- CAR-T Cell Therapy Development: The high-parameter capabilities of mass cytometry allow researchers to broadly investigate why CAR-T cell immunotherapies succeed or fail by simultaneously analyzing CAR-T cell phenotype and function, leading to discoveries such as CAR-T regulatory cells that significantly impact therapeutic outcome [2].
- Phospho-Signaling Analysis: Phospho-CyTOF enables detailed assessment of signaling pathways using antibodies targeting phosphorylated proteins, well-suited for measuring small changes above background common with low-abundance phosphoproteins in response to drug treatments [2].
Data Analysis and Computational Approaches
The high-dimensional data generated by both technologies, especially mass cytometry, requires specialized computational tools for interpretation.
Automated Analysis Pipelines
The shift from manual gating to automated analysis has been essential for handling cytometry data measuring 30-50 parameters [7]. Automated clustering methods like PhenoGraph, SPADE, and viSNE can process high-dimensional data in minutes, replacing what would otherwise require 10-20 hours of expert manual analysis [8]. These unsupervised approaches facilitate the discovery of novel cell populations without preconceived gating strategies [8].
Integrated Analysis Tools
Recent tools like CytoPheno address the phenotyping bottleneck by automatically assigning marker definitions and cell type names to unidentified clusters, combining marker expression analysis with Cell Ontology references to reduce subjectivity and time investment in data interpretation [8]. These tools are particularly valuable for standardizing analysis across large studies and multiple investigators, a critical consideration for clinical and drug development applications.
The choice between fluorescence and mass detection is not a matter of one technology being superior, but rather selecting the right tool for specific research questions and constraints.
Spectral flow cytometry is the preferred choice when high cell throughput, rapid turnaround time, and cell sorting capabilities are required. Its superior sensitivity makes it ideal for detecting low-abundance antigens, and the technology is more readily accessible in most core facilities. The ability to perform spectral cell sorting based on high-parameter panels is a significant advantage for functional follow-up studies.
Mass cytometry remains indispensable for the most highly multiplexed panels (40+ parameters), particularly when analyzing samples with high autofluorescence (e.g., epithelial cells, neurons) or when minimal background signal is critical. Its straightforward panel design without compensation concerns makes it valuable for exploratory studies and systems-level immune profiling in both basic research and clinical trials.
For comprehensive research programs, many laboratories are implementing a complementary approach, using mass cytometry for high-parameter discovery and spectral flow cytometry for validation and higher-throughput applications. This integrated strategy leverages the unique strengths of both detection paradigms to advance stem cell research and therapeutic development.
Historical Trajectory and Recent Instrumental Advances
Flow cytometry (FC) and mass cytometry, known as cytometry by time-of-flight (CyTOF), are cornerstone technologies in modern single-cell analysis, particularly in stem cell research. The historical trajectory of flow cytometry began with its first prototype, the Impulse Cytophotometer (ICP) 11, developed in 1968 by Wolfgang Göhde [3]. This instrument utilized light absorption as its detection method. A significant evolution occurred in 1974 when Becton Dickinson developed the FACS II, which enabled both optical measurements and droplet sorting [3]. Over subsequent decades, manufacturers focused intensely on enhancing fluorescence detection capabilities, progressing from instruments measuring three colors simultaneously to state-of-the-art systems like the BD FACSymphony A5, equipped with 9 lasers and 50 detectors [3].
Mass cytometry emerged as a revolutionary technology that combines the principles of traditional flow cytometry with mass spectrometry [9]. Instead of using fluorescent labels, it utilizes antibodies tagged with heavy metal isotopes to measure cellular parameters [10]. This fundamental difference in detection methodology addresses a key limitation of conventional flow cytometry—spectral overlap between fluorochromes—by providing minimal channel crosstalk due to the detection of highly purified isotopes [11]. The current most advanced mass cytometer from Standard BioTools, the CyTOF XT, is capable of quantifying 135 channels simultaneously [3], while Chinese manufacturers like Polaris and Powclin have launched instruments with 140 and 259 channels respectively [3], signaling rapid advancement and increased competition in the field. These technological platforms have become indispensable tools for researchers seeking to unravel the complexity of stem cell heterogeneity, differentiation pathways, and therapeutic potential.
Technical Comparison of Flow Cytometry and Mass Cytometry
The fundamental difference between conventional flow cytometry and mass cytometry lies in their detection systems and labeling methodologies. Conventional flow cytometry uses optical filters, dichroic mirrors, and photomultiplier tubes (PMTs) to separate and detect light emitted by fluorescently-labeled antibodies, following a "one detector–one fluorophore" approach [1]. This system is limited by spectral overlap between fluorochromes, which requires mathematical compensation [1]. In contrast, mass cytometry employs antibodies conjugated to heavy metal isotopes and detects them using time-of-flight mass spectrometry, effectively eliminating spectral overlap and enabling the simultaneous measurement of over 40 parameters without compensation needs [9] [12].
Spectral flow cytometry represents an advanced evolution of conventional flow cytometry. Rather than using filters to direct narrow wavelength bands to specific detectors, spectral cytometers capture the full emission spectrum of each fluorophore across a wide wavelength range using a prism or diffraction grating and an array of highly sensitive detectors [1]. This approach allows for more parameters to be measured simultaneously and simplifies the optical system by reducing the need for complex filter configurations [1]. The current state-of-the-art in spectral flow cytometry includes instruments like the Sony ID7000 with 7 lasers and 184 fluorescent detectors [3] and the Cytek Aurora with 5 lasers and 64 fluorescent detectors [1].
Table 1: Performance Comparison of Conventional, Spectral, and Mass Cytometry
| Characteristic | Conventional Flow Cytometry | Spectral Flow Cytometry | Mass Cytometry (CyTOF) |
|---|---|---|---|
| Maximum Parameters | ~20-30 parameters [1] | 40+ parameters [1] [12] | 100+ parameters [13] |
| Detection Method | Optical filters and PMTs [1] | Full spectrum detection with detector arrays [1] | Time-of-flight mass spectrometry [9] |
| Labeling System | Fluorochrome-conjugated antibodies [1] | Fluorochrome-conjugated antibodies [1] | Metal isotope-tagged antibodies [10] |
| Spectral Overlap | Requires compensation [1] | Reduced via spectral unmixing [1] | Minimal channel crosstalk [11] |
| Throughput | High (thousands of cells/second) [14] | High (comparable to conventional) [11] | Lower acquisition rates [11] |
| Cell Input Requirements | Standard | Lower cell input, suitable for low-yield samples [11] | 2-3 times higher cell input required [11] |
| Post-stain Stability | Limited (<24 hours) [11] | Limited (<24 hours) [11] | Exceptionally long due to stable metal tags [11] |
Table 2: Instrument Comparison of Leading Platforms
| Instrument | Manufacturer | Technology | Lasers/Detectors | Key Features |
|---|---|---|---|---|
| FACSymphony A5 | Becton Dickinson | Conventional Flow | 9 lasers, 50 detectors [3] | High-parameter conventional analysis |
| ID7000 | Sony | Spectral Flow | 7 lasers, 184 detectors [3] | Full spectrum analysis with extensive detection channels |
| Aurora CS | Cytek | Spectral Flow | 5 lasers, 67 detectors [3] | Popular research platform for high-parameter panels |
| NovoCyte Opteon | Agilent | Spectral Flow | 5 lasers, 73 detectors [3] | Balanced performance for research and clinical applications |
| CyTOF XT | Standard BioTools | Mass Cytometry | 135 channels [3] | Established platform for high-dimensional single-cell analysis |
| MSFLO | Powclin | Mass Cytometry | 259 channels [3] | High-channel count from emerging manufacturer |
For stem cell researchers, the choice between these technologies involves important trade-offs. Mass cytometry excels in high-parameter studies where comprehensive immunophenotyping or signaling analysis is required, while flow cytometry platforms offer higher throughput and the ability to sort cells for functional assays [11]. Spectral flow cytometry occupies a middle ground, providing enhanced parameter detection while maintaining the practical advantages of fluorescent detection systems [1].
Applications in Stem Cell Research
Stem Cell Characterization and Isolation
Flow cytometry has been instrumental in stem cell research since its early clinical applications, particularly for the enumeration of CD34+ hematopoietic stem and progenitor cells to evaluate bone marrow stem cell grafts [9]. The technology enables researchers to identify and isolate stem cells based on specific surface markers, which is crucial for regenerative medicine and stem cell therapy development [15]. The advent of spectral flow cytometry and mass cytometry has significantly enhanced these capabilities by allowing more detailed characterization of complex stem cell populations and rare subpopulations that may have distinct functional properties [11].
Mass cytometry has proven particularly valuable for mapping stem cell differentiation trajectories and understanding the heterogeneity within stem cell populations. For example, Tsai et al. utilized CyTOF to analyze cellular phenotypes in bone marrow and peripheral blood samples from various hematological diseases [9]. By combining morphometry with immunophenotyping coupled with machine learning, they successfully described differentiation trajectories for normal and leukemia cells and achieved automated hematopathological diagnosis for routine clinical use [9]. Similarly, Good et al. applied CyTOF to detect 35 protein markers associated with different B-cell developmental stages in bone marrow samples from patients with B precursor-acute lymphoblastic leukemia (ALL), identifying six features of the B-cell subpopulation in leukemia and establishing a model that effectively predicted disease relapse [9].
Signaling Pathway Analysis in Stem Cells
The analysis of intracellular signaling pathways is crucial for understanding stem cell fate decisions, including self-renewal, differentiation, and reprogramming. Flow cytometry enables the monitoring of key signaling pathways using antibodies against intracellular phosphorylated biomarkers (phosphoflow) [15]. This application provides drug developers with a better understanding of their compound's mechanism of action [15]. Mass cytometry extends these capabilities by allowing simultaneous assessment of multiple signaling pathways alongside extensive surface marker panels, providing a systems-level view of signaling network dynamics in stem cells at single-cell resolution [12].
Diagram 1: Stem Cell Signaling Pathway Analysis. This workflow illustrates how mass cytometry detects phosphorylation events in intracellular signaling pathways that regulate stem cell fate decisions.
Monitoring Stem Cell Therapies
In the context of chimeric antigen receptor (CAR)-T cell therapies for hematologic malignancies, flow cytometry plays a significant role in CAR-T cell monitoring and exploration of the tumor microenvironment [9]. As stem cell-based therapies advance toward clinical application, the need for robust monitoring technologies becomes increasingly important. Spectral flow cytometry offers advantages for monitoring therapeutic stem cells due to its ability to handle limited cell availability, as it requires lower cell input compared to mass cytometry [11]. This is particularly relevant when working with precious clinical samples such as tumor-infiltrating lymphocytes (TILs) or cells taken from biopsies [11].
The integration of artificial intelligence with flow cytometry data is creating new opportunities for stem cell therapy monitoring. Clichet et al. developed an innovative model integrating AI with multi-parameter flow cytometry to improve the diagnosis and classification of myelodysplastic syndromes (MDS) [9]. This model provides a reliable diagnostic tool allowing diagnosis of both high- and low-risk MDS with a sensitivity of 91.8% and a specificity of 92.5% [9]. Similarly, another study showed that evaluation of plasma cells by multi-parameter flow cytometry with the gradient boosting machine algorithm (GBM) at diagnosis and follow-up may be a promising tool to monitor plasma cell dyscrasias [9].
Experimental Design and Methodologies
Sample Preparation Protocols
Proper sample preparation is critical for successful cytometry experiments in stem cell research. Both mass and spectral flow cytometry platforms can handle various sample types, including peripheral blood mononuclear cells (PBMCs), fresh whole blood, gently fixed samples, or frozen specimens that have undergone an initial fixation step [11]. When analyzing fixed frozen samples, it is essential to fix the specimen soon after drawing the blood, ideally within two hours [11]. For PBMC or fresh whole blood samples, the performance of both technologies is comparable, with sample quality, careful clone selection, and fluorophore or heavy metal combination being the crucial elements to consider [11].
A key consideration in experimental design is cell input requirements. Mass cytometry typically requires 2-3 fold higher cell input than spectral flow cytometry, which becomes crucial when working with low-yield samples like stem cells from limited tissue sources or biopsies [11]. Approximately 15-25% of cells are lost during acquisition in mass cytometry [11]. Therefore, in scenarios with limited cell availability, spectral flow cytometry is the preferred option to maximize the number of events analyzed and generate quality data [11].
Diagram 2: Experimental Workflow for Stem Cell Analysis. This diagram outlines the core sample processing steps for cytometry analysis, highlighting technology-specific requirements for mass and spectral flow platforms.
Panel Design Considerations
Panel design is a critical aspect of experimental planning in stem cell research. Both mass and spectral flow cytometry can handle large panels of around 40 markers, but the intended use of the data should be considered when deciding on the panel size and complexity [11]. For panels measuring target expression, receptor occupancy, or providing absolute counts to support clinical decisions, creating a focused flow cytometry panel with fewer than 12 markers can provide more reliable results [11].
Mass cytometry offers advantages for large panel sizes due to minimal channel crosstalk, as it detects highly purified isotopes rather than broad fluorescent spectra [11]. However, spectral flow cytometry has significantly advanced panel design flexibility by enabling the use of fluorophores with overlapping spectra, provided that their full spectral profiles are distinguishable [1]. Although the implementation of this possibility is challenged by the limited number of commercially available fluorescently labeled antibodies and spectrally different dyes [1], almost all fluorescent dyes are suitable for spectral cytometry, including fluorescent proteins, small organic dyes, quantum dots, polymeric dyes, and tandem dyes [1].
Table 3: Research Reagent Solutions for Stem Cell Cytometry
| Reagent Type | Specific Examples | Function in Experiment | Technology Compatibility |
|---|---|---|---|
| Viability Markers | Cisplatin (for CyTOF) [10] | Distinguishes live/dead cells to exclude compromised cells from analysis | Primarily Mass Cytometry |
| Surface Marker Antibodies | CD34, CD45, CD133, CD90 | Identifies stem cell populations and subpopulations | All Platforms |
| Intracellular Antibodies | Phospho-specific antibodies (e.g., pSTAT, pERK) [15] | Detects signaling pathway activation | All Platforms (with permeabilization) |
| DNA Stains | Iridium intercalator (for CyTOF) [10] | Identifies nucleated cells and cell cycle position | Mass Cytometry |
| Metal Conjugates | Lanthanide series metals [3] | Antibody tags for mass cytometry detection | Mass Cytometry |
| Fluorochromes | Spark, Vio, eFluor dyes [1] | Antibody tags for fluorescence detection | Flow/Spectral Cytometry |
| Custom Conjugation | In-house metal tagging [11] | Enables flexible panel design for mass cytometry | Primarily Mass Cytometry |
Data Acquisition and Analysis
Data acquisition parameters must be optimized for each technology platform. Mass cytometry has slower acquisition rates compared to flow cytometry but offers exceptionally long post-stain stability due to the stable nature of metal-tagged reagents [11]. Conventional and spectral flow cytometry offer higher comparable throughput but have more limited post-staining stability, typically lasting under 24 hours [11]. For mass cytometry, samples are typically acquired at a rate of ~250 cells per second [10], while flow cytometry platforms can acquire thousands of cells per second [14].
The analysis of high-dimensional cytometry data presents significant challenges. Traditional manual gating becomes impractical with datasets containing dozens of parameters, necessitating advanced computational approaches [9]. Dimensionality reduction techniques like t-SNE and UMAP are commonly employed to visualize high-dimensional data in two dimensions [16]. Recently, artificial intelligence approaches have shown promise in flow cytometry data analysis. Wodlinger et al. proposed an automated minimal residual disease (MRD) detection method using transformers that could identify rare cell populations in high-dimensional space [12]. Another study demonstrated that evaluation of plasma cells by multi-parameter flow cytometry with the gradient boosting machine algorithm (GBM) at diagnosis and follow-up may be a promising tool to monitor plasma cell dyscrasias [9].
Future Perspectives and Emerging Technologies
The field of cytometry continues to evolve rapidly, with several emerging technologies poised to impact stem cell research. Imaging flow cytometry (IFC) represents a significant advancement by integrating high-resolution imaging technology with conventional flow cytometry [14]. This hybrid approach enables high-throughput morphological imaging, allowing researchers to correlate molecular markers with cellular morphology in dynamic processes [14]. Commercial IFC platforms like the Amnis ImageStreamX Mark II and Thermo Fisher's Attune CytPix are already enabling new applications in stem cell research, particularly for analyzing cell-cell interactions and subcellular dynamics that require spatiotemporal morphological data unattainable with conventional FC [3] [14].
Another significant trend is the integration of cytometry data with other omics technologies. Single-cell multi-omics studies that combine mass cytometry data with transcriptomic or genomic information are creating more comprehensive understanding of cellular heterogeneity [13] [12]. The relationship between transcriptomic and proteomic measurements is imprecise, and thus datasets that probe the extent of their concordance are increasingly valuable for refining biological conclusions [10]. Techniques like CITE-Seq (Cellular Indexing of Transcriptomes and Epitopes by Sequencing) allow for simultaneous analysis of transcriptomes and surface proteins by using oligonucleotide-labeled antibodies, bridging the gap between cytometry and sequencing technologies [1].
The future of cytometry in stem cell research will likely be shaped by continued improvements in instrumentation, reagents, and data analysis capabilities. For mass cytometry, emerging trends include integration of spatial information with single-cell analysis through techniques such as imaging mass cytometry [13]. For spectral flow cytometry, development of new fluorochromes with distinct spectral signatures is expanding the possibilities for panel design [1]. Across all platforms, advances in data analysis software and artificial intelligence are helping researchers extract meaningful biological insights from the increasingly complex datasets generated by these powerful technologies [9] [12].
In the fields of stem cell research, immunology, and drug development, the quest for deeper cellular insights has driven the need for technologies that can simultaneously measure dozens of parameters from single cells. Conventional flow cytometry, while powerful, faces a fundamental limitation: spectral overlap (or "spillover") between fluorochromes, which restricts panel complexity and compromises data accuracy [1] [17]. This spillover occurs because traditional cytometers detect fluorescence using narrow bandpass filters centered on emission peaks, making it difficult to distinguish between fluorophores with similar emission profiles. The process of correcting for this overlap, known as compensation, becomes increasingly complex and error-prone as more colors are added to a panel [18].
Spectral flow cytometry represents a transformative approach that addresses this core limitation. Unlike conventional systems, spectral cytometers capture the full emission spectrum of every fluorophore across a wide range of wavelengths [1] [19]. By measuring the unique spectral "fingerprint" of each fluorochrome—rather than just its peak emission—and applying sophisticated linear unmixing algorithms, the technology can precisely distinguish between even highly overlapping dyes [19] [18]. This fundamental advancement enables researchers to design larger, more complex panels while maintaining superior resolution, making it particularly valuable for stem cell characterization and the analysis of complex cellular ecosystems.
Fundamental Technology Comparison: Resolving Power Versus Detection Principle
The core difference between spectral flow cytometry and mass cytometry (CyTOF) lies in their fundamental approach to signal detection and resolution. The following diagram illustrates the key technological differentiators and experimental workflow for each platform.
Detection Principles and Spillover Management
Spectral Flow Cytometry relies on full-spectrum fingerprinting [19] [18]. When fluorochromes bound to cellular markers are excited by lasers, the emitted light is passed through prisms or diffraction gratings that scatter it across an array of highly sensitive detectors (typically 32-64 channels) [1]. This generates a complete emission spectrum for each fluorophore across its entire emission range, creating a unique spectral signature that can be distinguished from other fluorophores even with substantial overlap in their peak emissions [19]. Advanced algorithms then deconvolute these mixed signals using reference controls from single-stained samples, mathematically separating the contribution of each fluorophore to the final signal [18]. This process, known as spectral unmixing, effectively minimizes spillover complications without the need for traditional compensation [18].
Mass Cytometry (CyTOF) takes an entirely different approach by replacing fluorescence with mass detection [20] [4]. Antibodies are conjugated to stable heavy metal isotopes rather than fluorochromes [20]. Cells are introduced into an inductively coupled plasma, which vaporizes and atomizes them, converting the metal tags into ion clouds [20] [4]. A time-of-flight mass spectrometer then separates these ions based on their mass-to-charge ratios [4]. Since heavy metal isotopes have minimal natural abundance in biological systems and distinct mass peaks, there is virtually no signal overlap between channels [20] [21]. This fundamental difference in detection principle eliminates spectral spillover at its source, though it introduces other limitations related to throughput and cellular morphology.
Table 1: Technical Comparison of Spectral Flow Cytometry and Mass Cytometry
| Feature | Spectral Flow Cytometry | Mass Cytometry (CyTOF) |
|---|---|---|
| Detection Principle | Full fluorescence spectrum measurement [1] [19] | Time-of-flight mass spectrometry [20] [4] |
| Label Type | Fluorochromes (organic dyes, proteins, tandems) [1] | Heavy metal isotopes [20] [4] |
| Spillover/Overlap | Managed via spectral unmixing [19] [18] | Minimal due to distinct mass peaks [20] [21] |
| Max Parameters Demonstrated | 40+ markers [20] [19] | 50+ markers [4] |
| Theoretical Spillover | Mathematical separation of overlapping spectra [17] [18] | Physically distinct detection channels [20] |
| Throughput | 10,000-20,000 cells/second [20] [4] | ~500 cells/second [20] [4] |
| Cell Recovery | >95% [20] | 30-60% [20] |
| Morphological Parameters | FSC, SSC, and autofluorescence detection [20] [4] | No direct FSC/SSC measurement [20] [4] |
Experimental Performance Data: Resolution, Sensitivity, and Reproducibility
Direct Comparative Studies
A 2023 study published in Frontiers in Immunology directly compared the performance of spectral flow cytometry and mass cytometry for studying innate myeloid cells (IMC) using panels with 21 common markers [4]. The researchers systematically identified 24 leukocyte populations, including 21 IMC subsets, using both technologies. The results demonstrated a strong correlation (Pearson's ρ = 0.99) in the relative distribution of these cell populations between the two platforms [4]. However, spectral flow cytometry showed significantly lower intra-measurement variability (median coefficient of variation of 42.5% vs. 68.0% in mass cytometry; p<0.0001) [4].
Another comprehensive comparison study conducted in collaboration with the Stanford Human Immune Monitoring Center evaluated five patient samples using an established 32-marker immune panel [20]. The researchers reported highly comparable results between spectral flow cytometry (using the Cytek Aurora) and mass cytometry (using a Helios CyTOF) across multiple data analysis approaches [20]. Both technologies successfully identified all previously described and anticipated immune subpopulations defined by the panel, demonstrating their utility for high-dimensional immunophenotyping in translational research settings [20].
Table 2: Quantitative Performance Metrics from Comparative Studies
| Performance Metric | Spectral Flow Cytometry | Mass Cytometry | Experimental Context |
|---|---|---|---|
| Correlation of Cell Distribution | Pearson's ρ = 0.99 [4] | Pearson's ρ = 0.99 [4] | 21 shared markers, 24 leukocyte populations [4] |
| Intra-measurement Variability | Median CV: 42.5% [4] | Median CV: 68.0% [4] | 5 healthy donors, PBMC samples [4] |
| Acquisition Time | Median: 16 minutes [4] | Median: 159 minutes [4] | For comparable cell numbers [4] |
| Cell Recovery Rate | Median: 53.1% [4] | Median: 26.8% [4] | Post-acquisition analysis [4] |
| Sensitivity Limit | <40 molecules/cell [20] | 300-400 molecules/cell [20] | Detection threshold [20] |
| Data Concordance | High correlation with CyTOF (R > 0.98) [20] | High correlation with SFC (R > 0.98) [20] | 32-marker panel, 5 donors [20] |
Resolution of Low-Abundance Markers and Rare Populations
The enhanced sensitivity of spectral flow cytometry (<40 molecules per cell versus 300-400 for mass cytometry) provides superior resolution for low-abundance markers [20]. This sensitivity advantage is particularly valuable in stem cell research, where critical surface markers may be expressed at low densities. Additionally, spectral flow cytometry's ability to identify and subtract autofluorescence from the analysis further enhances resolution for dimly expressed markers [17] [18]. This capability stems from the technology's detection of the complete spectral profile of cellular autofluorescence, which can then be mathematically separated from specific antibody-associated signals during the unmixing process [18].
For rare population detection, such as minimal residual disease (MRD) in leukemia or rare stem cell subsets, spectral flow cytometry has demonstrated exceptional performance. Chen et al. (2023) validated a 24-color spectral panel for MRD detection in acute myeloid leukemia (AML) with a sensitivity below 0.02% while preserving marker correlation and improving resolution of maturation states [17] [22]. Similarly, in B-cell acute lymphoblastic leukemia (B-ALL), a 23-color spectral panel successfully identified CD19-negative leukemic clones that typically evade detection after CD19-targeted therapies [17] [22].
Application-Oriented Considerations for Experimental Design
Sample Requirements and Throughput
The choice between spectral flow cytometry and mass cytometry significantly impacts experimental design, particularly regarding sample requirements and throughput. The following diagram outlines key decision factors for platform selection based on research objectives and sample characteristics.
Cell Input Requirements: Spectral flow cytometry requires significantly lower cell input than mass cytometry, making it particularly suitable for precious or limited samples such as pediatric biopsies, bone marrow aspirates, or tumor-infiltrating lymphocytes [11]. Mass cytometry typically requires 2-3 times more cellular material than spectral flow cytometry, and approximately 15-25% of cells are lost during acquisition [11]. This becomes a critical consideration when working with low-yield samples.
Acquisition Throughput: Spectral flow cytometry offers a substantial advantage in acquisition speed, analyzing 10,000-20,000 cells per second compared to approximately 500 cells per second for mass cytometry [20] [4]. This difference becomes particularly important in clinical trials or large studies where hundreds of samples need to be processed in a timely manner. However, mass cytometry benefits from exceptional post-stain stability due to the stable nature of heavy metal reagents, allowing stained samples to be stored for extended periods before acquisition [11].
Panel Design and Reagent Considerations
Spectral Flow Cytometry provides greater flexibility in panel design due to the wide selection of commercially available fluorescently-labeled antibodies from multiple vendors [1] [11]. The development of new fluorochromes, including Spark, Vio, eFluor, and various tandem dyes, has expanded the possibilities for spectral panel design [1]. A key advantage is the ability to use fluorophores with overlapping emission spectra, provided their full spectral signatures are distinct enough for mathematical separation during unmixing [1] [18].
Mass Cytometry faces limitations in commercially available reagents, with primarily one vendor offering metal-labeled antibodies [11]. Consequently, most panels require custom conjugation, necessitating in-house expertise [11]. While this allows for theoretical panel sizes exceeding 50 parameters, the practical implementation is more challenging and time-consuming than spectral panel development.
Essential Research Reagent Solutions for Spectral Flow Cytometry
Successful implementation of spectral flow cytometry requires careful selection of reagents and materials. The following table details key components for establishing a spectral flow cytometry workflow.
Table 3: Essential Research Reagent Solutions for Spectral Flow Cytometry
| Reagent Category | Specific Examples | Function & Application |
|---|---|---|
| Fluorochromes | Spark, Spark PLUS [1] | Bright, photostable dyes with distinct spectral signatures |
| Vio series [1] | Comprehensive dye family with minimal spillover | |
| eFluor 450, eFluor 660 [1] | Cell proliferation and viability dyes | |
| Tandem Dyes | BD Horizon BUV & BY [1] | UV and violet laser-excited tandems |
| Alexa Fluor tandems [1] | Bright, stable tandems for multiple lasers | |
| Viability Dyes | Zombie dyes [19] | Fixed-cell compatible viability staining |
| Propidium Iodide [19] | Dead cell discrimination | |
| Staining Reagents | Cell Staining Buffer [20] | Optimized for high-parameter staining |
| Fc Receptor Blocking Solution [20] | Reduces nonspecific antibody binding | |
| Reference Controls | Single-Stained Compensation Beads [18] | Essential for creating spectral references |
| Unstained Cells [18] | Autofluorescence reference for unmixing | |
| Validation Tools | Process Control Cells [4] | Monitoring assay performance over time |
| Standardized Panel Templates [22] | Ensuring reproducibility across experiments |
Spectral flow cytometry represents a significant advancement in high-dimensional single-cell analysis by fundamentally addressing the challenge of spectral spillover through full-spectrum fingerprinting. While mass cytometry remains a powerful alternative with minimal signal overlap, spectral flow cytometry offers compelling advantages in sensitivity, throughput, and accessibility that make it particularly suitable for stem cell research, clinical trials, and drug development applications.
The technology's ability to resolve complex cellular heterogeneity through enhanced resolution of low-abundance markers, combined with its compatibility with cell sorting and lower sample requirements, positions it as an increasingly valuable tool in the researcher's arsenal. As fluorochrome development continues and spectral unmixing algorithms become more sophisticated, the parameter limits of spectral flow cytometry will continue to expand, further bridging the gap between conventional flow cytometry and mass cytometry.
For researchers embarking on high-dimensional cellular characterization, the choice between these platforms should be guided by specific experimental needs: spectral flow cytometry for applications requiring high throughput, sensitivity, and sample preservation, and mass cytometry for extreme parameter detection where minimal spillover is paramount. Both technologies will continue to play complementary roles in advancing our understanding of cellular biology and driving innovations in therapeutic development.
The advent of single-cell analysis has transformed biomedical research, providing unprecedented resolution to study cellular heterogeneity in complex systems such as the immune system and stem cell populations. For decades, flow cytometry served as the cornerstone technology for single-cell analysis, enabling researchers to measure multiple parameters on individual cells using fluorescently labeled antibodies. However, this technology faces fundamental limitations due to spectral overlap between fluorophores, constraining most practical applications to approximately 20 simultaneous parameters despite hardware advancements [1]. This limitation became increasingly problematic as researchers recognized the need for high-dimensional profiling to fully characterize complex cellular ecosystems.
Mass cytometry, or cytometry by time-of-flight (CyTOF), represents a paradigm shift in single-cell analysis by overcoming the spectral constraints of conventional fluorescence detection. Invented in 2009 and commercialized shortly thereafter, this technology replaces fluorophores with rare earth metal isotopes as antibody tags and uses time-of-flight mass spectrometry for detection [23]. This innovative approach enables simultaneous measurement of over 40 parameters at the single-cell level with minimal signal overlap, creating new possibilities for comprehensive cellular profiling in immunology, oncology, and stem cell research [24] [23].
This review provides a comprehensive technical comparison between mass cytometry and alternative technologies, with particular emphasis on applications in stem cell research and drug development. We examine experimental protocols, performance characteristics, and practical implementation considerations to guide researchers in selecting appropriate methodologies for their specific research objectives.
Fundamental Technological Principles
Mass cytometry operates on principles that merge flow cytometry with elemental mass spectrometry. The core technological innovation lies in its detection system, which fundamentally differs from optical approaches used in conventional flow cytometry:
- Metal-Tagged Antibodies: Antibodies are conjugated to stable isotopes of rare earth metals (primarily lanthanide series) rather than fluorophores. These metals are virtually absent from biological systems, creating an extremely low background signal [23].
- Inductively Coupled Plasma Ionization: Cells are introduced into an argon plasma at approximately 7,000K, which vaporizes, atomizes, and ionizes all cellular content. This process effectively converts each cell into a cloud of atomic ions [23].
- Time-of-Flight Mass Spectrometry: Metal isotopes derived from antibody tags are separated based on their mass-to-charge ratio and quantified by a time-of-flight mass spectrometer. This separation provides extremely high resolution with minimal spectral overlap [23].
The mass cytometry workflow maintains similarities with conventional flow cytometry in sample preparation, including cell staining with metal-labeled antibodies, but requires cell fixation as the ionization process is destructive [23].
Evolution of Cytometry Technologies
The development of mass cytometry represents the latest evolution in a series of technological advances aimed at increasing the multiplexing capability of single-cell analysis:
- Conventional Flow Cytometry: Utilizes fluorescent labels detected by photomultiplier tubes (PMTs) with optical filters to separate emission spectra. Limited by significant spectral overlap between fluorophores, requiring mathematical compensation and practically restricting applications to approximately 20 parameters [1].
- Spectral Flow Cytometry: Collects the full emission spectrum of all fluorophores across a wide wavelength range (typically 32-73 detection channels) rather than discrete wavelength bands. Uses mathematical spectral unmixing to distinguish overlapping signals, enabling analysis of 30-50 parameters [1] [12].
- Mass Cytometry (CyTOF): Eliminates optical detection entirely, using metal tags and mass spectrometry to achieve high-parameter detection without spectral overlap. Currently enables measurement of 40-50 parameters routinely, with potential for expansion [24] [23].
Table 1: Comparison of Core Cytometry Technologies
| Feature | Conventional Flow Cytometry | Spectral Flow Cytometry | Mass Cytometry (CyTOF) |
|---|---|---|---|
| Detection Principle | Fluorescence with optical filters | Full spectrum fluorescence + unmixing | Mass spectrometry of metal tags |
| Typical Max Parameters | 20-30 | 30-50 | 40-50+ |
| Spectral Overlap | High, requires compensation | Moderate, requires unmixing | Minimal, discrete mass detection |
| Throughput | High (≥10,000 cells/sec) | High (≥10,000 cells/sec) | Lower (~500 cells/sec) |
| Cell Sorting | Possible | Possible | Not possible |
| Live Cell Analysis | Yes | Yes | No (cells are fixed) |
| Sensitivity | Moderate | High | High |
| Primary Limitation | Spectral overlap | Limited fluorophore options | Throughput, cost |
Figure 1: Evolution of cytometry technologies from conventional fluorescence to mass detection
Technical Comparison: Performance and Capabilities
Quantitative Performance Metrics
Each cytometry platform offers distinct advantages and limitations that determine their suitability for specific research applications. The following table summarizes key performance characteristics based on current technological capabilities:
Table 2: Comprehensive Performance Comparison of Cytometry Platforms
| Performance Metric | Conventional Flow Cytometry | Spectral Flow Cytometry | Mass Cytometry (CyTOF) |
|---|---|---|---|
| Parameter Multiplexing | 20-30 parameters | 30-50 parameters | 40-50+ parameters |
| Detection Sensitivity | Moderate to high | High | High for high-abundance targets |
| Analysis Throughput | 10,000+ cells/second | 10,000+ cells/second | ~500 cells/second |
| Dynamic Range | 4-5 logs | 4-5 logs | 4-5 logs |
| Signal Overlap | High (requires compensation) | Moderate (requires unmixing) | Minimal (discrete masses) |
| Data Complexity | Moderate | High | Very high |
| Instrument Cost | $$ | $$$ | $$$$ |
| Operational Cost | $$ | $$ | $$$ |
| Cell Recovery | High | High | Limited (fixed cells only) |
Practical Implementation Considerations
Beyond technical specifications, practical implementation factors significantly influence technology selection for research and clinical applications:
- Sample Compatibility: Conventional and spectral flow cytometry support both live and fixed cell analysis, while mass cytometry requires fixed cells due to the destructive ionization process [23]. This makes flow cytometry preferable for applications requiring cell sorting or subsequent functional assays.
- Operational Workflow: Mass cytometry requires specialized expertise in both sample preparation and data analysis, with workflows that are less established than those for flow cytometry [13]. The need for cell fixation and the inability to sort cells represent significant limitations for certain experimental designs.
- Data Analysis Complexity: The high-dimensional data generated by both spectral flow and mass cytometry presents substantial analytical challenges. Advanced computational approaches, including automated gating algorithms and dimensionality reduction techniques, are often required [25] [12]. Tools such as UNITO have been developed to automate gating with human-level performance, transforming cell classification into an image-based segmentation problem [25].
- Clinical Translation: Conventional flow cytometry has well-established clinical applications, particularly in hematological malignancies and immunodeficiencies. Mass cytometry is primarily used in research settings, though its potential for deep immunophenotyping and biomarker discovery is increasingly recognized in clinical trial contexts [23].
Applications in Stem Cell Research
Character Stem Cell Heterogeneity
Stem cell populations exhibit remarkable heterogeneity, with subpopulations demonstrating distinct differentiation potentials, proliferative capacities, and functional characteristics. Mass cytometry enables comprehensive characterization of this heterogeneity through high-dimensional immunophenotyping:
- Pluripotency Assessment: Simultaneous measurement of multiple pluripotency markers (OCT4, SOX2, NANOG), surface receptors, and signaling molecules in individual cells provides a detailed view of pluripotent states [26].
- Lineage Tracing: Metal-tagged antibodies against lineage-specific markers enable tracking of early differentiation commitment in heterogeneous cultures, identifying transitional states that might be missed with lower-parameter technologies [26].
- Stem Cell Niches: Comprehensive immunophenotyping of both stem cells and their niche components reveals cellular interactions and signaling pathways that maintain stemness or direct differentiation [26].
The integration of mass cytometry data with artificial intelligence (AI) and systems biology (SysBio) approaches, termed SysBioAI, is particularly powerful for stem cell research. This integrated approach enables holistic analysis of multi-omics datasets to unravel complex regulatory networks governing stem cell fate decisions [26].
Monitoring Differentiation and Transformation
Quality control of stem cell populations is crucial for both basic research and clinical applications. Mass cytometry provides robust analytical capabilities for this purpose:
- Purity Assessment: High-parameter immunophenotyping can detect aberrant or contaminating cell populations in stem cell cultures with greater sensitivity than lower-parameter approaches [27].
- Potency Evaluation: Simultaneous measurement of multiple functional markers provides insights into the biological potency of stem cell preparations, potentially correlating with therapeutic efficacy [27].
- Safety Monitoring: Comprehensive screening for transformation markers or inappropriate lineage commitment in stem cell products intended for therapeutic use [27].
Figure 2: Applications of mass cytometry in stem cell research
Experimental Design and Protocols
Standard Mass Cytometry Workflow
A typical mass cytometry experiment for stem cell analysis follows a structured workflow with specific considerations at each stage:
- Sample Preparation: Cells are harvested and washed thoroughly. Viability is typically assessed using metal-based viability markers (e.g., cisplatin-based dead cell stains) that are compatible with mass spectrometry detection [23].
- Antibody Staining: A cocktail of metal-tagged antibodies is prepared, with careful titration to ensure optimal signal-to-noise ratios. Staining is performed in a similar manner to conventional flow cytometry, though with consideration of metal-specific detection limitations [23].
- Cell Barcoding: To minimize technical variability and reduce antibody consumption, samples can be barcoded using unique combinations of metal tags before pooling and staining with the primary antibody panel [23].
- Data Acquisition: Samples are introduced to the mass cytometer at a rate of approximately 500 cells/second to ensure precise single-cell detection and minimize cell doublets [23].
- Data Normalization: Continuous normalization using metal standards is performed throughout acquisition to correct for instrument sensitivity drift over time [23].
- Data Analysis: High-dimensional data is analyzed using a combination of automated gating algorithms [25], dimensionality reduction techniques (t-SNE, UMAP), and clustering approaches (PhenoGraph) to identify cell populations.
Key Research Reagent Solutions
Successful mass cytometry experiments depend on specialized reagents and materials designed specifically for this technology:
Table 3: Essential Research Reagents for Mass Cytometry
| Reagent/Material | Function | Specific Examples | Considerations |
|---|---|---|---|
| Metal-Tagged Antibodies | Target protein detection | CD45-[89Y], CD3-[141Pr], CD4-[145Nd] | Must be conjugated to stable metal isotopes; commercial availability varies |
| Cell Barcoding Reagents | Sample multiplexing | Palladium-based barcoding kits | Enables pooling of multiple samples; reduces technical variability and reagent costs |
| Viability Markers | Dead cell exclusion | Cisplatin-based viability staining | Distinguishes live/dead cells without interfering with metal detection |
| DNA Intercalators | Cell identification | Iridium/191Ir-193Ir intercalators | Permeates fixed cells; identifies nucleated cells for analysis |
| Calibration Beads | Signal normalization | EQ Four Element Calibration Beads | Enables signal standardization across acquisition periods |
| Cell Acquisition Buffer | Sample introduction | Water-based buffer with PBS | Minimizes salt buildup in instrument; maintains cell suspension |
Protocol Optimization Strategies
Based on current literature, several key optimization strategies enhance mass cytometry data quality:
- Panel Design: Carefully balance antigen abundance with metal tag sensitivity. Assign brighter metals (higher sensitivity) to low-abundance targets, and consider potential metal oxide formation that can cause signal overlap [23].
- Titration Practices: Each metal-tagged antibody requires individual titration to determine optimal concentrations that maximize signal-to-noise ratios while minimizing background [23].
- Validation Approaches: Include both positive and negative controls to confirm antibody specificity. When possible, compare with conventional flow cytometry results for validation [23].
- Sample Preservation: Fixed samples can be stored for extended periods before acquisition, though extended storage may require additional optimization of staining protocols [23].
Emerging Trends and Future Perspectives
Technological Innovations
The field of mass cytometry continues to evolve with several promising technological developments:
- Increased Multiplexing: Next-generation instruments with expanded metal detection capabilities are pushing parameter limits beyond 50 markers per cell [24].
- Spatial Resolution: Imaging Mass Cytometry (IMC) combines CyTOF with laser ablation to enable multiplexed analysis of tissue sections, providing spatial context to high-dimensional phenotyping [24] [28].
- Multi-Omic Integration: Combined analysis of proteins (via mass cytometry) and transcriptomes (via single-cell RNA sequencing) from the same cells provides complementary insights into cellular identity and function [26].
- Automated Analysis: Advanced computational methods, including deep learning approaches, are addressing the data analysis bottleneck in high-dimensional cytometry [25] [12]. The UNITO framework exemplifies this trend, using image-based segmentation to achieve human-level gating performance [25].
Impact on Drug Development and Personalized Medicine
Mass cytometry is playing an increasingly important role in pharmaceutical research and development:
- Biomarker Discovery: High-dimensional immune profiling enables identification of novel biomarkers for patient stratification and treatment response prediction [23].
- Pharmacodynamics: Comprehensive immunophenotyping can reveal drug effects on complex cellular networks, providing insights into mechanisms of action [23].
- Cell Therapy Development: For stem cell-based therapies, mass cytometry provides robust characterization of therapeutic products, potentially correlating specific cellular signatures with clinical efficacy [27].
The growing emphasis on personalized medicine is expected to further drive adoption of mass cytometry in clinical research, as the technology enables detailed characterization of individual patient immune profiles and stem cell products [29].
Mass cytometry represents a significant advancement in single-cell analysis technology, offering unparalleled multiplexing capabilities that enable deep characterization of complex cellular systems. While conventional and spectral flow cytometry remain powerful tools for many applications, CyTOF provides unique advantages for high-dimensional phenotyping in research areas such as stem cell biology, immunology, and oncology.
Technology selection should be guided by specific research requirements: conventional flow cytometry for high-throughput sorting and live cell applications; spectral flow cytometry for balanced multiplexing and flexibility; and mass cytometry for maximal parameter detection where cell sorting is not required. As the field continues to evolve with improvements in instrumentation, reagents, and computational analysis, mass cytometry is poised to make increasingly important contributions to both basic research and translational applications in stem cell science and drug development.
The fields of stem cell research and drug development are being revolutionized by advanced cytometric technologies. This guide provides an objective comparison of flow and mass cytometry platforms, detailing the key manufacturers and the experimental data that underpin their application in research.
Major Commercial Platforms and Manufacturers
The cytometry market is characterized by strong competition and technological innovation, led by a consortium of established and emerging companies.
Key Market Leaders and Their Profiles
| Manufacturer | Notable Platforms/Technologies | Key Strengths & Specializations |
|---|---|---|
| Becton, Dickinson and Company (BD) | BD FACSDiscover S8 (Spectral + Imaging), Traditional FACS systems [30] | Comprehensive portfolio for clinical diagnostics and research; leader in cell sorting and spectral technologies [31] [32]. |
| Beckman Coulter (Danaher) | CytoFLEX mosaic Spectral Flow Cytometer, DxH 900 Hematology Analyzer [33] [32] | Focus on workflow integration, high-throughput analysis, and clinical diagnostics [31] [32]. |
| Thermo Fisher Scientific | Attune CytPix (Imaging Flow Cytometry), Invitrogen Attune Xenith Flow Cytometer [32] [30] | Broad portfolio of instruments, reagents, and consumables; strong in acoustic focusing imaging cytometry [31] [32]. |
| Cytek Biosciences | Cytek Aurora, Cytek Aurora Evo [31] | Specialization in full-spectrum cytometry; known for cost-effective, high-parameter systems [31]. |
| Sysmex Corporation | XN-Series Hematology Analyzers [33] | Leader in hematology analysis; integrates AI for flagging abnormal cells [33]. |
| Standard BioTools (formerly Fluidigm) | Imaging Mass Cytometry (IMC) platforms, Helios Mass Cytometer [34] [35] | Pioneer in mass cytometry (CyTOF) and Imaging Mass Cytometry (IMC); enables highly multiplexed tissue imaging [35]. |
Market Context: The global flow cytometry market is a multi-billion dollar industry, valued at approximately $5.06 billion in 2025 and projected to grow at a CAGR of 8.7% to reach $9.85 billion by 2033 [32]. This growth is fueled by technological advancements and rising demand in oncology and immunology research [31] [32]. North America currently holds the largest market share, but the Asia-Pacific region is anticipated to grow the fastest [31] [32].
Technology Performance Comparison
Different cytometry technologies offer distinct advantages and limitations, which are critical to consider for specific research applications.
Comparative Analysis of Cytometry Platforms
| Feature | Conventional Flow Cytometry | Spectral Flow Cytometry | Mass Cytometry (CyTOF) | Imaging Flow Cytometry |
|---|---|---|---|---|
| Key Principle | Measures light scatter & fluorescence [30] | Full-spectrum capture; unmixing of signals [9] | Uses metal-tagged antibodies; detected by TOF mass spectrometry [34] [9] | Combines flow cytometry with high-resolution microscopy [30] |
| Multiplexing Capacity | Moderate (Limited by fluorescence overlap) [9] | High (40+ colors with specialized panels) [9] | Very High (40+ parameters simultaneously) [34] [9] | Moderate (Limited by fluorescence, but adds spatial data) [30] |
| Key Advantage | High analysis speed; well-established | High multiplexing without heavy metal labels; avoids autofluorescence [9] | Minimal signal overlap; deep immunophenotyping [34] [9] | Provides morphological context; visual confirmation [30] |
| Primary Limitation | Fluorescence spectral overlap limits panel size [9] | Requires specialized fluorophores & complex analysis [9] | Lower throughput; destroys cells [34] | Lower throughput than conventional flow [30] |
| Stem Cell Research Application | Viability, basic immunophenotyping, cell cycle (with DNA stains) | Deep immune profiling of differentiated cells, complex cell types | Mapping rare stem cell populations, deep signaling networks [34] | Analyzing cell morphology, apoptosis, co-localization of markers |
Supporting Experimental Data in Research
The performance of these platforms is validated through their application in cutting-edge research, providing concrete data on their capabilities.
Case Study 1: Deep Cell Cycle State Analysis via Mass Cytometry
A 2025 Nature Communications study utilized a 48-parameter mass cytometry panel to dissect canonical and noncanonical cell cycle states in primary human T-cells and cell lines [34].
Experimental Protocol:
- Cell Preparation: Jurkat cells and primary human T-cells were cultured and subjected to various cell cycle inhibitors (e.g., CDK4/6 inhibitors, DNA synthesis inhibitors) [34].
- Staining: Cells were stained with a panel of 48 metal-tagged antibodies targeting cyclins, phospho-proteins, DNA licensing factors, and incorporation of 5-iodo-2′-deoxyuridine (IdU) [34].
- Data Acquisition: Stained cells were analyzed on a CyTOF mass cytometer (Standard BioTools) [34].
- Data Analysis: High-dimensional data was analyzed using dimensionality reduction (PHATE) and graph-based connectivity to quantify the diversity of cell cycle states [34].
Key Result: The high-parameter panel captured an increased diversity of cell cycle states, including atypical states induced by pharmacological perturbation. Cells escaping CDK4/6 inhibition exhibited aberrant, noncanonical cell cycle states not observed in untreated cells [34]. This demonstrates CyTOF's unique power to reveal complex biological responses to stimuli.
Case Study 2: Predicting Clinical Outcomes with Integrated Computational Models
A 2025 study introduced cytoGPNet, a novel method combining deep learning with Gaussian processes to predict individual-level clinical outcomes from complex longitudinal cytometry data [16].
Experimental Protocol:
- Data Input: Longitudinal single-cell cytometry data from studies on COVID-19, influenza, and cancer [16].
- Model Architecture:
- An autoencoder reduces the dimensionality of single-cell data.
- A Gaussian Process (GP) model captures temporal dependencies and correlations between cells.
- Attention layers adaptively summarize cell-level information for subject-level prediction [16].
- Validation: The model was benchmarked against existing methods (e.g., CellCnn, CyTOF_DL) on multiple datasets [16].
Key Result: cytoGPNet consistently outperformed existing methods in predictive accuracy across diverse immunological studies, demonstrating the power of integrating advanced computational approaches with high-dimensional cytometry data for robust prediction [16].
The following diagram illustrates the core analytical workflow of the cytoGPNet model:
Figure 1: The cytoGPNet model processes single-cell data through an autoencoder and Gaussian process before using an attention mechanism for final prediction. [16]
The Scientist's Toolkit: Essential Reagent Solutions
The functionality of any cytometry platform is dependent on the reagents used for sample preparation and labeling.
Key Research Reagent Solutions
| Reagent / Material | Function | Application Example |
|---|---|---|
| Metal-Tagged Antibodies | Antibodies conjugated to heavy metal isotopes for target detection in mass cytometry. | A 48-plex panel of antibodies against cyclins, phospho-proteins (pHH3, pRb), and DNA licensing factors (CDT1) for deep cell cycle analysis [34]. |
| DNA Intercalators | Compounds that bind nucleic acids to measure DNA content. | Cell cycle analysis using 5-Iodo-2'-deoxyuridine (IdU) incorporation to label S-phase cells [34]. |
| Viability Markers | To distinguish and exclude dead cells from analysis. | Cisplatin-based cell viability staining in mass cytometry to ensure analysis of only intact, live cells [34]. |
| Palladium Barcoding | Allows sample multiplexing to minimize technical variation. | Staining different cell lines or patient samples with unique palladium isotope barcodes for simultaneous acquisition and processing [34]. |
| Fluorescently-Labeled Antibodies | Antibodies conjugated to fluorophores for detection in flow cytometry. | Multi-color immunophenotyping panels for identifying and isolating specific stem cell populations (e.g., CD34+ hematopoietic stem cells) [9]. |
Experimental Workflow for Cell Analysis
A typical workflow for a high-parameter cell analysis experiment using mass cytometry is outlined below, integrating the discussed reagents and platforms.
Figure 2: A generalized workflow for high-parameter single-cell analysis using mass cytometry. [34] [35]
The commercial landscape for cytometry is dynamic, with platforms offering distinct trade-offs. The choice between high-parameter, non-spatial mass cytometry, high-speed conventional flow, or morphology-providing imaging flow cytometry is dictated by the specific research question. Emerging trends, including the integration of artificial intelligence (AI) for data analysis and the development of even more complex multiplexed panels, are poised to further enhance the resolution and predictive power of these technologies in stem cell research and drug development [16] [9].
Practical Applications in Stem Cell Research: From Phenotyping to Functional Analysis
High-Dimensional Immunophenotyping of Pluripotent and Tissue-Specific Stem Cells
High-dimensional immunophenotyping has become a cornerstone of modern stem cell research, providing critical insights into cellular heterogeneity, differentiation status, and functional potential. For pluripotent and tissue-specific stem cells, comprehensive surface marker analysis enables researchers to validate stem cell populations, isolate pure populations for downstream applications, and monitor differentiation processes with unprecedented precision. Two leading technologies have emerged for high-parameter single-cell analysis: spectral flow cytometry (SFC) and mass cytometry (MC). This guide provides an objective comparison of these technologies, supported by experimental data and detailed methodologies, to assist researchers in selecting the appropriate platform for their stem cell research applications.
Technology Comparison: Spectral Flow Cytometry vs. Mass Cytometry
The choice between spectral flow cytometry and mass cytometry depends on multiple factors, including panel requirements, sample availability, and research objectives. The table below summarizes the key technical characteristics of both platforms based on current literature.
Table 1: Technical comparison between spectral flow cytometry and mass cytometry
| Parameter | Spectral Flow Cytometry | Mass Cytometry |
|---|---|---|
| Maximum Parameters | ≥40 with 5-laser systems [12] [4] | >50 markers simultaneously [36] [12] |
| Detection Method | Full emission spectrum analysis [37] [12] | Heavy metal isotope detection [36] [12] |
| Detection Sensitivity | ≈40 molecules per cell [4] | 400-500 molecules per cell [4] |
| Acquisition Speed | ~20,000 events/second [4] | ~300 events/second [4] |
| Cell Recovery Rate | Median 53.1% [4] | Median 26.8% [4] |
| Throughput Capability | 192 samples/experiment possible [38] | Lower throughput due to acquisition speed |
| Sample Requirements | Compatible with cryopreserved cells [36] | Requires metal-conjugated antibodies |
| Morphological Information | Retains light scatter properties [39] | No light scatter data [4] |
| Autofluorescence | Can be useful for specific populations [4] | Not applicable |
Performance Comparison in Stem Cell Applications
Correlation Between Platforms
Recent studies have demonstrated strong correlations between SFC and MC for immune cell monitoring. One systematic comparison of innate myeloid cells revealed a Pearson's correlation coefficient of ρ=0.99 for population distribution and ρ=0.55 for individual marker staining resolution when using panels containing 21 common markers [4]. Another study comparing a 32-marker immune monitoring panel found "highly comparable results between the two technologies using multiple data analysis approaches" [37].
Practical Considerations for Stem Cell Research
For stem cell applications, several practical factors influence technology selection:
- Panel size requirements: MC currently supports larger panels (>50 parameters), advantageous for comprehensive stem cell surfaceome mapping [12] [39]
- Sample availability: SFC's higher cell recovery rates (median 53.1% vs. 26.8%) make it preferable for rare or limited samples [4]
- Throughput needs: SFC enables higher throughput studies (192 samples/experiment) [38]
- Turnaround time: SFC provides faster analysis, beneficial for clinical applications [4]
Experimental Protocols for Stem Cell Immunophenotyping
Sample Preparation and Cryopreservation
Proper sample preparation is critical for reliable stem cell immunophenotyping. A validated protocol for cryopreservation of gastrointestinal tissue demonstrates preservation of viability and functionality for both immune and epithelial cells:
Diagram 1: Sample processing workflow
This method maintains cell viability and immune makeup, with no statistically significant differences in total cell counts or CD45+ cell counts between fresh and cryopreserved samples [36]. The protocol has been validated across multiple institutions with consistent results.
Staining and Acquisition Protocol for Pluripotent Stem Cells
The following protocol, adapted from established methodologies, details immunophenotyping of live human pluripotent stem cells:
- Cell Preparation: Culture hPSCs in defined, feeder-free conditions on hESC-qualified Matrigel or Geltrex matrix [39]
- Harvesting: Dissociate cells using Accutase cell dissociation solution to maintain surface epitopes [39]
- Staining: Resuspend cells in FACS buffer and incubate with antibody cocktails for 30 minutes at 4°C
- Reference Markers: Include CD90 and EpCam (CD326) as reference stem cell markers [39]
- Prevalent/Restricted Markers: Probe c-Kit (CD117), Integrin α6 (CD49f), Semaphorin-6A, and HPI-1 [39]
- Analysis: Acquire data using appropriate SFC or MC instrumentation
- Validation: Include appropriate isotype controls and compensation controls for SFC
This protocol enables high-throughput validation of hPSC lines without fixation, allowing for subsequent sorting and expansion of identified populations [39].
Research Reagent Solutions
The table below outlines essential reagents for high-dimensional immunophenotyping of stem cells, based on published methodologies.
Table 2: Essential research reagents for stem cell immunophenotyping
| Reagent Category | Specific Examples | Function/Application |
|---|---|---|
| Extracellular Matrix | Matrigel hESC-qualified Matrix, Geltrex LDEV-Free hESC-qualified matrix [39] | Provides substrate for feeder-free hPSC culture |
| Dissociation Reagents | StemPro Accutase Cell Dissociation Solution [39] | Gentle detachment of hPSCs while preserving surface epitopes |
| Cell Surface Markers | CD90, EpCam (CD326), c-Kit (CD117), Integrin α6 (CD49f) [39] | Reference and prevalent markers for hPSC identification |
| Viability Enhancers | Rho kinase (ROCK) inhibitor Y-27632 [39] | Improves survival of dissociated hPSCs |
| Culture Media | Essential 8 Medium (E8) [39] | Defined, xeno-free medium for hPSC maintenance |
| Cryopreservation Reagents | DMSO (10%) in FBS (90%) [36] | Maintains viability and functionality during frozen storage |
Data Analysis Considerations
High-Dimensional Data Challenges
The explosion of data dimensions from high-parameter cytometry creates analytical challenges that require specialized approaches:
- Traditional manual gating becomes impractical with >40 parameters [12]
- Automated clustering algorithms (e.g., FlowSOM, viSNE) enable population identification in an unbiased manner [36] [38]
- Batch effect correction is crucial for large studies, achievable through standardized processing and reference samples [38]
Implementation in Clinical Settings
For clinical applications, SFC offers advantages due to faster turnaround times and the inability to batch patient samples for delayed analysis [4]. However, MC provides deeper parameterization for discovery-phase research. A hybrid approach, using SFC for validation and MC for discovery, can be an effective strategy for comprehensive stem cell characterization.
Both spectral flow cytometry and mass cytometry enable high-dimensional immunophenotyping of pluripotent and tissue-specific stem cells with complementary strengths. The decision between platforms should be guided by specific research requirements: SFC offers higher throughput, better cell recovery, and faster analysis for clinical applications, while MC provides higher parameterization for comprehensive discovery research. By implementing robust protocols for sample processing, staining, and data analysis, researchers can leverage these technologies to advance stem cell research and therapeutic development.
Tracking cell fate—whether during reprogramming to pluripotency or differentiation into specialized lineages—requires precise resolution of intermediate cellular states along a complex trajectory. This process is fundamental to advancements in regenerative medicine, disease modeling, and drug development [40]. Traditional bulk analysis methods mask cellular heterogeneity, potentially obscuring critical transitional populations that determine the efficiency and outcome of fate conversion protocols. The emergence of high-dimensional single-cell technologies has revolutionized our capacity to deconstruct these trajectories, with flow cytometry and mass cytometry leading this paradigm shift.
This guide provides a comparative analysis of how these cytometry platforms enable researchers to dissect the intricate processes of cell reprogramming and differentiation. We evaluate their performance characteristics, supported by experimental data, to inform method selection for specific research applications within stem cell biology and drug development.
Technology Face-Off: Flow Cytometry vs. Mass Cytometry
The choice between flow and mass cytometry involves balancing multiplexing capability, sensitivity, and practical experimental requirements. The table below summarizes their core characteristics:
Table 1: Core Technology Comparison for Cell Fate Tracking
| Feature | Flow Cytometry | Mass Cytometry (CyTOF) |
|---|---|---|
| Detection Principle | Light scattering & fluorescence [28] | Inductively coupled plasma mass spectrometry [23] |
| Label Tags | Fluorophores [28] | Stable metal isotopes [23] |
| Multiplexing Capacity | ~20-30 parameters [28] | ~40-100 parameters simultaneously [13] [23] |
| Signal Overlap | High (spectral spillover requiring compensation) [23] | Minimal (discrete mass channels) [23] |
| Throughput | High (tens of thousands of cells/second) [28] | Lower (hundreds of cells/second) [23] |
| Sensitivity | High for abundant targets | Potentially higher for detecting low-abundance targets [23] |
| Cell Status for Analysis | Live or fixed cells [41] | Fixed cells only (cells introduced in water) [23] |
| Primary Application in Fate Tracking | Sorting live populations, functional assays (e.g., apoptosis) [28] | Deep, high-dimensional phenotyping of fixed samples [23] |
Mass cytometry's minimal signal overlap is a key advantage for high-dimensional experiments. While flow cytometry requires complex compensation to correct for fluorophore emission spectra overlap, mass cytometry uses metal tags with distinct atomic masses, resulting in highly discrete data channels and dramatically reduced need for compensation [23]. This allows for more robust detection of complex cell states during reprogramming.
Resolving Reprogramming Intermediates with High-Dimensional Cytometry
Cellular reprogramming is not a binary switch but a multi-stage process. Mapping these transitions is crucial for improving the efficiency and safety of induced pluripotent stem cell (iPSC) generation.
Experimental Protocol: Tracking Reprogramming Kinetics
The following workflow is adapted from studies on maturation phase transient reprogramming (MPTR) [42]:
- Cell Line Engineering: Generate donor somatic cells (e.g., dermal fibroblasts) with a doxycycline-inducible polycistronic cassette encoding reprogramming factors (OCT4, SOX2, KLF4, c-MYC) and a reporter (e.g., GFP).
- Induction and Time-Course Sampling: Induce reprogramming with doxycycline. Harvest cells at critical time points (e.g., days 10, 13, 15, and 17) corresponding to hypothesized intermediate states [42].
- Cell Staining for CyTOF:
- Barcoding: Pool samples from different time points and stain with a unique combination of metal-tagged anti-CD45 antibodies or other cell-surface barcoding reagents to minimize batch effects [23].
- Surface Marker Staining: Stain the pooled sample with a panel of metal-tagged antibodies against surface markers indicative of different states (e.g., CD13 for somatic fibroblasts, SSEA4 for early pluripotency).
- Fixation and Permeabilization: Fix cells and permeabilize for intracellular staining.
- Intracellular Staining: Stain with antibodies against key intracellular targets (e.g., transcription factors, phosphorylation states of signaling proteins).
- Data Acquisition and Analysis: Acquire data on a mass cytometer. Debarcode samples by time point and use dimensionality reduction algorithms (e.g., t-SNE, UMAP) and clustering to identify and characterize distinct cellular subpopulations across the reprogramming timeline.
Key Findings and Data Output
Application of the above protocol in human fibroblasts revealed distinct morphological and molecular phases. Cells underwent a mesenchymal-to-epithelial transition, formed colony structures, and expressed the early pluripotency marker SSEA4. Upon withdrawal of doxycycline, cells reacquired fibroblast morphology, demonstrating the transient nature of the process [42].
Quantitative analysis of surface marker expression, as would be captured by cytometry, is critical for isolating these intermediates. The following diagram illustrates the gating strategy and the shifting populations observed during the process:
Diagram 1: Gating Strategy for Reprogramming Intermediates
Mapping Differentiation Trajectories
Just as with reprogramming, guiding pluripotent stem cells through a differentiation pathway requires monitoring the loss of pluripotency and the sequential acquisition of lineage-specific markers.
Machine Learning for Enhanced Trajectory Analysis
Advanced computational methods are now being developed to directly predict clinical outcomes from complex single-cell cytometry data. CytoGPNet is a novel framework that integrates deep learning with Gaussian processes to model longitudinal cytometry data [16]. Its architecture is particularly suited for challenges in cell fate tracking:
- Varying Cell Numbers: Accommodates different numbers of cells per sample without information loss.
- Longitudinal Modeling: Captures temporal dependencies in samples collected over time (e.g., during a differentiation time-course).
- Interpretability: Uses attention mechanisms to identify which cells and features are most important for the model's predictions, aiding biomarker discovery [16].
The following diagram outlines the core architecture of this approach:
Diagram 2: CytoGPNet Architecture for Longitudinal Data
The Scientist's Toolkit: Essential Reagents and Materials
Successful cell fate tracking experiments rely on a suite of core reagents and tools.
Table 2: Key Research Reagent Solutions for Cell Fate Tracking
| Reagent / Material | Function | Application Examples |
|---|---|---|
| Metal-tagged Antibodies | Highly multiplexed detection of cell surface, intracellular, and phospho-proteins. | Phenotyping reprogramming intermediates (SSEA4, CD13) [42]; mapping signaling networks [23]. |
| Fluorophore-tagged Antibodies | Multiplexed detection for flow cytometry. | Apoptosis detection (Annexin V conjugates) [28]; cell surface marker analysis. |
| Cell Barcoding Reagents | Allows sample pooling, reduces technical variability and reagent costs. | Pallisade barcoding with CD45 antibodies for mass cytometry [23]; tracking multiple time points in one experiment. |
| Viability Markers | Distinguishing live cells from dead cells for data quality. | DNA intercalators (e.g., Cisplatin) in mass cytometry; viability dyes in flow cytometry. |
| Lyophilized Beads | Instrument alignment and standardization across multiple sites and time points. | Lyophilized CompBeads for normalizing MFI readouts in flow cytometry [43]. |
| Inducible Gene Expression System | Controlled induction of reprogramming factors. | Doxycycline-inducible OSKM lentivirus for iPSC generation [42]. |
Flow and mass cytometry are powerful, complementary technologies for delineating the complex trajectories of cell fate. Flow cytometry remains the workhorse for high-throughput analysis, live-cell sorting, and functional assays. In contrast, mass cytometry excels in high-dimensional, deep phenotyping of fixed samples, offering unparalleled resolution of cellular heterogeneity without the constraints of spectral overlap.
The future of cell fate tracking lies in the integration of these technologies with other single-cell omics approaches (e.g., transcriptomics) and advanced computational models like cytoGPNet [16]. Furthermore, the push for standardization using tools like lyophilized beads [43] is crucial for generating reproducible data in multi-site clinical trials. As the field progresses towards spatial multiplexing and live-cell analysis with improved mass cytometry workflows, these tools will collectively accelerate the development of robust and safe cell-based therapies.
Cell Cycle and Proliferation Analysis in Stem Cell Populations
The characterization of stem cell cycles and proliferation dynamics is a cornerstone of advanced biomedical research, with direct implications for therapeutic development, regenerative medicine, and cancer biology. Within this field, single-cell proteomic analysis technologies have become indispensable tools for dissecting the heterogeneity of stem cell populations at unprecedented resolution. Two leading platforms—flow cytometry and mass cytometry—have emerged as powerful yet distinct approaches for high-dimensional analysis of stem cell phenotypes and functional states.
This guide provides an objective comparison of these cytometry platforms, focusing on their application in stem cell cycle and proliferation studies. We evaluate their performance characteristics, experimental requirements, and data output quality based on current literature and empirical studies, providing researchers with a practical framework for technology selection tailored to specific research objectives and sample constraints.
Fundamental Principles and Instrumentation
Flow Cytometry (conventional and spectral) operates on the principle of hydrodynamic focusing to pass single cells through laser beams, with light scattering and fluorescence emission measured by photomultiplier tubes. Conventional flow cytometry typically measures up to 20 parameters simultaneously, while spectral flow cytometry captures the full emission spectrum of fluorochromes across multiple detectors, enabling resolution of 30-40 parameters through computational unmixing of overlapping signals [9] [3]. Modern spectral instruments like the Cytek Aurora CS can be configured with 5 lasers and 67 detectors, while the Sony FP7000 sorter pushes boundaries further with 6 lasers and 192 detectors [3].
Mass Cytometry by Time-of-Flight (CyTOF) represents a fusion of flow cytometry and mass spectrometry principles. Instead of fluorescent tags, antibodies are conjugated to stable heavy metal isotopes, and cells are ionized in an argon plasma before metal reporters are quantified by time-of-flight mass spectrometry [44]. This fundamental difference in detection methodology eliminates spectral overlap issues inherent in fluorescence-based systems and enables measurement of over 40 parameters simultaneously [45] [44]. Current platforms include the CyTOF XT (135 channels) and Chinese-developed instruments like MSFLO (259 channels) and Lunarion (140 channels) [3].
Performance Characteristics for Stem Cell Analysis
The following table summarizes the key technical characteristics of each platform relevant to stem cell cycle and proliferation studies:
Table 1: Platform Comparison for Stem Cell Applications
| Feature | Conventional Flow Cytometry | Spectral Flow Cytometry | Mass Cytometry (CyTOF) |
|---|---|---|---|
| Max Parameters | Typically 12-20 [11] | 30-40+ [20] [3] | 40-50+ [45] [44] |
| Detection Method | Fluorescence emission | Full spectrum fluorescence | Time-of-flight mass spectrometry |
| Throughput | High (up to 15,000 cells/s) [20] | High (comparable to conventional) [11] | Lower (~500 cells/s) [20] |
| Cell Requirements | Lower cell input [11] | Lower cell input, suitable for rare samples [11] | Higher input (2-3× more than flow) [11] |
| Sensitivity | High (<40 molecules) [20] | Enhanced for dim markers [11] | Lower (300-400 molecules) [20] |
| Autofluorescence | Yes, can interfere | Yes, but can be computationally removed [20] | Essentially none [20] |
| Post-stain Stability | Limited (<24 hours) [11] | Limited (<24 hours) [11] | Extended (weeks) [11] |
| Live Cell Sorting | Yes | Yes | No [20] |
Table 2: Application-Specific Considerations
| Analysis Type | Recommended Platform | Rationale |
|---|---|---|
| High-throughput screening | Conventional or Spectral Flow | Superior analysis speed [20] [11] |
| Complex phenotyping (40+ markers) | Mass Cytometry | Minimal channel crosstalk [11] [44] |
| Rare population analysis | Spectral Flow Cytometry | Lower cell input requirements [11] |
| Phospho-signaling studies | Mass Cytometry | Preserved sample stability for batched analysis [11] |
| Absolute counting assays | Conventional Flow | More stable MFI measurement across runs [11] |
| Stem cell transplantation | Mass Cytometry | Validated for hematopoietic stem cell products [6] |
Experimental Protocols for Stem Cell Analysis
Mass Cytometry Protocol for Hematopoietic Stem Cell Characterization
The following workflow illustrates the mass cytometry procedure for stem cell analysis:
Diagram 1: Mass Cytometry Workflow
Sample Preparation: Begin with apheresis products or bone marrow aspirates from patients with hematological malignancies. Isplicate peripheral blood mononuclear cells (PBMCs) using density gradient centrifugation [6].
Cell Staining:
- Viability Assessment: Resuspend cells in cisplatin (10 µM in PBS) to identify dead cells, then quench with cell staining medium [10].
- Surface Marker Staining: Incubate cells with metal-conjugated antibody cocktail targeting stem cell surface markers (CD45, CD34) and lineage markers for 30 minutes at room temperature [6].
- Intracellular Staining: Fix cells with 1.6% paraformaldehyde, then permeabilize with methanol for 10 minutes at 4°C. Stain with intracellular antibodies targeting cell cycle regulators (Ki-67, phospho-proteins) [10].
- DNA Labeling: Incubate with DNA intercalator (Iridium) overnight at 4°C to assess cell cycle status and DNA content [10].
Data Acquisition and Analysis: Acquire data on CyTOF instrument at approximately 500 cells/second. Normalize data using bead standards, then analyze using manual gating (Kaluza software) or unsupervised machine learning approaches (Cytobank Premium) [6].
Spectral Flow Cytometry Protocol for MSC Analysis
The following workflow illustrates the spectral flow cytometry procedure for mesenchymal stem cell analysis:
Diagram 2: Spectral Flow Workflow
Sample Preparation: Process bone marrow aspirates from patients with myelodysplastic syndromes. Culture MSC-like cells using standard media and passage until sufficient cells are obtained for analysis [46].
Multicolor Panel Design:
- Panel Configuration: Design a 30+ color panel incorporating MSC markers (CD105, CD90, CD73), exclusion markers (CD45, CD34), and cell cycle indicators (Ki-67) [46] [20].
- Fluorophore Selection: Prioritize bright fluorophores for low-abundance markers (e.g., cell cycle regulators) and dim fluorophores for highly expressed markers. Include a live-dead discriminator [20].
- Validation: Perform single-stain controls and fluorescence minus one (FMO) controls for proper spectral unmixing [20].
Staining and Acquisition:
- Cell Staining: Harvest MSC cultures, wash with PBS, and stain with surface antibody cocktail for 30 minutes at 4°C. Fix and permeabilize for intracellular staining if needed [46].
- Data Acquisition: Acquire data on full spectrum flow cytometer (e.g., Cytek Aurora) using optimized laser voltages and detection settings. Collect at least 50,000 events per sample [20].
- Data Processing: Apply spectral unmixing algorithms to resolve individual fluorophore signals. Extract and subtract autofluorescence signals to enhance resolution of dim populations [20].
Comparative Experimental Data
Concordance Between Platforms
Multiple studies have directly compared mass cytometry and spectral flow cytometry using identical antibody panels on split samples. A 2022 study comparing a 32-marker immune monitoring panel on both platforms demonstrated "highly comparable results" between the two technologies across five donor samples [20]. Similarly, a 2024 assessment using a 33-color antibody panel revealed "an overall high concordance in the quantification of major immune cell populations between the two platforms," with minor disagreements observed primarily in rare cell subpopulations [45].
Application in Stem Cell Research
In hematopoietic stem cell (HSC) analysis, mass cytometry has demonstrated particular utility for characterizing apheresis products from patients with hematological malignancies. A study of 31 apheresis products from patients with multiple myeloma and non-Hodgkin lymphomas found "excellent agreement" between mass cytometry and flow cytometry for relative and absolute counts of CD45dim/CD34+ stem cells [6]. The high-dimensional capability of mass cytometry enabled identification of seven distinct subpopulations within the CD34+ compartment, including a potentially disease-relevant CD34+/CD38+/CD138+ population in multiple myeloma patients [6].
For mesenchymal stem cell (MSC) analysis, flow cytometry has proven valuable as a predictive biomarker. A study of 49 MDS patients identified a non-hematopoietic CD13-bright cell population enriched for MSC markers CD105 and CD90. Elevated levels of these MSC-like cells, quantified by flow cytometry at diagnosis, were "significantly associated with earlier progression to leukemia and reduced overall survival," establishing MSC content as an independent predictor of leukemic transformation [46].
The Scientist's Toolkit: Essential Research Reagents
Table 3: Key Reagent Solutions for Stem Cell Cytometry
| Reagent Category | Specific Examples | Function in Analysis |
|---|---|---|
| Viability Indicators | Cisplatin (Mass Cytometry) [10], Fixable Viability Dyes (Flow) | Distinguish live/dead cells for data quality |
| Surface Markers | CD34, CD45, CD90, CD105, CD73 [46] [6] | Define stem cell identity and purity |
| Cell Cycle Indicators | Ki-67, DNA intercalators (Iridium) [10], Phospho-histone H3 | Quantify proliferation status and cell cycle phase |
| Lineage Markers | CD3, CD19, CD14, CD56 [10] | Exclude differentiated lineages from analysis |
| Intracellular Targets | Phospho-proteins, Cyclins, Transcription factors | Assess signaling activity and regulatory state |
| DNA Labels | Iododeoxyuridine (IdU) [44], Iridium intercalator [10] | Track DNA synthesis and content |
| Conjugation Kits | MaxPar X8 (Mass Cytometry) [6], Antibody labeling kits (Flow) | Custom reagent generation for panel flexibility |
Both flow cytometry and mass cytometry offer powerful capabilities for stem cell cycle and proliferation analysis, with the optimal choice being context-dependent. Mass cytometry excels in maximum parameterization, minimal signal interference, and extended sample stability, making it ideal for deep phenotypic characterization of complex stem cell hierarchies. Spectral flow cytometry provides superior sensitivity, higher throughput, and lower cell input requirements, advantageous for rare population analysis and studies with limited sample availability.
The integration of artificial intelligence with both platforms is rapidly enhancing their analytical power, with machine learning algorithms now enabling automated population identification and improved diagnostic classification [9]. As both technologies continue to evolve, they will undoubtedly provide increasingly sophisticated insights into stem cell biology, ultimately accelerating the development of novel stem cell-based therapies.
Identifying and Isolating Rare Stem Cell Subpopulations via Cell Sorting
The identification and isolation of rare stem cell subpopulations represent a critical challenge and opportunity in modern regenerative medicine and translational research. These rare populations, such as hematopoietic stem cells (HSCs) with specific marker combinations, often possess unique functional properties essential for tissue regeneration, therapeutic applications, and understanding developmental biology. Within this field, single-cell proteomic technologies have emerged as indispensable tools for characterizing cellular heterogeneity with unprecedented resolution. Two technological platforms now dominate the high-dimensional analysis landscape: full-spectrum flow cytometry and mass cytometry (CyTOF). While traditional fluorescence-based flow cytometry has been widely used for decades, its utility in detecting rare subpopulations is limited by spectral overlap between fluorochromes, which causes signal interference and necessitates complex compensation calculations [3].
The emergence of advanced cytometric platforms has fundamentally transformed our approach to rare cell detection. Spectral flow cytometry eliminates the influence of fluorescence spillover through spectral unmixing algorithms, allowing for the expansion of immune-phenotyping panel complexity to 40 fluorescence parameters and beyond [9]. Meanwhile, mass cytometry replaces fluorescent tags with rare earth metal isotopes and detects cells using time-of-flight mass spectrometry, virtually eliminating spectral overlap and enabling the measurement of over 40 cellular parameters simultaneously without the need for compensation [23]. Both technologies have demonstrated particular utility in stem cell research, where they enable deep phenotyping of complex populations and identification of rare subsets that would be indistinguishable with conventional methods [47]. This guide provides an objective comparison of these technologies, supported by experimental data and methodological protocols, to assist researchers in selecting the appropriate platform for their specific stem cell research applications.
Technology Comparison: Fundamental Principles and Capabilities
Instrumentation and Detection Mechanisms
The operational principles underlying spectral flow cytometry and mass cytometry differ significantly, with each technology employing distinct detection mechanisms that directly influence their application capabilities and limitations.
Spectral Flow Cytometry utilizes conventional laser systems for cell excitation but incorporates advanced array detectors to capture the full emission spectrum of each fluorophore across a continuous wavelength range rather than relying on traditional bandpass filters [3]. Sophisticated algorithm-based spectral unmixing then deconvolutes these complex signals to quantify the contribution of each individual fluorophore [9]. Modern spectral flow cytometers, such as the Sony FP7000 (6 lasers, 192 detectors), BD FACSDiscover S8 (5 lasers, 86 detectors including 6 imaging detectors), and Agilent NovoCyte Opteon (5 lasers, 73 detectors), represent the cutting edge of this technology, offering increasingly high-parameter capabilities [3]. Chinese manufacturers like Powclin have also entered the market with the SFLO model (5 lasers, 64 detectors), indicating the technology's growing accessibility [3].
Mass Cytometry (CyTOF) fundamentally reimagines cell detection by replacing fluorescence with elemental mass spectrometry. Cells are labeled with antibodies conjugated to stable isotopes of rare earth metals rather than fluorochromes [23]. The labeled cell suspension is then introduced into an inductively coupled plasma (ICP) torch, which vaporizes and atomizes the cells, followed by ionization of the metal tags [23]. The resulting ion clouds are analyzed by time-of-flight mass spectrometry, which quantitatively detects the metal isotopes at the single-cell level [23]. This approach essentially eliminates spectral overlap due to the distinct mass-to-charge ratios of the metal tags, allowing for highly multiplexed measurements without compensation [3]. Current commercial platforms include the CyTOF XT (Standard BioTools) with 135 channels, while Chinese manufacturers like Polaris, Powclin, and PLT Tech have developed competitive models (Lunarion, MSFLO, and PLT-MC601 with 140, 259, and 130 channels respectively) [3].
Comparative Performance Characteristics
The table below summarizes the key technical characteristics and performance metrics of both platforms, highlighting their respective advantages and limitations for rare stem cell subpopulation analysis.
Table 1: Comparative Analysis of Spectral Flow Cytometry and Mass Cytometry Technologies
| Parameter | Spectral Flow Cytometry | Mass Cytometry (CyTOF) |
|---|---|---|
| Detection Principle | Optical detection with full spectrum measurement [9] | Mass spectrometry with metal-tagged antibodies [23] |
| Multiplexing Capacity | High (up to 40+ parameters with current systems) [9] | Very High (40-50 parameters routinely) [23] |
| Spectral Overlap/Compensation | Spectral unmixing required but automated [3] | Minimal signal interference; no compensation needed [3] |
| Throughput | High (tens of thousands of cells/second) [3] | Moderate (hundreds of cells/second) [3] |
| Cell Recovery | Compatible with cell sorting | Analysis only; no sorting capability |
| Viability | Can be performed on live cells | Requires fixed cells due to ICP process [23] |
| Sensitivity | High for abundant markers | Potentially higher for low-abundance targets [23] |
| Cost Considerations | Lower operational costs | Higher infrastructure and operational costs [23] |
| Stem Cell Applications | Viable stem cell sorting possible | Analysis only; requires separate sorting technology |
Workflow Visualization
The following diagram illustrates the core technological processes and fundamental differences between spectral flow cytometry and mass cytometry workflows:
Experimental Data and Validation Studies
Hematopoietic Stem Cell Characterization in Apheresis Products
A compelling application of these technologies in stem cell research is the detailed characterization of hematopoietic stem cells (HSCs) in clinical samples. A 2024 study by Villegas-Valverde et al. directly compared mass cytometry and conventional flow cytometry for immunophenotyping apheresis products from patients with hematological malignancies undergoing autologous hematopoietic stem cell transplantation [47]. The research aimed to characterize and enumerate CD45dim/CD34+ stem cells and their subpopulations, which are critical for transplant success [47].
The experimental protocol involved analyzing 31 apheresis samples from 15 patients diagnosed with multiple myeloma (n=9) and non-Hodgkin lymphomas (n=6) [47]. Researchers employed a double-platform approach with both conventional flow cytometry (Beckman Coulter Navios EX) and mass cytometry (MaxPar Kit for stem cell immunophenotyping) [47]. The staining panel for mass cytometry included antibodies against CD10, CD13, CD34, CD49f, CD117, and CD138, among others, conjugated to different metal isotopes [47]. Data analysis was performed both manually (Kaluza software) and through unsupervised machine learning approaches (Cytobank Premium) to minimize bias [47].
The results demonstrated excellent agreement between mass cytometry and flow cytometry for both relative and absolute counts of CD45dim/CD34+ cells, with Bland-Altman analysis showing minimal bias (-0.029 for relative counts and -64 for absolute counts) [47]. Mass cytometry successfully identified seven distinct subpopulations within the HSC compartment and revealed a CD34+/CD38+/CD138+ population in four patients with multiple myeloma that might have been overlooked with conventional flow cytometry [47]. The study concluded that mass cytometry provides superior characterization of HSC subpopulations in apheresis products, potentially enabling detection of lineage biases that could affect transplant outcomes [47].
Direct Technology Performance Comparison
A comprehensive 2024 study directly compared mass cytometry and full spectral flow cytometry performance using an identical 33-color antibody panel on peripheral blood mononuclear cells (PBMCs) from four healthy individuals [45]. This rigorous experimental design allowed for direct assessment of both technologies' capabilities in detecting immune cell populations, with implications for stem cell research.
Table 2: Experimental Findings from Direct Technology Comparison [45]
| Comparison Metric | Spectral Flow Cytometry | Mass Cytometry | Concordance Level |
|---|---|---|---|
| Major Population Quantification | Accurate identification of main immune subsets | Accurate identification of main immune subsets | High correlation between platforms |
| Rare Population Detection | Effective for most rare subsets | Effective for most rare subsets | Minor disagreements in rare subsets |
| Cluster Assignment | Consistent with manual gating | Consistent with manual gating | Strong correlation between methods |
| Data Quality | High-dimensional data with some compensation | High-dimensional data without compensation | Highly overlapping biological results |
| Technical Considerations | Higher throughput, live cell capable | Lower throughput, fixed cells only | Platform choice depends on study design |
The research demonstrated that both single-cell proteomic technologies generate highly overlapping results with strong concordance in quantifying major immune cell populations using semi-automated clustering approaches [45]. Both platforms showed comparable performance in detecting most cell populations, with only minor disagreements in the quantification and assignment of rare cell subpopulations [45]. The authors emphasized that technology choice should be considered within the broader design framework of clinical studies rather than being considered a primary factor for successful biological assessment [45].
Research Reagent Solutions and Experimental Protocols
Essential Research Reagents
Successful implementation of high-dimensional cytometry for rare stem cell detection requires carefully selected reagents and optimized protocols. The following table outlines key research reagent solutions commonly employed in both spectral flow cytometry and mass cytometry workflows.
Table 3: Essential Research Reagents for High-Dimensional Stem Cell Analysis
| Reagent Category | Specific Examples | Function and Application |
|---|---|---|
| Metal-tagged Antibodies | CD34–166Er, CD45–89Y, CD38–115In [47] | Target protein detection in mass cytometry; minimal overlap |
| Viability Markers | Cisplatin-194Pt [47] | Dead cell discrimination in fixed samples |
| Cell Identification Markers | CD45, CD34, CD38, CD90, CD49f [47] | Hematopoietic stem cell population identification |
| Intracellular Staining Reagents | Methanol-based permeabilization buffers [34] | Access to intracellular and nuclear targets |
| Barcoding Reagents | Palladium isotopes (102Pd, 104Pd, etc.) [34] | Sample multiplexing to reduce technical variability |
| Data Normalization Standards | EQ Four Element Calibration Beads [23] | Instrument performance standardization |
Detailed Methodological Protocol for Stem Cell Analysis
Based on published methodologies for hematopoietic stem cell characterization, the following protocol provides a robust framework for rare stem cell subpopulation analysis using mass cytometry [47]:
Sample Preparation and Staining:
- Cell Processing: Isolate mononuclear cells from apheresis products or tissue sources using density gradient centrifugation (e.g., Ficoll-Paque). Cryopreserve cells if not processing immediately.
- Cell Thawing and Resting: Rapidly thaw cryopreserved cells and wash with complete RPMI medium. Rest cells for 24 hours at 37°C in RPMI with 10% fetal bovine serum to recover surface epitopes.
- Viability Staining: Resuspend 2×10^6 cells/mL in Maxpar PBS containing 1×10^-6 M 194Pt cisplatin. Gently vortex and incubate for 5 minutes at room temperature. Quench reaction with cell staining buffer.
- Surface Marker Staining: Incubate cells with metal-tagged antibody cocktail against surface markers (CD34, CD45, CD38, CD90, CD49f, etc.) for 30 minutes at room temperature.
- Fixation and Permeabilization: Fix cells with 1.6% formaldehyde for 10 minutes. For intracellular targets, permeabilize with ice-cold methanol for 10 minutes at 4°C.
- Intracellular Staining: If required, incubate with metal-tagged antibodies against intracellular targets (transcription factors, cell cycle regulators) for 30 minutes at room temperature.
- DNA Staining: Resuspend cells in iridium intercalator (1:2000 dilution in Maxpar Fix and Perm Buffer) and incubate overnight at 4°C.
Data Acquisition and Analysis:
- Instrument Calibration: Normalize instrument using EQ Four Element Calibration Beads according to manufacturer's instructions.
- Data Acquisition: Acquire data at appropriate cell concentration (≤1×10^6 cells/mL) with event rate maintained at 200-400 cells/second to minimize coincidence.
- Data Preprocessing: Remove normalization beads, debris, and doublets using DNA intercalator and event length parameters.
- Cell Population Identification: Use both manual gating strategies (following ISHAGE guidelines for HSCs) and automated clustering algorithms (FlowSOM, PhenoGraph) for population identification.
- Validation: Compare results with conventional flow cytometry where possible to ensure consistency across platforms.
Technology Selection Framework and Future Directions
Decision Framework for Technology Selection
Choosing between spectral flow cytometry and mass cytometry requires careful consideration of specific research requirements and experimental constraints. The following diagram outlines key decision factors in the technology selection process:
Emerging Trends and Future Applications
The field of high-dimensional cytometry continues to evolve rapidly, with several emerging trends particularly relevant to stem cell research. Spectral flow cytometry is experiencing continuous expansion in parameter capabilities, with newer instruments supporting 50+ detection channels [3]. This advancement is complemented by the development of novel fluorochromes with improved brightness and spectral properties, further enhancing resolution for rare population detection [9]. Concurrently, mass cytometry is witnessing the expansion of metal-tagged antibody panels targeting increasingly specific stem cell markers, including intracellular transcription factors and signaling molecules [34].
The integration of artificial intelligence and machine learning algorithms for data analysis represents perhaps the most transformative trend across both technologies [9]. These computational approaches enable automated identification of rare stem cell subpopulations without prior knowledge of their defining characteristics, potentially discovering novel cell states with biological and clinical significance [9]. As these technologies mature, we anticipate increased accessibility through commercial competition, particularly with Chinese manufacturers entering the market with competitive offerings [3]. This democratization of high-dimensional cytometry will likely accelerate discoveries in stem cell biology and enhance our understanding of rare stem cell populations in development, homeostasis, and disease.
The journey of reprogramming human somatic cells into induced pluripotent stem cells (hiPSCs) represents one of the most transformative advancements in regenerative medicine and disease modeling. However, this process remains remarkably complex and inefficient, characterized by heterogeneous cellular populations and asynchronous molecular events [5]. Traditional bulk analysis methods obscure the critical transitional states that occur during reprogramming, necessitating technologies capable of capturing cellular heterogeneity at single-cell resolution.
Mass cytometry, or Cytometry by Time-of-Flight (CyTOF), has emerged as a powerful solution to this challenge, combining the single-cell analysis principles of flow cytometry with the multiplexing capability of mass spectrometry [48] [23]. This technology enables simultaneous measurement of over 40 parameters at the single-cell level using antibodies conjugated to stable metal isotopes, dramatically surpassing the limitations of conventional fluorescence-based flow cytometry [2] [49]. For hiPSC reprogramming studies, this high-dimensional capacity provides unprecedented insights into the dynamic molecular changes underlying cellular transformation from fibroblasts to pluripotent stem cells.
This case study examines how mass cytometry has deconstructed the human iPSC reprogramming process, revealing novel intermediate cell populations, distinctive marker expression patterns, and cell cycle dynamics previously inaccessible to researchers. We compare mass cytometry directly with flow cytometry, provide detailed experimental protocols, and visualize key findings that have advanced our understanding of cellular reprogramming.
Technology Comparison: Mass Cytometry Versus Flow Cytometry
Technical Specifications and Performance Metrics
Table 1: Direct comparison of mass cytometry and flow cytometry technologies
| Feature | Mass Cytometry (CyTOF) | Flow Cytometry |
|---|---|---|
| Detection Method | Time-of-flight mass spectrometry | Light scattering and fluorescence |
| Label System | Heavy metal-tagged antibodies | Fluorophore-conjugated antibodies |
| Multiplex Capacity | 40+ parameters simultaneously [2] | Limited to ~18 parameters with significant compensation |
| Spectral Overlap | Minimal overlap between metal isotopes [48] [49] | Extensive spectral overlap requires compensation |
| Autofluorescence | Not affected by cellular autofluorescence [2] | Significant issue with certain cell types |
| Throughput | ~1,000 cells/second [49] | ~40,000 cells/second [49] |
| Detection Limit | ~300 molecules/cell [49] | 100-300 molecules/cell [49] |
| Live Cell Analysis | Not possible (cells are vaporized) [49] | Possible |
| Data Complexity | High-dimensional, requires specialized computational analysis [5] [16] | Moderate, with established analysis workflows |
Application Performance in Stem Cell Research
Table 2: Performance comparison specific to iPSC reprogramming studies
| Application Aspect | Mass Cytometry | Flow Cytometry |
|---|---|---|
| Capturing Intermediate Reprogramming States | Excellent: Identified distinct intermediate clusters [5] | Limited: Often misses rare transitional populations |
| Cell Cycle Analysis | Comprehensive: Resolves canonical and non-canonical states [34] | Basic: Standard cell cycle phase discrimination |
| Pluripotency Marker Coordination | High: Revealed TRA-1-60 and OCT4 distinctive patterns [5] | Moderate: Limited simultaneous marker analysis |
| Signaling Network Mapping | Extensive: Simultaneous phospho-protein assessment [2] | Constrained: Limited by antibody combinations |
| Rare Population Detection | Superior: Computational clustering identifies small populations [5] | Moderate: Requires pre-enrichment strategies |
The fundamental advantage of mass cytometry lies in its minimal spectral overlap compared to fluorescence-based flow cytometry. Where flow cytometry struggles with compensating for overlapping emission spectra—particularly as parameter numbers increase—mass cytometry utilizes distinct atomic mass channels that experience negligible interference [48] [23]. This technical difference becomes particularly consequential in iPSC reprogramming studies, where researchers must simultaneously monitor pluripotency factors, cell cycle regulators, lineage markers, and signaling molecules across heterogeneous cell populations [5].
Case Study: Mass Cytometry Analysis of hiPSC Reprogramming
Experimental Design and Workflow
A groundbreaking 2019 study employed mass cytometry to deconstruct the human iPSC reprogramming process from fibroblasts using episomal vectors [5]. The experimental design incorporated sampling at critical time points (days 10 and 20) alongside human fibroblasts (negative control) and established hiPSCs (positive control).
Mass Cytometry Panel Design and Sample Processing
The research team designed a targeted mass cytometry panel measuring 10 key markers encompassing pluripotency factors, a fibroblast marker, and cell cycle regulators:
Table 3: Key research reagents and their functions in the reprogramming study
| Target Category | Specific Markers | Biological Function |
|---|---|---|
| Pluripotency Factors | OCT4, SOX2, NANOG, TRA-1-60 | Core pluripotency network transcription factors |
| Reprogramming Factor | c-MYC | One of the original Yamanaka factors |
| Fibroblast Marker | CD44 | Cell surface protein marking fibroblast identity |
| Cell Cycle Regulators | pRB, Cyclin B1, Ki67, pHistone H3 | Critical regulators of cell cycle progression |
Sample processing followed a standardized mass cytometry workflow [5] [2]:
- Cell Fixation and Staining: Cells were fixed and stained with metal-tagged antibodies targeting the panel of interest
- Data Acquisition: Samples were analyzed using a Helios mass cytometer
- Data Preprocessing: Arc-hyperbolic sine transformation and sequential gating isolated viable singlet cells
- Computational Analysis: Multiple algorithms extracted biological insights from high-dimensional data
The analysis captured a total of 1,153,971 single cells across all experimental conditions (299,520 fibroblasts, 462,978 day 10 reprogramming cells, 147,030 day 20 reprogramming cells, and 244,442 hiPSCs), providing exceptional statistical power for detecting rare transitional populations [5].
Key Findings: Cellular Population Dynamics
Spanning-tree progression analysis of density-normalized events (SPADE) revealed profound population shifts during reprogramming. The analysis identified three principal cellular clusters:
- Fibroblast-like population: Dominant in starting fibroblasts (82%), characterized by high CD44 expression
- iPSC-like population: Enriched in hiPSCs (99%), exhibiting high pluripotency marker expression
- Intermediate-like population: Neither fibroblast nor iPSC identity, increased to 50-60% during reprogramming
The emergence of this substantial intermediate population highlights the asynchronous nature of reprogramming and represents transitional states that were previously poorly characterized [5].
PhenoGraph analysis further refined this understanding, partitioning cells into 44 distinct subclusters that were subsequently grouped into five metaclusters based on phenotypic similarity [5]. This granular analysis revealed the continuous evolution of cellular states during reprogramming, with distinct marker expression patterns distinguishing each metacluster.
Pluripotency and Cell Cycle Dynamics
Correlation analysis of pluripotency markers revealed unexpected behavior, with TRA-1-60 demonstrating a pattern distinct from other pluripotency markers like OCT4, SOX2, and NANOG [5]. This finding suggests potential differences in the regulation and function of these markers during reprogramming.
Cell cycle analysis uncovered distinctive OCT4 expression patterns in the pHistone-H3-high population (M phase), revealing cell cycle-phase-specific regulation of this core pluripotency factor [5]. This observation aligns with the known unique cell cycle structure of pluripotent stem cells, characterized by a shortened G1 phase and elongated S phase compared to somatic cells [5] [34].
Advanced mass cytometry approaches have since expanded cell cycle analysis beyond canonical phases, capturing noncanonical cell cycle states using expanded panels of 48 cell cycle-related molecules [34]. These technological advances enable researchers to characterize the diversity of cell cycle states across different cell systems and in response to perturbations.
Advanced Applications and Computational Integration
Computational Tools for High-Dimensional Data Analysis
The complex data generated by mass cytometry necessitates sophisticated computational approaches. The hiPSC reprogramming study employed multiple algorithms to extract biological insights:
- SPADE (Spanning-tree Progression Analysis of Density-Normalized Events): Visualized cell populations in tree-like structures and detected small populations through downsampling [5]
- PhenoGraph: Partitioned cells into phenotypic subpopulations and enabled metaclustering across samples [5]
- Diffusion Mapping: Tracked differentiating cells and transitional states during reprogramming [5]
Recent innovations continue to enhance computational capabilities for mass cytometry data. The cytoGPNet framework integrates deep learning with Gaussian processes to predict clinical outcomes from cytometry data, addressing challenges like varying cell counts per sample and longitudinal data relationships [16]. Such approaches are particularly valuable for connecting single-cell measurements with functional outcomes in stem cell research.
Integration with Artificial Intelligence and Systems Biology
The integration of mass cytometry with artificial intelligence (AI) and systems biology (SysBio) represents the cutting edge of stem cell research [26]. SysBioAI approaches enable holistic analysis of multi-omics datasets, patient biomarkers, and clinical outcomes, creating an iterative framework for refining therapeutic products and trial strategies [26].
For hiPSC reprogramming, this integration facilitates:
- Comprehensive Network Analysis: Mapping regulatory networks controlling pluripotency and differentiation
- Predictive Modeling: Forecasting reprogramming outcomes based on early molecular signatures
- Biomarker Discovery: Identifying critical markers predictive of successful reprogramming
- Patient-Specific Optimization: Tailoring reprogramming protocols based on donor characteristics
These advanced applications demonstrate how mass cytometry has evolved from a descriptive tool to a predictive platform capable of guiding stem cell engineering and therapeutic development.
Mass cytometry has fundamentally transformed our understanding of human iPSC reprogramming by providing high-dimensional, single-cell resolution of this complex biological process. The technology's ability to simultaneously monitor dozens of parameters without significant spectral overlap has revealed the heterogeneous nature of reprogramming, identified critical intermediate cell populations, and uncovered dynamic relationships between pluripotency markers and cell cycle regulators.
Compared to traditional flow cytometry, mass cytometry offers superior multiplexing capacity that is essential for deconstructing complex cellular transitions like reprogramming. While flow cytometry remains valuable for live-cell analysis and higher throughput applications, mass cytometry provides unparalleled depth for characterizing cellular heterogeneity and molecular networks.
The continuing evolution of mass cytometry panels, computational analysis tools, and integration with AI-driven approaches promises to further accelerate stem cell research and therapeutic development. As the technology becomes more accessible and analytical methods more sophisticated, mass cytometry will undoubtedly play an increasingly central role in bringing stem cell therapies to clinical reality.
Optimizing Your Workflow: A Guide to Panel Design, Sample Prep, and Data Analysis
In stem cell research and drug development, the strategic design of antibody panels is a critical determinant of experimental success. The central challenge lies in optimally balancing three competing factors: the number of markers required for deep biological insight, the specificity of the antibodies used, and the brightness of the fluorescent or metal tags employed for detection. This balancing act becomes increasingly complex with technological advancements, as researchers now choose between conventional flow cytometry, spectral flow cytometry, and mass cytometry (CyTOF), each offering distinct advantages and limitations for specific applications. The fundamental goal remains unchanged: to maximize information content while maintaining data quality, reproducibility, and biological relevance. This guide provides an objective comparison of these platforms through the lens of strategic panel design, supported by experimental data and practical implementation frameworks for researchers navigating this complex landscape.
Technology Platforms: Capabilities and Limitations
Technical Specifications Comparison
The choice between flow cytometry and mass cytometry represents a fundamental decision in experimental design, with significant implications for panel complexity, data quality, and analytical workflow. Table 1 provides a comprehensive comparison of their core technical characteristics.
Table 1: Key Technical Specifications of Cytometry Platforms
| Parameter | Conventional Flow Cytometry | Spectral Flow Cytometry | Mass Cytometry (CyTOF) |
|---|---|---|---|
| Maximum Parameters | Typically 10-20 [1] | 40-50+ markers [1] [12] | 40-60 markers simultaneously [9] [50] [51] |
| Detection Method | Optical filters & photomultiplier tubes [1] | Full spectrum detection with detector arrays [1] | Time-of-flight mass spectrometry [9] [50] |
| Label Type | Fluorochromes [1] | Fluorochromes [1] | Heavy metal isotopes [9] [12] |
| Spectral Overlap | Requires compensation [1] | Computational unmixing [1] | Minimal signal overlap [50] |
| Throughput | Very high (10,000+ cells/sec) [1] | High [1] | Lower than flow cytometry [12] |
| Cell Sorting | Possible [15] | Possible | Not possible [1] |
| Key Limitation | Limited by fluorescent spillover [1] | Limited commercially available dyes [1] | Lower throughput, no sorting [1] |
Performance Benchmarking in Stem Cell Applications
Independent comparative studies have quantitatively assessed various computational methods for analyzing high-dimensional cytometry data, providing crucial performance metrics for platform selection. In a comprehensive comparison of clustering methods for high-dimensional single-cell data, FlowSOM demonstrated extremely fast runtimes while maintaining high accuracy, making it particularly suitable for interactive, exploratory analysis of large datasets on standard computers [52]. Another extensive benchmark evaluating dimension reduction methods for CyTOF data found that SAUCIE, SQuaD-MDS, and scvis were among the best performers, with SAUCIE and scvis providing well-balanced performance, and SQuaD-MDS excelling at structure preservation [50].
Table 2: Performance Metrics of Computational Tools for Cytometry Data Analysis
| Method | Best For | Performance Characteristics | Stem Cell Application Suitability |
|---|---|---|---|
| FlowSOM | High-speed exploratory analysis | Extremely fast runtime, good accuracy [52] | Excellent for large stem cell datasets requiring rapid iteration |
| PhenoGraph | Identifying refined subpopulations | High precision in detecting rare populations [53] | Ideal for dissecting heterogeneous stem cell populations |
| X-shift | Density-based clustering | Effective for high-dimensional data [53] | Suitable for identifying continuum differentiation states |
| SAUCIE | CyTOF data dimension reduction | Balanced performance, good accuracy [50] | Recommended for trajectory analysis in development |
| SQuaD-MDS | Structure preservation | Excellent local structure preservation [50] | Optimal for maintaining developmental hierarchies |
| LDA | Reproducing manual gating | Highest precision with predefined labels [53] | Best for validation against established stem cell markers |
A separate comparison of nine clustering methods for mass cytometry data found that PhenoGraph and FlowSOM performed better than other unsupervised tools in precision, coherence, and stability [53]. The study also revealed that PhenoGraph and Xshift were more robust when detecting refined sub-clusters, while DEPECHE and FlowSOM tended to group similar clusters into meta-clusters [53]. These performance characteristics directly inform tool selection for stem cell applications where identifying rare subpopulations or continuous differentiation states is paramount.
Experimental Protocols and Validation
Strategic Panel Design Workflow
The design of effective antibody panels requires a systematic approach that aligns technological capabilities with biological questions. The following workflow, derived from multiple methodological studies, provides a validated framework for optimal panel design:
Detailed Methodological Protocols
Mass Cytometry Protocol for Stem Cell Characterization
Based on published studies utilizing CyTOF for deep immunophenotyping [9] [51], the following protocol provides a robust methodology for stem cell population characterization:
Sample Preparation:
- Harvest stem cells and create single-cell suspension using enzymatic dissociation (trypsin-EDTA or collagenase IV for tough matrices)
- Wash cells twice in PBS with 1% BSA and count using hemocytometer or automated counter
- Aliquot 1-3×10^6 cells per sample for staining procedure
Cell Staining with Metal-Labeled Antibodies:
- Resuspend cells in 1mL of cell staining media (PBS with 1% BSA)
- Add Fc receptor blocking solution (human Fc block) for 10 minutes at 4°C to reduce non-specific binding
- Add metal-tagged antibody cocktail (pre-titrated concentrations) and incubate for 30 minutes at 4°C in the dark
- Wash cells twice with cell staining media (centrifuge at 500×g for 5 minutes)
- For intracellular markers, fix cells with 1.6% formaldehyde for 10 minutes at room temperature, permeabilize with ice-cold methanol for 10 minutes on ice, then stain with intracellular antibody cocktail
- Resuspend cells in 1mL of intercalator solution (125nM iridium191/193 in PBS with 1.6% formaldehyde) and incubate overnight at 4°C
Data Acquisition on CyTOF:
- Wash cells twice in PBS and twice in deionized water
- Dilute cells to 0.5-1×10^6 cells/mL in deionized water containing 1×EQ normalization beads
- Filter through 35μm nylon mesh before acquisition
- Acquire data at event rate of 200-500 cells/second to minimize signal aboration
Data Preprocessing:
- Normalize data using bead-based normalization algorithm
- Remove debris, doublets, and normalization beads using DNA content and event length gating
- Transform data using hyperbolic inverse sine (arcsinh) function with co-factor of 5 [53]
This protocol has been successfully applied to characterize heterogeneous stem cell populations, including the identification of rare progenitor subsets in complex differentiation cultures [51].
Spectral Flow Cytometry Panel Validation
For spectral flow cytometry applications, the following validation protocol ensures optimal panel performance:
Fluorophore Selection and Validation:
- Select fluorophores covering the full spectral range while minimizing spillover
- Include "spectral controls" (single-stained samples) for unmixing algorithm training
- Validate spillover spreading matrix using compensation control particles
Panel Assembly and Titration:
- Group antibodies by abundance, matching bright fluorophores to low-abundance markers
- Perform serial titration of each antibody to determine optimal signal-to-noise ratio
- Test antibody-fluorophore combinations for stability and specificity
Experimental Validation:
- Run full panel on biological controls (positive and negative populations)
- Validate with fluorescence-minus-one (FMO) controls to establish gating boundaries
- Assess panel performance using separation index metric for critical marker pairs
Research Reagent Solutions and Materials
Successful implementation of high-dimensional cytometry requires specific reagents and materials optimized for each platform. Table 3 details essential research reagent solutions for stem cell applications across cytometry platforms.
Table 3: Essential Research Reagent Solutions for Cytometry Platforms
| Reagent/Material | Function/Purpose | Platform Specificity | Stem Cell Application Notes |
|---|---|---|---|
| Metal-Labeled Antibodies | Target protein detection | Mass cytometry [9] | Requires validated clones for stem cell surface markers (CD34, CD133, etc.) |
| Fluorescently Conjugated Antibodies | Target protein detection | Flow/Spectral cytometry [1] | Bright fluorophores recommended for low-abundance markers |
| Cell Viability Dyes | Exclusion of dead cells | All platforms | Critical for accuracy in stem cell analysis [15] |
| Intracellular Staining Kits | Detection of intracellular antigens | All platforms | Required for transcription factor analysis in stem cells |
| EQ Normalization Beads | Signal normalization | Mass cytometry [50] | Enables signal standardization across runs |
| Compensation Beads | Compensation controls | Flow/Spectral cytometry | Essential for multicolor panel setup |
| DNA Intercalators | Cell identification/nuclei labeling | Mass cytometry [51] | Iridium-based for event discrimination |
| Collagenase/Dispase | Tissue dissociation | All platforms | Specific types optimized for stem cell niches |
Signaling Pathways in Stem Cell Differentiation
The analysis of signaling pathways is crucial for understanding stem cell fate decisions. High-dimensional cytometry enables simultaneous monitoring of multiple signaling pathways at single-cell resolution. The following diagram illustrates key pathways that can be simultaneously monitored using strategic panel design:
This integrated view of stem cell signaling highlights how strategic panel design must encompass markers across multiple pathways to capture the complexity of fate decisions. For example, mass cytometry panels have been successfully designed to simultaneously measure 15+ phospho-proteins in single stem cells, revealing heterogeneity in pathway activation that correlates with differentiation potential [51].
Comparative Analysis and Data Interpretation
Platform Selection Guidelines
The choice between cytometry platforms depends on multiple experimental factors. Table 4 provides a decision framework based on common research scenarios in stem cell biology and drug development.
Table 4: Platform Selection Guide for Specific Research Applications
| Research Scenario | Recommended Platform | Rationale | Optimal Panel Size |
|---|---|---|---|
| High-throughput screening | Spectral flow cytometry | Balance of parameter number and throughput [1] | 25-35 markers |
| Rare population detection | Mass cytometry | Minimal background improves sensitivity [50] | 35-40+ markers |
| Functional signaling analysis | Mass cytometry | Multiplexed phospho-protein detection [51] | 30-40 markers |
| Live cell sorting | Spectral flow cytometry | Maintains cell viability with sorting capability [1] | 20-30 markers |
| Longitudinal studies | Spectral flow cytometry | Lower cost per sample enables larger n [54] | 15-25 markers |
| Maximizing discovery | Mass cytometry | Highest parameter count for unbiased analysis [50] | 40+ markers |
Data Quality Assessment Metrics
Regardless of platform selection, rigorous quality control is essential for valid experimental outcomes. Key assessment metrics include:
- Signal-to-Noise Ratio: Calculate using positive and negative control populations for each marker
- Separation Index: Measure of population resolution using statistical distance metrics
- Staining Index: Quantitative assessment of specific signal above background
- CV Assessment: Coefficient of variation for replicate samples and population homogeneity
- Background Comparison: Fluorescence-minus-one (FMO) controls for proper gating boundaries
Implementation of these quality metrics ensures that the balance between marker number, specificity, and brightness translates to biologically meaningful data rather than technical artifacts.
Strategic panel design in cytometry represents an optimization challenge with direct implications for research outcomes in stem cell biology and drug development. The comparative data presented demonstrates that no single platform dominates all applications; rather, the choice between conventional flow, spectral, and mass cytometry depends on specific research priorities regarding parameter depth, throughput, and analytical requirements. As computational methods continue to advance, particularly through integration of artificial intelligence and machine learning [9] [12], the potential information yield from well-designed panels will further increase. By applying the systematic frameworks for panel design, experimental validation, and data quality assessment outlined in this guide, researchers can maximize the return on investment in cytometry technologies while generating robust, reproducible data that advances our understanding of stem cell biology and therapeutic development.
In stem cell and immunology research, the transition to high-dimensional single-cell analysis has been a game-changer for understanding cellular heterogeneity and function. However, this advanced capability often comes up against a fundamental laboratory constraint: limited sample availability. This is particularly true for precious samples like peripheral blood mononuclear cells (PBMCs), tissue biopsies, and cryopreserved specimens [55]. Navigating the input requirements for different technological platforms is therefore not merely a technical consideration but a crucial determinant of experimental feasibility and success. Flow cytometry has long been the workhorse for single-cell analysis, but its parameter limitation often necessitates splitting samples across multiple tubes, thereby increasing the cell number required for a comprehensive profile [55]. Mass cytometry (CyTOF) emerged to overcome this bottleneck by enabling simultaneous measurement of 40+ parameters from a single tube, an advantage that becomes critical when sample material is scarce [56] [55]. Nevertheless, this advantage is balanced against specific challenges, including higher cell loss during acquisition and more complex sample preparation protocols [11]. This guide objectively compares the performance of these platforms in the context of sample-limited studies, providing the experimental data and protocols needed to inform platform selection for your specific research context.
Platform Comparison: Quantitative Input Requirements and Performance Metrics
The choice between conventional flow cytometry, spectral flow cytometry, and mass cytometry involves trade-offs between data dimensionality, cell recovery, and operational throughput. The following table summarizes the key performance characteristics relevant to working with limited samples.
Table 1: Platform Comparison for Sample-Limited Studies
| Key Consideration | Conventional Flow Cytometry | Spectral Flow Cytometry | Mass Cytometry (CyTOF) |
|---|---|---|---|
| Typical Panel Size | ~12-15 parameters [55] | Up to 40+ parameters [11] | 40-60+ parameters [55] [57] |
| Cell Input Requirement | Lower (varies by panel number) | Lower, suitable for low-yield samples [11] | Higher, requires 2-3 times more input than spectral flow [11] |
| Acquisition Efficiency | High; minimal cell loss | High; minimal cell loss | Lower; ~15-25% cell loss during acquisition [11] |
| Throughput & Stability | High acquisition speed; limited post-stain stability (<24 hours) [11] | High acquisition speed; limited post-stain stability (<24 hours) [11] | Slower acquisition rates; high post-stain stability [11] |
| Key Sample Limitation | High cell consumption for large panels requiring multiple tubes [55] | Excellent balance of panel size and cell recovery [11] | High initial input and acquisition loss can be prohibitive for very low-yield samples [11] |
Interpreting the Data for Your Research
The quantitative data in Table 1 reveals a critical insight: while mass cytometry provides the highest parameterization, it does so at the cost of higher cell input and significant acquisition-related cell loss (approximately 15-25%) [11]. This makes spectral flow cytometry a powerful compromise, offering large panels without the high cell attrition of CyTOF, which is particularly advantageous for tumor-infiltrating lymphocytes (TILs) or cells from biopsies [11]. Furthermore, the post-staining stability of mass cytometry reagents is a notable operational advantage for large studies, as stained samples can be acquired over longer periods without significant degradation [11]. For studies where the primary readout is mean fluorescence intensity (MFI) and panel size is modest (<12 markers), conventional flow cytometry offers the most stable and standardized measurement [11].
Experimental Protocols for Sample-Limited Studies
A Staining Protocol for Mass Cytometry with Limited Samples
The following protocol is adapted from a detailed method for hematopoietic-derived cells, emphasizing steps that maximize information yield from scarce samples, including the use of barcoding [58].
Before You Begin:
- Institutional approvals must be obtained for working with human specimens.
- Prepare key reagents in advance:
- CyTOF Staining Media (CSM): Sterile PBS supplemented with 2% FBS and 0.5% sodium azide.
- Thawing Media: RPMI containing 5% FBS.
- Antibody Master Mixes: Prepare in CSM or permeabilization buffer based on the staining step.
Day 1: Sample Preparation and Barcoding
- Sample Thawing: Quickly retrieve cryopreserved vials from liquid nitrogen and thaw in a 37°C water bath. Immediately resuspend the thawed cell pellet in 5 mL of pre-warmed Thawing Media.
- Cell Counting and Viability Assessment: Perform a cell count using a hemocytometer. Consider using a viability stain like cisplatin to assess the percentage of live cells, which is crucial for downstream normalization [56] [58].
- Live-Cell Barcoding: This is a critical step for sample-limited studies.
- Pooling multiple samples reduces antibody consumption, eliminates the need for repeated instrument adjustment, and, most importantly, minimizes batch-to-batch variation [58] [59].
- Use a combination of CD45 antibodies conjugated to different platinum isotopes (e.g., ¹⁹⁴Pt, ¹⁹⁸Pt) and a palladium-based barcoding kit (e.g., Cell-ID 20-plex Pd Barcoding Kit) to uniquely label each sample [58].
- Combine up to 40 uniquely barcoded samples into a single tube for all subsequent staining and acquisition steps [58].
Day 2: Staining and Acquisition
- Surface Staining:
- Resuspend the barcoded cell pool in the surface stain master mix (a 2x mix of all extracellular antibodies in CSM).
- Incubate for 30 minutes at room temperature.
- Wash cells twice with CSM.
- Viability and Fixation:
- Intracellular Staining:
- Permeabilize cells using a commercial permeabilization buffer (e.g., from the eBioscience FOXP3/Transcription Factor staining kit).
- Resuspend the cell pellet in the intracellular stain master mix (antibodies against transcription factors, cytokines, etc.).
- Incubate for 30 minutes at room temperature.
- Wash cells twice with CSM.
- DNA Staining and Acquisition:
- Resuspend cells in an iridium-containing intercalator (e.g., Cell-ID Intercalator-Ir) in fixing buffer to label DNA, which is required for cell identification in mass cytometry [56].
- Acquire data on the mass cytometer. The barcoded samples are acquired as a single file, which is subsequently deconvoluted based on the barcode signatures.
Protocol Visual Workflow
The following diagram illustrates the key stages of the mass cytometry protocol, highlighting steps designed to optimize sample and reagent use.
The Scientist's Toolkit: Key Reagent Solutions
Success in high-dimensional cytometry hinges not only on the instrument but also on the careful selection and use of reagents. The following table details essential materials and their functions, particularly for mass cytometry.
Table 2: Essential Research Reagents for Mass Cytometry
| Reagent / Material | Function / Application | Key Considerations |
|---|---|---|
| Heavy Metal-Labeled Antibodies | Probe conjugation for target detection [56] | Limited commercial availability often requires custom conjugation using Maxpar labeling kits [11] [57]. |
| Palladium Barcoding Kit | Live-cell barcoding to multiplex samples [58] | Reduces batch effects, antibody consumption, and identifies inter-sample doublets [58] [57]. |
| Iridium Intercalator | DNA labeling for cell identification [56] [58] | Essential as mass cytometry lacks light scatter for cell detection [56]. |
| Cisplatin | Viability staining [56] [58] | Distinguishes live/dead cells; critical for data quality. Highly toxic, requires careful handling [58]. |
| FC Receptor Blocker | Blocks non-specific antibody binding [58] | Improves signal-to-noise ratio, especially for low-abundance markers. |
| Permeabilization Buffer | Enables intracellular antibody access [58] | Required for staining transcription factors, cytokines, etc. |
Choosing the right platform for sample-limited studies requires a strategic balance between data depth and practical constraints. Mass cytometry (CyTOF) is unparalleled for its high-dimensional depth from a single assay tube, making it ideal for deep, exploratory immune profiling when the starting cell number is sufficient [55]. However, its value diminishes with extremely low-yield samples due to high cell loss. Spectral flow cytometry presents a robust alternative, offering larger panels than conventional flow with excellent cell recovery, making it suited for TILs and biopsy samples [11]. Conventional flow cytometry remains the most standardized and stable platform for focused panels and MFI-based readouts [11].
Final Recommendations:
- For maximal parameter discovery with adequate cell input (>1-2 million cells recommended): Choose Mass Cytometry.
- For balanced panel size and cell recovery with low-yield samples (e.g., biopsies): Choose Spectral Flow Cytometry.
- For focused, high-precision clinical assays (<12 markers): Choose Conventional Flow Cytometry.
Regardless of the platform, employing best practices like live-cell barcoding and rigorous viability assessment is essential for maximizing the value of every cell and ensuring the generation of high-quality, reproducible data in stem cell and immunology research.
In the evolving landscape of single-cell analysis for stem cell research, selecting the appropriate technological platform is a critical decision that directly impacts data quality, experimental flexibility, and research outcomes. Flow cytometry has long been a cornerstone technique, but recent technological advancements have given rise to powerful alternatives like mass cytometry (CyTOF) and spectral flow cytometry. This guide provides an objective comparison of these platforms, focusing on three pivotal operational considerations: throughput, post-stain stability, and reagent availability. Understanding these parameters is essential for researchers and drug development professionals aiming to optimize their experimental designs in stem cell characterization, immunophenotyping, and therapeutic development.
Platform Comparison: Throughput, Stability, and Reagents
The table below summarizes the core characteristics of mass cytometry and spectral flow cytometry based on current industry data and practices.
Table 1: Direct Comparison of Mass Cytometry and Spectral Flow Cytometry
| Consideration | Spectral Flow Cytometry | Mass Cytometry (CyTOF) |
|---|---|---|
| Acquisition Throughput | High acquisition speed, comparable to conventional flow cytometry [11]. | Slower acquisition rates, typically around 250-500 cells per second [11] [3]. |
| Post-Stain Stability | Limited; samples are generally unstable and should be acquired within 24 hours of staining [11]. | High; exceptional long-term stability due to the use of stable metal isotopes, allowing for analysis days after staining [11]. |
| Reagent Availability | Wide selection of commercially available fluorochrome-conjugated antibodies from multiple vendors [11]. | Limited commercially available reagents; often requires custom conjugation of antibodies to heavy metals [11]. |
| Panel Size & Complexity | Excellent for large panels (40+ markers); also excels with smaller panels (12-20 colors) for lowly expressed markers [11]. | Excellent for very large panels (40+ markers) with minimal channel crosstalk [11] [3]. |
| Cell Input Requirements | Lower cell input required, making it suitable for low-yield samples like tumor-infiltrating lymphocytes [11]. | Requires 2-3 times higher cell input, with approximately 15-25% of cells lost during acquisition [11]. |
Experimental Protocols for Platform Assessment
To generate the comparative data discussed in this guide, standardized experimental protocols are essential. The following methodologies outline the key steps for preparing and analyzing samples on each platform, particularly relevant for stem cell and immune cell research.
Protocol for Mass Cytometry (CyTOF) Analysis
This protocol is adapted from studies utilizing split-sample designs for direct platform comparisons [10] [45].
Cell Staining:
- Viability Staining: Incubate cells with cisplatin (10 µM in PBS) to identify non-viable cells. Quench the reaction with cell staining medium (CSM).
- Surface Marker Staining: Block cells with 10% donkey serum. Stain with a pre-titrated cocktail of metal-tagged antibodies against surface antigens.
- Fixation and Permeabilization: Fix cells at room temperature for 10 minutes in 1.6% paraformaldehyde (PFA). For intracellular marker staining, permeabilize cells with ice-cold methanol for 10 minutes.
- Intracellular Staining: Stain with a cocktail of metal-tagged antibodies for intracellular targets.
- DNA Labeling: Incubate cells with an Iridium intercalator overnight at 4°C to label DNA for cell identification.
Data Acquisition:
- Normalization beads are added to the stained sample to correct for instrument sensitivity fluctuations [10].
- The sample is filtered and acquired on the mass cytometer at a cell event rate of ~250 cells per second [10].
- Acquired data is normalized and de-barcoded (if applicable) to generate standard FCS files for analysis.
Protocol for Spectral Flow Cytometry Analysis
Panel Design:
- Select antibodies conjugated to fluorophores with distinct spectral signatures. The full-spectrum detection allows the use of dyes with significant emission overlap, provided their full spectra are unique [1].
- Carefully titrate all antibodies to determine optimal signal-to-noise ratios.
Cell Staining:
- The staining procedure for surface antigens is similar to conventional flow cytometry, involving antibody incubation, washing, and resuspension in a suitable buffer.
- For intracellular staining, cells are fixed and permeabilized according to standard protocols before antibody incubation.
Data Acquisition and Unmixing:
- Acquire data on the spectral flow cytometer using the manufacturer's recommended settings and acquisition speeds.
- The full emission spectrum from each cell is captured across an array of detectors.
- Using single-stained controls, specialized software performs "spectral unmixing" to deconvolute the overlapping signals and assign a specific value for each marker to every cell [1].
Diagram Title: Experimental Workflow and Stability Considerations
The Scientist's Toolkit: Key Research Reagent Solutions
Successful implementation of either platform depends on a suite of essential reagents and materials. The table below details these key components and their functions in high-parameter single-cell analysis.
Table 2: Essential Reagents and Materials for Single-Cell Proteomics
| Item | Function | Key Considerations |
|---|---|---|
| Heavy Metal-Labeled Antibodies (CyTOF) | Tag specific cellular proteins (e.g., CD markers) for detection by mass spectrometer. | Often require custom conjugation; limited commercial availability necessitates in-house expertise [11]. |
| Fluorochrome-Labeled Antibodies (Spectral) | Tag specific cellular proteins for detection by lasers and optical sensors. | Wide commercial availability from multiple vendors (e.g., BD, BioLegend, Thermo Fisher) allows for flexible panel design [11] [60]. |
| Cell Viability Stains | Distinguish live cells from dead cells to improve data quality. | Cisplatin is commonly used in CyTOF; fluorescent dyes like Zombie or Live/Dead stains are used in spectral flow [10]. |
| DNA Intercalator | Label cellular DNA to identify intact cells and for cell cycle analysis. | Iridium-based intercalators are standard for CyTOF; propidium iodide or DAPI are common for spectral flow. |
| Fixation and Permeabilization Buffers | Preserve cell structure and allow antibodies to access intracellular targets. | PFA is standard for fixation; methanol or detergent-based buffers are used for permeabilization [10]. |
| Normalization Beads | Correct for day-to-day variation in instrument sensitivity. | Essential for CyTOF data normalization; used with specific metal compositions [10]. |
The choice between mass cytometry and spectral flow cytometry is not a matter of one platform being universally superior, but rather which is best suited to the specific constraints and goals of a research project. Spectral flow cytometry offers clear advantages in throughput and reagent availability, making it ideal for fast-paced research environments and labs requiring flexible panel design. Conversely, mass cytometry excels in post-stain stability and minimizing spectral overlap, which is critical for large, complex panels and studies where batch analysis of stained samples is necessary. For stem cell researchers working with rare populations, the lower cell input requirement of spectral flow may be a deciding factor. Ultimately, the decision should be guided by a careful evaluation of experimental needs against the core considerations of throughput, stability, and reagent access.
The rapid advancement of single-cell technologies, including high-parameter flow cytometry and mass cytometry (CyTOF), has transformed biomedical research by enabling deep characterization of cellular heterogeneity at unprecedented resolution. These technologies can simultaneously measure dozens of parameters at the single-cell level, providing comprehensive insights into complex biological systems from stem cell differentiation to disease pathogenesis [61]. However, this analytical power comes with a significant challenge: the inherent complexity of high-dimensional data transcends the capabilities of traditional analysis methods such as manual gating, which is labor-intensive, subjective, and limited to two-dimensional projections [62] [63]. This limitation is particularly pronounced in stem cell research, where understanding the intricate regulatory networks that govern stem cell fate and function requires holistic analytical approaches [26].
To overcome these challenges, computational biologists have developed sophisticated algorithms that can reduce dimensionality, identify cellular clusters, and visualize complex datasets. Among these, SPADE (Spanning Tree Progression of Density Normalized Events), PhenoGraph, UMAP (Uniform Manifold Approximation and Projection), and t-SNE (t-Distributed Stochastic Neighbor Embedding) have emerged as pivotal tools in the analytical pipeline [53] [64] [63]. These methods enable researchers to detect novel cell populations, visualize developmental trajectories, and uncover relationships between cells that would remain hidden using conventional approaches. Within stem cell research, these tools are accelerating the characterization of stem cell heterogeneity, tracing differentiation pathways, and identifying novel progenitor populations – all critical for advancing regenerative medicine and therapeutic development [26]. This guide provides a comprehensive comparison of these four essential tools, their performance characteristics, and their practical applications in cytometry and stem cell research.
The high-dimensional analysis toolbox encompasses algorithms serving distinct functions in the analytical workflow. Dimensionality reduction methods like UMAP and t-SNE project high-dimensional data into two or three dimensions for visualization, while clustering algorithms like PhenoGraph and SPADE identify distinct cell populations within the data [65] [63]. Understanding their complementary strengths and limitations is essential for appropriate tool selection.
Table 1: Comparative Overview of High-Dimensional Analysis Tools
| Tool | Primary Function | Key Advantages | Key Limitations | Typical Applications |
|---|---|---|---|---|
| t-SNE | Non-linear dimensionality reduction | Excellent revelation of local data structure [65] | Computational intensive; Struggles with global structure preservation [65] | Visualizing distinct cell populations and local clusters |
| UMAP | Non-linear dimensionality reduction | Better preservation of global structure; Higher stability [65] | Requires careful hyperparameter tuning [65] | Visualizing both local and overarching data structure |
| PhenoGraph | Unsupervised clustering | High precision, coherence, and stability; Robust sub-cluster detection [53] | Performance impacted by increased sample size [53] | Identifying novel cell populations and rare cell types |
| SPADE | Clustering and trajectory inference | Visualizes cellular progression paths; Density normalization [64] | Cannot be directly compared to clustering-only tools [63] | Mapping differentiation trajectories and lineage relationships |
Table 2: Performance Benchmarks Across Multiple Studies
| Tool | Precision/Accuracy | Stability | Speed/Scaling | Handling Large Samples |
|---|---|---|---|---|
| t-SNE | High accuracy for local structure [65] | Moderate stability [65] | Highest computing cost [65] | Challenging with very large datasets |
| UMAP | Moderate accuracy; preserves cohesion and separation [65] | Highest stability among dimensionality methods [65] | Second highest computing cost after t-SNE [65] | Better scaling than t-SNE |
| PhenoGraph | Better than most unsupervised tools [53] | High stability [53] | Moderate runtime [53] | Performance decreases with sample size [53] |
| FlowSOM | Good precision [53] | Relatively stable as sample size increases [53] | Fast computational time [53] | Stable performance with increasing sample size [53] |
It is important to note that SPADE serves a different primary purpose compared to the other tools, focusing on trajectory inference rather than pure clustering. As such, its performance metrics are not directly comparable to methods like PhenoGraph [63]. When selecting the appropriate tool, researchers should consider whether their primary goal is population identification (clustering), data visualization (dimensionality reduction), or understanding developmental processes (trajectory inference).
Experimental Protocols and Methodologies
Benchmarking Clustering Algorithms
Comprehensive benchmarking studies have established standardized protocols for evaluating clustering algorithms in cytometry data. A landmark study compared nine clustering methods (seven unsupervised and two semi-supervised) across six independent mass cytometry datasets to evaluate precision, coherence, and stability [53]. The experimental protocol involved:
- Data Preparation: Six CyTOF datasets with varying characteristics were processed using arcsinh transformation with a co-factor of 5 for data normalization [53].
- Performance Assessment:
- Precision (External Evaluation): Four indicators (accuracy, weighted F-measure, Normalized Mutual Information, and Adjusted Rand Index) were calculated against manually gated labels considered as "ground truth" [53].
- Coherence (Internal Evaluation): The ability to identify inherent data structures was assessed without reference to manual gating [53].
- Stability: Robustness was tested against random subsampling and varying sample sizes [53].
- Resolution Assessment: The tendency of algorithms to detect refined sub-clusters versus grouping similar clusters into meta-clusters was evaluated [53].
This study found that PhenoGraph and FlowSOM performed better than other unsupervised tools across multiple performance categories, with PhenoGraph particularly excelling at detecting refined sub-clusters [53].
Benchmarking Dimensionality Reduction Methods
A separate benchmark evaluation assessed 10 dimensionality reduction methods using 30 simulation datasets and 5 real datasets, focusing on accuracy, stability, computing cost, and sensitivity to hyperparameters [65]. The methodology included:
- Dataset Diversity: Both simulated and real single-cell RNA sequencing datasets were employed to evaluate generalizability [65].
- Evaluation Metrics:
- Accuracy: Ability to preserve the original structure and separation of cell populations.
- Stability: Consistency of results across different samples and parameter settings.
- Computing Cost: Runtime and resource requirements.
- Hyperparameter Sensitivity: Each method's sensitivity to its key parameters was systematically tested [65].
The evaluation revealed that t-SNE yielded the best overall accuracy but with the highest computing cost, while UMAP exhibited the highest stability and moderate accuracy with better preservation of global data structure [65].
Application to B-Cell Neoplasm Classification
A practical application comparing machine learning methods for clinical flow cytometry data demonstrated how these tools perform in real-world diagnostic scenarios:
- Dataset: 21,152 clinical flow cytometry cases from the Munich Leukemia Laboratory spanning normal controls and eight different B-cell neoplasm subtypes [62].
- Algorithm Comparison: Three previously published methods (FlowCat, EnsembleCNN, and UMAP-RF) were examined for classifying flow cytometry data according to specific disease categories using ungated data [62].
- Evaluation Metrics: Multiclass classification accuracies and relative required computation times were reported [62].
This study found that despite different architectures, FlowCat and EnsembleCNN had similarly good accuracies with relatively fast computational times, with a speed advantage for EnsembleCNN particularly when adding training data and retraining the classifier [62].
Algorithmic Relationships and Workflows
The following diagram illustrates how these computational tools integrate into a typical high-dimensional cytometry data analysis workflow, from raw data processing to biological interpretation:
This workflow demonstrates that clustering and dimensionality reduction methods often serve complementary roles in the analytical pipeline. While they can be used independently, they frequently provide the most biological insight when employed together – for example, using PhenoGraph to identify discrete cell populations and UMAP to visualize their relationships in two-dimensional space [53] [65].
Essential Research Reagent Solutions
Successful implementation of these computational tools depends on high-quality experimental data generated with reliable reagents and instruments. The following table outlines key research solutions used in high-dimensional cytometry studies:
Table 3: Essential Research Reagents and Instruments for High-Dimensional Cytometry
| Research Solution | Function/Application | Specific Examples/Characteristics |
|---|---|---|
| Heavy Metal-labeled Antibodies | Target detection in mass cytometry | Lanthanide series metals; Minimal spectral overlap [61] |
| Fluorochrome Conjugates | Target detection in flow cytometry | BD Horizon Brilliant Ultraviolet Reagents; Panel design flexibility [66] |
| Mass Cytometer (CyTOF) | High-parameter single-cell analysis | Up to 45 simultaneous parameters; Limited compensation needs [61] |
| High-Parameter Flow Cytometers | Spectral flow cytometry analysis | Multiple laser systems; 20-30 parameter measurements [63] |
| Barcoding Labels | Sample multiplexing | Palladium-based barcodes; Ratiometry-based CD45 barcodes [61] |
| Cell Sorters | Population isolation | Configurable systems; Simple to advanced solutions [66] |
| Bioinformatics Software | Data analysis and visualization | FlowJo v10; Custom computational pipelines [66] |
These research solutions form the foundation for generating high-quality data that can be effectively analyzed with the computational tools discussed in this guide. Proper experimental design with appropriate controls and validated reagents is essential for obtaining biologically meaningful results from computational analysis [61] [66].
The computational tools overviewed in this guide – SPADE, PhenoGraph, UMAP, and t-SNE – have fundamentally enhanced our ability to extract meaningful biological insights from high-dimensional cytometry data. While each algorithm has distinct strengths and optimal applications, the collective advancement they represent has been transformative for fields including immunology, oncology, and particularly stem cell research, where understanding cellular heterogeneity and lineage relationships is paramount [26].
The future trajectory of this field points toward increased integration of these methods into comprehensive analytical pipelines rather than using them as standalone tools. We are already witnessing the emergence of multi-algorithm frameworks that leverage the complementary strengths of different approaches, as well as the development of novel machine learning methods like cytoGPNet that integrate deep learning with Gaussian processes to handle longitudinal cytometry data and small cohort studies [67]. Furthermore, the convergence of systems biology and artificial intelligence (SysBioAI) is creating powerful frameworks for holistic data analysis that can accelerate therapeutic development [26].
As these computational methods continue to evolve, they will undoubtedly face new challenges related to scalability, interpretability, and integration with emerging single-cell technologies. However, their central role in advancing biomedical research is now firmly established, providing researchers with an ever-expanding toolkit to overcome the complexities of high-dimensional biological data and ultimately accelerate the translation of basic research findings into clinical applications.
Benchmarking Dimension Reduction Methods for Optimal CyTOF Data Interpretation
Mass cytometry, or cytometry by time-of-flight (CyTOF), has emerged as a powerful technology for deep immunophenotyping, enabling the simultaneous measurement of over 40 proteins at the single-cell level. Unlike single-cell RNA-sequencing (scRNA-seq) data, CyTOF data are largely free of drop-out effects and are generated at a much higher throughput, often profiling millions of cells. However, the high-dimensional nature of CyTOF data presents significant analytical challenges. Dimension reduction (DR) serves as a critical first step in exploring this data, enabling visualization, clustering, and biological interpretation. The selection of an appropriate DR method profoundly influences all subsequent analyses, yet with over 20 available methods, researchers face considerable uncertainty in choosing the optimal approach for their specific data structure and analytical goals. This guide provides a comprehensive, evidence-based comparison of DR methods for CyTOF data, benchmarking their performance across a range of accuracy metrics and practical considerations to inform method selection within flow and mass cytometry research.
Comprehensive Performance Benchmarking of DR Methods
A landmark study systematically evaluated 21 dimension reduction methods on 535 real and synthetic CyTOF samples, providing unprecedented insights into their relative performance [21]. The benchmarking utilized 110 real CyTOF samples from 11 independent studies, encompassing peripheral blood, solid tissues, and 10 imaging mass cytometry (IMC) datasets from breast cancer, with cell counts ranging from 5,024 to 604,081 cells and 13 to 41 protein channels. To ensure comprehensive coverage of data characteristics, researchers also generated 425 synthetic CyTOF samples with systematically varied parameters using the Cytomulate simulation algorithm [21].
Performance was assessed using 16 metrics across four critical categories: (1) global structure preservation (accurately representing distances between distant clusters), (2) local structure preservation (maintaining neighborhoods of similar cells), (3) downstream analysis performance (impact on clustering and differential analysis), and (4) concordance with matched scRNA-seq data [21]. This multi-faceted evaluation revealed that no single method outperformed all others across all metrics, indicating strong complementarity between tools.
Table 1: Overall Performance Leaders in CyTOF Dimension Reduction
| Performance Category | Top Performing Methods | Key Strengths |
|---|---|---|
| Overall Balanced Performers | SAUCIE, scvis | Well-balanced performance across multiple accuracy metrics [21] |
| Structure Preservation | SQuaD-MDS, t-SNE (including SQuaD-MDS/t-SNE Hybrid) | Superior structure preservation; Excellent local neighborhood preservation [21] |
| Downstream Analysis | UMAP | Excellent performance in clustering and differential analyses following DR [21] |
| Runtime Efficiency | UMAP | Superior computational speed compared to other methods [21] |
The results rebut the common assumption that t-SNE and UMAP, as top performers for scRNA-seq data, are necessarily optimal for CyTOF. The study found that less well-known methods like SAUCIE, SQuaD-MDS, and scvis emerged as overall best performers, with each excelling in different aspects [21]. Importantly, the top methods depended highly on the specific characteristics of the CyTOF datasets, such as tissue and disease types, highlighting the importance of context-specific method selection.
Detailed Method Comparisons and Performance Metrics
Quantitative Performance Assessment
The comparative analysis employed rigorous quantitative metrics to evaluate each method's capability to preserve both global and local data structures. Global structure preservation was measured using metrics like distance-to-means correlation and neighborhood hit, which assess how well the low-dimensional embedding maintains the relative positions of distinct cell populations. Local structure preservation was evaluated through metrics such as mean local Jaccard similarity, which quantifies the preservation of immediate cellular neighborhoods [21].
Table 2: Detailed Performance Characteristics of Leading DR Methods
| Method | Global Structure | Local Structure | Downstream Analysis | Stability | Scalability | Ideal Use Cases |
|---|---|---|---|---|---|---|
| SAUCIE | High | High | High | Moderate | Moderate | General-purpose analysis of complex datasets |
| SQuaD-MDS | Very High | Moderate | Moderate | High | Moderate | Studies requiring faithful global structure representation |
| scvis | High | High | Moderate | Moderate | Low (with full data) | Analysis of subsampled datasets |
| UMAP | Moderate | High | Very High | High | High | Large-scale studies and exploratory analysis |
| t-SNE | Low | Very High | High | Moderate | Moderate | Fine-grained population discrimination |
Complementary Method Strengths
The benchmarking revealed distinct and complementary strengths among the top methods. SQuaD-MDS demonstrated exceptional capabilities in preserving the global structure of data, accurately representing distances between biologically distinct cell populations. Conversely, t-SNE excelled at local structure preservation, maintaining the fine-grained relationships between similar cell types, though it performed poorly in global structure preservation [21]. The SQuaD-MDS/t-SNE hybrid approach combined the advantages of both methods.
UMAP showed remarkable performance in downstream analyses, with clusters identified in UMAP space demonstrating high biological relevance in subsequent clustering and differential abundance testing [21]. Its computational efficiency also makes it suitable for large datasets. SAUCIE and scvis provided the most balanced performance profiles, performing well across multiple metrics without particular weaknesses.
Experimental Protocols and Implementation Guidelines
Standardized Data Pre-processing Pipeline
Proper data pre-processing is essential before applying any DR method. The benchmark studies consistently employed the following protocol:
- Data Transformation: Apply an inverse hyperbolic sine (arcsinh) transformation with a cofactor of 5 for mass cytometry data to stabilize variance and bring the data to a more Gaussian-like distribution [53]. For flow cytometry data, a higher cofactor (150-6000) is typically used [68] [69].
- Data Cleaning: Remove unassigned cells and markers not used in the analytical scheme to reduce noise [8].
- Batch Effect Correction: When integrating multiple batches, apply appropriate correction methods to minimize technical variability [70].
- Subsampling: For computationally intensive methods like scvis, subsample large datasets to ~10,000 cells for model training, though the full dataset can be used if resources allow [21].
Benchmarking Workflow and Evaluation Framework
The evaluation of DR methods should follow a systematic workflow to ensure comprehensive assessment. The benchmark studies employed a multi-step process that can be adapted for individual research projects:
This workflow emphasizes the importance of evaluating multiple methods against standardized metrics before selecting the optimal approach for a given dataset and research question.
Essential Research Reagent Solutions
Successful implementation of dimension reduction methods requires appropriate computational tools and resources. The following table details key software solutions and their applications in CyTOF data analysis.
Table 3: Essential Computational Tools for CyTOF Data Analysis
| Tool/Resource | Type | Primary Function | Application in DR Workflow |
|---|---|---|---|
| CytoPheno | Automated annotation tool | Assigns marker definitions and cell type names to clusters | Post-DR cluster phenotyping [8] |
| HDCytoData | Data package | Provides benchmark datasets in standardized formats | Method validation and comparison [69] |
| Cytomulate | Simulation algorithm | Generates synthetic CyTOF data with known properties | Method development and testing [21] |
| ImmCellTyper | Comprehensive toolkit | Integrates BinaryClust for semi-supervised clustering | Combines DR with automated cell type identification [70] |
| CyTOF DR Package | Implementation pipeline | Unified implementation of multiple DR methods | Homogenized execution of DR methods [21] |
These resources significantly enhance the reproducibility and efficiency of CyTOF data analysis. The HDCytoData package, available through Bioconductor, provides standardized benchmark datasets in SummarizedExperiment and flowSet formats, facilitating method validation [69]. For researchers developing new methods, the Cytomulate algorithm enables systematic testing on synthetic data with known ground truth [21].
Practical Recommendations for Method Selection
Based on the comprehensive benchmarking results, method selection should be guided by specific analytical priorities and data characteristics:
For discovery research exploring unknown cellular heterogeneity: Prioritize methods with balanced performance profiles like SAUCIE or scvis, which adequately preserve both local and global structures without strong biases [21].
For datasets with clear biological hierarchy: When maintaining relationships between major cell lineages is critical, SQuaD-MDS provides superior global structure preservation, enabling accurate representation of developmental trajectories [21].
For identifying fine-grained subpopulations: When discriminating between highly similar cell states is the priority, t-SNE offers exceptional local structure preservation, though at the cost of distorting global relationships [21].
For large-scale studies or resource-constrained environments: UMAP provides the best combination of computational efficiency and downstream analysis performance, particularly beneficial when analyzing millions of cells [21].
For standardized pipeline development: The CyTOF DR Package provides a unified implementation of multiple methods, while the CyTOF DR Playground webserver enables exploratory analysis of benchmark results to inform method selection based on dataset similarity [21].
The high complementarity between methods suggests that employing multiple approaches may provide the most comprehensive insights, particularly for novel datasets where the underlying structure is unknown. Furthermore, semi-supervised approaches like BinaryClust (within ImmCellTyper) can enhance biological interpretability by incorporating prior knowledge while maintaining the ability to discover novel populations [70].
Head-to-Head Comparison: Selecting the Right Platform for Your Stem Cell Study
The advent of high-dimensional single-cell analysis has revolutionized cellular research, with spectral flow cytometry (SFC) and mass cytometry (CyTOF) emerging as leading platforms for deep immunophenotyping. For researchers in stem cell biology and drug development, choosing the appropriate technology is crucial for experimental success. This guide provides a direct, data-driven comparison of the concordance between these platforms, drawing from recent controlled studies to inform platform selection for specific research applications.
Quantitative Comparison of Platform Performance
The table below summarizes key performance metrics from direct comparative studies, providing a quantitative basis for platform evaluation.
Table 1: Direct Performance Comparison Between Spectral Flow and Mass Cytometry
| Performance Metric | Spectral Flow Cytometry (SFC) | Mass Cytometry (CyTOF) | Experimental Context & Concordance |
|---|---|---|---|
| Panel Size | Up to 40+ markers [11] | Up to 40+ markers [11] | Both suitable for high-dimensional panels; minimal crosstalk in CyTOF offers slight design advantage [11]. |
| Correlation of Cell Population Quantification | Strong correlation (ρ=0.99) for major immune populations [71] | Strong correlation (ρ=0.99) for major immune populations [71] | High concordance observed in quantification of major immune cell populations using a 21-marker panel [71]. |
| Sensitivity (Molecules per Cell) | ~40 molecules [71] | ~400-500 molecules [71] | SFC offers higher sensitivity for detecting low-abundance proteins [71]. |
| Acquisition Rate | ~20,000 events/second [71] | ~300 events/second [71] | SFC provides significantly higher throughput, beneficial for processing large sample numbers [71]. |
| Cell Recovery Rate | Median 53.1% [71] | Median 26.8% [71] | SFC demonstrates superior cell recovery, critical for low-yield samples [71]. |
| Intra-Measurement Variability (Coefficient of Variation) | Median 42.5% [71] | Median 68.0% [71] | SFC showed significantly lower variability in one study (p<0.0001) [71]. |
| Post-Staining Stability | Limited (<24 hours) [11] | Exceptionally long [11] | CyTOF's metal-labeled reagents are more stable, allowing for batch analysis over time [11]. |
Experimental Protocols for Comparative Studies
To ensure valid and reproducible comparisons, studies must follow rigorous, standardized protocols. The methodology below is synthesized from several direct comparative studies.
Sample Preparation and Staining
- Sample Source: Studies typically use human peripheral blood mononuclear cells (PBMCs) from healthy donors or murine splenocytes to ensure a complex, biologically relevant cell mixture [71] [68]. Samples are split-aliquoted for parallel processing on both platforms.
- Antibody Panel Design: Panels of 21-33 markers are constructed with identical antibody clones for direct comparison whenever possible [45] [71]. Markers are selected to cover a broad range of immune cell lineages.
- SFC Panel: Antibodies are conjugated to fluorochromes. Titration is performed according to established guidelines (e.g., EuroFlow) to optimize signal-to-noise ratios [71]. Panel design must account for spectral overlap.
- CyTOF Panel: Antibodies are conjugated to heavy metal isotopes. Dimly expressed markers are assigned to metals in the 159-175 mass range for optimal sensitivity. Panel design must account for isotopic impurities and oxide formation [71].
- Staining Protocol:
- Viability Staining: Cells are stained with cisplatin for CyTOF or a near-IR viability dye for SFC [68].
- Fc Receptor Blocking: Incubate with Fc block to reduce non-specific antibody binding.
- Surface Staining: Incubate with antibody cocktail for 20-30 minutes at 4°C [68].
- Intracellular Staining (if required): Cells are fixed and permeabilized before staining with intracellular antibodies (e.g., for transcription factors) [68].
- Fixation: For CyTOF, cells are fixed in paraformaldehyde containing a DNA intercalator (Iridium) [68]. For SFC, cells are fixed if not acquired immediately.
Data Acquisition and Processing
- Data Acquisition:
- Data Pre-processing:
- Transformation: Data is transformed using the inverse hyperbolic sine (arcsinh) function to stabilize variance. Cofactors are platform-specific (e.g., 5 for CyTOF, 6000 for SFC) [68].
- Normalization: For CyTOF, signal drift is corrected using normalization beads [10].
- Downsampling: To ensure equitable comparison, datasets are often downsampled to an equal number of events [68].
Analysis Workflow and Data Interpretation
The following diagram illustrates the standard workflow for a direct comparison study, from sample preparation to data interpretation.
The Scientist's Toolkit: Essential Research Reagents and Materials
Successful high-dimensional cytometry requires careful selection of reagents and materials. The following table lists essential components for conducting these experiments.
Table 2: Essential Research Reagent Solutions for Comparative Cytometry Studies
| Reagent/Material | Function | Platform-Specific Considerations |
|---|---|---|
| Viability Probes | Distinguishes live/dead cells to ensure analysis integrity. | SFC: Near-IR fluorescent dyes (e.g., Zombie NIR) [68].CyTOF: Metal-based cisplatin [68]. |
| Antibody Panels | Detection of surface and intracellular markers for cell phenotyping. | SFC: Fluorophore-conjugated antibodies. Wide commercial availability allows flexibility [11].CyTOF: Heavy metal-conjugated antibodies. Often require in-house conjugation due to limited commercial options [11]. |
| Cell Staining Media | Provides optimal buffer for antibody binding while reducing non-specific binding. | PBS with BSA and sodium azide is common to both platforms [68]. Brilliant Buffer is often used with SFC for tandem dye stability [68]. |
| Fixation & Permeabilization Kits | Preserves cells and allows access to intracellular antigens. | Commercially available kits (e.g., FoxP3/Transcription Factor Staining Buffer Kit) are validated for both platforms [68]. |
| DNA Intercalator | Identifies nucleated cells; required for CyTOF. | CyTOF: Iridium-based intercalator (e.g., Cell-ID Intercalator-Ir) [68].SFC: Not required. |
| Normalization Beads | Corrects for signal drift during long acquisition runs. | CyTOF: Essential, composed of lanthanide metals [10].SFC: Not typically used. |
Application in Stem Cell Research
Mass cytometry has proven particularly valuable in stem cell research for delineating complex differentiation processes and heterogeneous populations. For example, one study investigated the reprogramming of human induced pluripotent stem cells (hiPSCs) using a 10-marker CyTOF panel targeting pluripotency and cell cycle markers [5]. Computational analyses like SPADE and PhenoGraph successfully identified distinct intermediate cell clusters active during the reprogramming process and revealed distinctive expression patterns of key pluripotency markers like OCT4 and TRA-1-60 [5]. While SFC is equally capable of such analysis, the published methodology for stem cell applications is currently more established for CyTOF.
Direct comparative studies reveal a high degree of concordance between spectral flow and mass cytometry in quantifying major immune cell populations. The choice between platforms is not a matter of superiority but of strategic alignment with research goals. SFC offers higher throughput, better cell recovery, and superior sensitivity for low-abundance targets, making it ideal for studies with limited sample material or high sample numbers. CyTOF provides maximal panel flexibility with minimal crosstalk and excellent post-stain stability, advantageous for complex discovery projects. For stem cell researchers, the decision should be guided by specific requirements for panel size, sample availability, and the need to resolve rare subpopulations within complex differentiation landscapes.
In single-cell analysis, one of the most critical strategic decisions researchers face is balancing the depth of multiparameter measurement against the sensitivity of detection. While the ability to measure 40+ parameters simultaneously provides a systems-level view of cellular biology, this expanded panel size introduces specific technical constraints that can impact data quality. This guide objectively compares how mass cytometry and spectral flow cytometry address this fundamental trade-off, providing researchers with evidence-based criteria for technology selection in stem cell research and drug development.
The core challenge lies in the physics of detection: as more cellular parameters are measured simultaneously, the signals from different probes inevitably interfere, potentially compromising the ability to detect low-abundance targets. Mass cytometry uses rare earth metal isotopes and time-of-flight mass spectrometry to minimize this interference, enabling high-dimensional measurement with minimal signal overlap. In contrast, spectral flow cytometry employs full-spectrum fluorescence detection and computational unmixing to resolve complex signatures. Understanding the performance characteristics of each platform is essential for designing experiments that accurately capture the complexity of cellular systems.
Technology Comparison: Mass Cytometry vs. Spectral Flow Cytometry
Table 1: Core Technology Comparison Between Mass Cytometry and Spectral Flow Cytometry
| Feature | Mass Cytometry (CyTOF) | Spectral Flow Cytometry |
|---|---|---|
| Detection Principle | Time-of-flight mass spectrometry of metal isotopes [44] | Full-spectrum fluorescence detection with computational unmixing [17] |
| Maximum Parameters | 40+ simultaneously [44] | 30-40+ with high-end systems [72] |
| Signal Overlap | Minimal between metal mass channels [23] | High spectral overlap, resolved mathematically [73] |
| Sensitivity Limitation | Lower due to ionization inefficiency and cell vaporization [74] | Higher with sensitive photodetectors, but affected by autofluorescence [17] |
| Throughput | ~1,000 cells/second [44] | Tens of thousands of cells/second [72] |
| Live Cell Analysis | Not possible (cells are vaporized) [23] | Possible [75] |
| Key Advantage | Minimal compensation needs for highly multiplexed panels [23] | Preserves live cells and familiar workflow [72] |
Experimental Evidence: Parameter Scaling and Sensitivity Impact
Case Study 1: Mass Cytometry in Stem Cell Reprogramming
Experimental Protocol: A 2019 study investigated human induced pluripotent stem cell (hiPSC) reprogramming using mass cytometry with a 10-parameter panel targeting pluripotency markers (OCT4, SOX2, NANOG, TRA-1-60), cell cycle markers (pRB, Cyclin B1, Ki67, pHistone H3), and lineage markers (CD44, c-MYC) [5].
Methodology: Human fibroblasts were reprogrammed using episomal vectors and sampled at days 10 and 20. Cells were stained with metal-tagged antibodies, fixed, and analyzed on a Helios mass cytometer. Computational analysis included SPADE, PhenoGraph, and diffusion mapping to resolve distinct cellular clusters along the reprogramming trajectory [5].
Findings: The study successfully resolved intermediate reprogramming populations that expressed neither fibroblast nor pluripotency markers, demonstrating mass cytometry's ability to detect rare transitional states in a complex differentiation process. However, the researchers noted limitations in detecting low-abundance transcription factors without specialized amplification techniques [5].
Case Study 2: Spectral Flow Cytometry in Clinical MRD Detection
Experimental Protocol: A 2023 study developed a 24-color spectral flow cytometry panel for minimal residual disease (MRD) detection in acute myeloid leukemia (AML) [17].
Methodology: Bone marrow samples from AML patients post-treatment were stained with a comprehensive antibody panel and analyzed on spectral flow cytometers. The full-spectrum detection enabled simultaneous measurement of lineage markers and leukemia-associated immunophenotypes with autofluorescence extraction to improve signal-to-noise ratio [17].
Findings: The assay achieved sensitivity below 0.02% (1 in 5,000 cells) while maintaining 24-parameter analysis, successfully identifying rare leukemic cells within complex hematopoietic backgrounds. The study highlighted spectral cytometry's utility in volume-limited clinical samples where comprehensive phenotyping is essential for accurate disease monitoring [17].
Technical Workflow: Mass Cytometry Analysis Pipeline
The following diagram illustrates the key steps in mass cytometry analysis, from sample preparation to data interpretation, particularly in the context of stem cell research:
Sensitivity Solutions for High-Parameter Panels
Advancements in Mass Cytometry Sensitivity
A 2025 study addressed mass cytometry's inherent sensitivity limitations by developing Amplification by Cyclic Extension (ACE), a novel signal amplification technology [74]. ACE implements thermal-cycling-based DNA concatenation with CNVK photocrosslinking to stabilize amplification products during cell vaporization. This approach enabled:
- 500-fold signal amplification while maintaining specificity
- Simultaneous amplification on >30 protein epitopes
- Detection of low-abundance targets like transcription factors and signaling phosphoproteins
- Application to both suspension mass cytometry and imaging mass cytometry
Experimental Protocol: Antibodies conjugated to short DNA initiators were used to stain cells. Through repeated thermal cycling with Bst polymerase, initiators were extended to create hundreds of DNA repeats. Metal-conjugated detectors were then hybridized to these repeats and crosslinked using UV-activated CNVK chemistry before mass cytometry analysis [74].
Spectral Flow Cytometry Sensitivity Enhancements
Spectral platforms address sensitivity challenges through:
- Autofluorescence Extraction: Computational removal of cellular autofluorescence using reference spectra [17]
- Improved Detectors: Higher sensitivity photodetectors capturing the entire emission spectrum [73]
- Fluorophore Development: New dyes with narrow emission spectra optimized for spectral unmixing [72]
Table 2: Research Reagent Solutions for High-Parameter Cytometry
| Reagent Type | Specific Examples | Function in Experiment |
|---|---|---|
| Metal-Labeled Antibodies | Lanthanide-tagged antibodies (Cd, Nd, Sm) | Target protein detection in mass cytometry with minimal spectral overlap [44] |
| DNA Barcoding Systems | Palladium-tagged barcoding reagents | Sample multiplexing to reduce staining variability and increase throughput [23] |
| Signal Amplification Reagents | ACE initiators and extenders | Signal enhancement for low-abundance targets in mass cytometry [74] |
| Viability Indicators | Cisplatin-based viability staining | Dead cell exclusion in fixed samples for both technologies [10] |
| Reference Controls | Normalization beads (La, Pr, Tb, Tm, Lu) | Instrument performance standardization across runs [10] |
Decision Framework: When to Choose 40+ Parameter Approaches
Choose Mass Cytometry When:
- Primary Need is Maximum Multiplexing: Your research question requires simultaneous measurement of >35 parameters on single cells [44]
- Minimal Compensation is Critical: Signal overlap would unacceptably compromise data interpretation in conventional fluorescence detection [23]
- Sample is Not Volume-Limited: You have sufficient cells to accommodate mass cytometry's lower acquisition rates (~1,000 cells/second) [44]
- Live Cell Analysis is Not Required: Cells can be fixed without compromising the biological question [23]
- Complex Cellular Hierarchies: Investigating stem cell differentiation trajectories or immune cell development requiring high-dimensional clustering [5]
Choose Spectral Flow Cytometry When:
- High Sensitivity is Priority: Detection of low-abundance targets is more critical than maximum parameter count [17]
- Live Cell Analysis is Required: Downstream functional assays or cell sorting is needed [75]
- Faster Throughput is Needed: Large sample numbers require acquisition rates of tens of thousands of cells/second [72]
- Clinical Translation is Goal: Familiar workflow and faster implementation in diagnostic settings is advantageous [17]
- Moderate Multiplexing Suffices: 20-30 parameters adequately address the biological question [73]
Hybrid Approach:
For comprehensive studies, consider sequential analysis: using mass cytometry for deep phenotyping followed by spectral cytometry for functional validation of identified populations. This leverages the respective strengths of each technology while mitigating their limitations.
The choice between expanding panel size and maintaining detection sensitivity represents a fundamental experimental design consideration in single-cell analysis. Mass cytometry currently provides the most robust solution for true 40+ parameter experiments with minimal compensation needs, making it ideal for mapping complex cellular landscapes in stem cell biology and immunology. Spectral flow cytometry offers a compelling alternative when higher sensitivity, live cell analysis, or clinical translation are priorities, with a practical multiplexing ceiling that continues to increase with technological improvements.
Emerging solutions like ACE amplification for mass cytometry and advanced unmixing algorithms for spectral cytometry are progressively easing the panel size versus sensitivity trade-off. Researchers should select their technology platform through careful consideration of their specific biological question, sample characteristics, and analytical requirements rather than defaulting to a single methodological approach.
For researchers in stem cell biology and drug development, choosing between spectral flow cytometry (SFC) and mass cytometry (MC) requires a careful balance of throughput, practicality, and analytical depth. This guide provides an objective comparison of these technologies to inform your experimental design.
Quantitative Comparison at a Glance
The table below summarizes the core performance metrics of each technology based on current literature and industry standards.
| Performance Feature | Spectral Flow Cytometry (SFC) | Mass Cytometry (MC / CyTOF) | References |
|---|---|---|---|
| Typical Acquisition Speed | ~10,000-20,000 cells/second | ~300-500 cells/second | [71] [20] |
| Cell Transmission Efficiency | >95% | 30%-60% | [20] |
| Post-Staining Stability | Limited (typically under 24 hours) | Exceptionally long due to stable metal tags | [11] |
| Required Cell Input | Lower; suitable for low-yield samples (e.g., biopsies) | Higher; requires 2-3 times more cells than SFC | [11] |
| Sensitivity (Molecules/Cell) | High (<40 molecules) | Lower (300-400 molecules) | [20] |
| Direct Cell Size/Complexity | Yes (FSC/SSC measurements) | No | [20] |
| Cell Sorting Capability | Yes | No | [20] |
Experimental Protocols for Technology Comparison
Direct, side-by-side comparisons of SFC and MC require a standardized experimental workflow to ensure valid results. The following protocol, adapted from published studies, outlines this process.
Protocol: A Side-by-Side Comparison of SFC and MC Using Split Samples
Objective: To compare the identification and quantification of immune cell populations, including rare subsets, from the same donor sample using SFC and MC.
Materials:
- Sample Type: Peripheral Blood Mononuclear Cells (PBMCs) from healthy donors or relevant patient cohorts.
- Staining Panel: An identical antibody panel (e.g., 30+ markers) designed for both platforms, using the same antibody clones whenever possible.
- Instrumentation: A spectral flow cytometer (e.g., Cytek Aurora) and a mass cytometer (e.g., Fluidigm/Standard BioTools CyTOF).
Methodology:
- Sample Preparation: Isolate PBMCs from fresh blood using Ficoll-Paque density gradient centrifugation. Split the sample into two aliquots for SFC and MC staining.
- Antibody Staining:
- SFC Panel: Antibodies are conjugated to fluorochromes. A viability dye is used to exclude dead cells.
- MC Panel: Antibodies are conjugated to heavy metal isotopes. A cell intercalator (e.g., Ir-191/193) is used for DNA staining and viability discrimination.
- Data Acquisition:
- SFC Acquisition: Acquire data on the spectral flow cytometer. The high speed allows for rapid collection of hundreds of thousands to millions of events.
- MC Acquisition: Acquire data on the mass cytometer. The slower acquisition speed means longer run times for an equivalent cell number.
- Data Preprocessing:
- SFC Data: Apply spectral unmixing algorithms to deconvolute the full emission spectrum of each fluorochrome.
- MC Data: Normalize data to account for signal sensitivity drift over time using bead standards.
- Data Analysis: Use high-dimensional data analysis tools, such as dimensionality reduction (t-SNE, UMAP) and automated clustering (PhenoGraph, FlowSOM), to identify cell populations in each dataset. The results are then compared for concordance.
Expected Outcomes: Studies consistently report a high correlation (Pearson’s ρ >0.98) in the relative frequencies of major and rare cell populations identified by both technologies [20] [45]. Minor discrepancies are often observed in the quantification of very rare subsets, which can be attributed to differences in sensitivity and cell recovery [71].
Operational Workflow and Practical Considerations
The day-to-day practicality of each technology is shaped by factors beyond raw acquisition speed. The following diagram maps the key decision points in their operational workflows.
Essential Research Reagent Solutions
The feasibility of panel design is heavily influenced by reagent availability. Here is a comparison of key reagent considerations.
| Reagent Component | Spectral Flow Cytometry | Mass Cytometry | Function in Experiment |
|---|---|---|---|
| Antibody Availability | Wide commercial selection from multiple vendors | Limited; primarily from a single vendor or requires custom conjugation | Binds to specific cell surface/intracellular markers for population identification |
| Viability Probe | Fluorescent dyes (e.g., Zombie, Fixable Viability Dyes) | DNA Intercalators (e.g., Iridium-191/193) | Distinguishes live cells from dead cells to improve data quality |
| Customization | Directly conjugate in-house or commercially to a wide range of fluorochromes | Requires in-house capability for custom metal tagging | Enables panel design flexibility for novel targets or specific clones |
| Barcoding Reagents | Fluorophore-conjugated antibodies (e.g., CD45, Pacific Orange) | Palladium-based metal tags | Allows sample multiplexing to reduce staining variability and batch effects |
The choice between spectral flow and mass cytometry is not about which technology is superior, but which is optimal for a given research context.
- Choose Spectral Flow Cytometry when your work requires high-throughput analysis, cell sorting, working with limited cell samples (like core biopsies or rare stem cell populations), or when you need the flexibility of a wide range of commercially available reagents.
- Choose Mass Cytometry when your primary need is for the deepest possible parameterization (>40 markers) with minimal signal overlap, and your experimental timeline can accommodate slower acquisition speeds and more complex, custom reagent preparation.
For stem cell research, this means SFC is often more practical for high-throughput screening, functional assays requiring sorting, or studies with precious primary cell samples. MC excels in discovery-phase research, such as deeply characterizing novel stem cell populations or complex cellular responses to drugs in development, where maximizing data per cell is the critical goal.
Single-cell technologies have revolutionized resolution for studying biological systems, moving beyond the limitations of bulk analysis that mask critical cell-cell heterogeneity [10]. Among these, single-cell RNA sequencing (scRNA-seq) has emerged as a powerful tool for profiling transcriptomes, enabling cell-type identification, trajectory inference, and gene regulatory network reconstruction [10]. Meanwhile, cytometry by time-of-flight (CyTOF) has established itself as a high-throughput proteomic method capable of simultaneously measuring over 40 parameters on individual cells, providing deep immunophenotyping and functional characterization [76] [71]. While scRNA-seq data is often used as a proxy for studying the proteome, the relationship between individual protein expression and corresponding mRNA is frequently tenuous due to biological factors like post-transcriptional regulation and technical biases such as dropout in scRNA-seq [10]. Therefore, integrating these complementary data modalities—scRNA-seq measuring a large number of genomic features and CyTOF providing targeted protein quantification—offers a more comprehensive approach to understanding cellular functions and heterogeneity, particularly in stem cell and immunology research [10] [77].
Technical Comparison of scRNA-seq and CyTOF Platforms
scRNA-seq and CyTOF offer distinct advantages and limitations, making them complementary rather than competing technologies. Understanding their fundamental technical differences is crucial for designing integrated experimental workflows.
Table 1: Technical Comparison of scRNA-seq and CyTOF Platforms
| Feature | scRNA-seq | Mass Cytometry (CyTOF) |
|---|---|---|
| Molecule Measured | RNA transcripts (whole transcriptome or targeted) [10] | Proteins (cell surface and intracellular) [76] |
| Detection Principle | High-throughput sequencing of amplified cDNA [78] | Time-of-flight mass spectrometry of metal-tagged antibodies [71] |
| Multiplexing Capacity | Thousands of genes simultaneously [10] | 40-50+ protein markers simultaneously [71] |
| Throughput (Cells) | Thousands to hundreds of thousands [10] | Millions [71] |
| Measurement Sensitivity | High sensitivity for RNA, but suffers from "dropout" issues [10] | Lower sensitivity; requires ~400-500 molecules/cell for detection [71] |
| Key Strengths | Discovery-driven, unbiased profiling; identifies novel cell states; detects spliced/unspliced RNAs [10] | High-dimensional protein data at high cell throughput; excellent for rare population analysis [76] [71] |
| Key Limitations | Indirect protein inference; high technical noise and dropouts [10] | Limited to pre-defined antibody panels; destroys cellular RNA [71] |
| Cell Throughput Speed | ~20,000 events/second (post-processing) [71] | ~300-500 events/second [71] |
The correlation between transcriptomic and proteomic measurements is imprecise, necessitating datasets that probe their concordance to refine biological conclusions [10]. While scRNA-seq provides genomic-scale readout, CyTOF delivers direct quantification of functionally relevant proteins, making their integration highly enticing for a holistic view of cellular state [10].
Experimental Protocols for Parallel Data Generation
Generating high-quality, comparable data from both platforms requires a meticulous split-sample experimental design. The following protocol, adapted from published studies on human peripheral blood mononuclear cells (PBMCs) and Crohn's disease research, ensures minimal technical variation for subsequent integration [10] [76].
Sample Preparation and Staining for scRNA-seq
- Cell Allocation and Recovery: Thaw or isolate cells (e.g., PBMCs) and incubate in culture medium (e.g., RPMI 1640 with 5% FBS) at 37°C for 1 hour to allow recovery to a ground state. Allocate a portion of cells (e.g., 3×10^5) for scRNA-seq [10].
- Cell Processing: Strain and wash the allocated cells with PBS containing 0.4% BSA. Adjust cell concentration to approximately 500 cells/μL [10].
- Library Preparation: Proceed with the standard 10x Genomics single-cell sequencing protocol, which includes cell barcoding, reverse transcription, cDNA amplification, and library construction [10].
Sample Preparation and Staining for CyTOF
- Cell Allocation: Allocate a separate portion of the cell sample (e.g., ~7.5×10^6 cells) for CyTOF and divide evenly if multiple staining conditions are needed [10].
- Viability Staining: Incubate cells with cisplatin (10 µM in PBS) to label non-viable cells, then quench with cell staining medium (CSM; 0.5% BSA, 0.02% NaN3 in PBS) [10].
- Surface Staining: Strain cells and resuspend in an antibody cocktail of metal-conjugated antibodies targeting surface markers. Incubate, then wash with CSM [10].
- Fixation and Permeabilization: Fix cells at room temperature for 10 minutes in 1.6% paraformaldehyde. For intracellular staining, permeabilize cells with ice-cold methanol for 10 minutes [10].
- Intracellular Staining: For intracellular targets (e.g., cytokines, transcription factors), stain with a metal-conjugated antibody cocktail against intracellular markers. Wash and resuspend in CSM [10].
- DNA Staining and Acquisition: Incubate cells with an Iridium intercalator overnight at 4°C to stain DNA. Immediately before acquisition on the CyTOF instrument, add normalization beads and filter the sample through a 40-micron filter. Acquire data at a rate of ~250-500 cells per second [10].
- Figure 1: Experimental workflow for parallel scRNA-seq and CyTOF analysis of a split sample, ensuring matched biological conditions for robust data integration.
Key Research Reagent Solutions
Table 2: Essential Reagents for scRNA-seq and CyTOF Integration
| Reagent / Solution | Function | Example |
|---|---|---|
| Viability Stains | Distinguishes live from dead cells to ensure data quality. | Cisplatin for CyTOF [10] |
| Metal-conjugated Antibodies | Detection of specific protein epitopes in CyTOF. | In-house conjugated or commercial MaxPar antibodies [71] |
| Cell Staining Medium (CSM) | Buffer for antibody dilution and cell washing in CyTOF. | PBS with 0.5% BSA and 0.02% NaN₃ [10] |
| Fixation/Permeabilization Reagents | Preserves cells and allows access to intracellular targets. | Paraformaldehyde (fixative) and Methanol (permeabilization) [10] |
| Nucleic Acid Intercalator | Labels DNA for cell identification and discrimination in CyTOF. | Iridium intercalator [10] |
| Single Cell Barcoding Kits | Labels individual cells for transcriptome sequencing. | 10x Genomics Single Cell 3' Reagent Kits [10] |
| Normalization Beads | Corrects for signal intensity fluctuation during CyTOF run. | EQ Four Element Calibration Beads [10] |
Quantitative Correlation Between Transcriptomic and Proteomic Data
Direct comparisons of scRNA-seq and CyTOF data from the same sample reveal a complex and often discordant relationship between mRNA and protein abundance, underscoring the necessity of multi-modal measurement.
Table 3: Summary of mRNA-Protein Correlation Findings from Integrated Studies
| Study Context | Overall Correlation | Cell-Type Specific Variations | Key Findings |
|---|---|---|---|
| Human PBMCs [10] | Generally strong for major populations, but imprecise for individual genes. | T-lymphocytes correlated well; macrophage subtypes showed poorer correlation [79]. | Cell populations were well correlated between platforms, but differences emerged at the sub-population level [79]. |
| Bronchoalveolar Lavage (BAL) Cells [79] | Gene and protein levels were "significantly correlated" (p < 0.01). | Not specified in the abstract. | Recommended CyTOF as a tool to validate scRNA-seq data for select proteins and cell populations [79]. |
| Innate Myeloid Cells (IMC) [71] | Staining resolution of markers showed a Pearson’s ρ of 0.55. | Addressed IMC heterogeneity but did not specify correlation by type. | Highlighted the challenge of detecting low-abundant proteins with CyTOF (~400-500 molecules/cell needed) [71]. |
A benchmark study evaluating methods for imputing surface protein from scRNA-seq data further contextualizes this relationship. The study, which tested twelve imputation methods, found that while prediction is possible, performance varies significantly across datasets and cell types, reinforcing the inherent challenges posed by biological and technical factors [77].
Computational Strategies for Data Integration
The integration of scRNA-seq and CyTOF data leverages computational methods to bridge the modality gap. These approaches can be broadly categorized, with benchmark studies providing guidance on tool selection.
Table 4: Categories of Computational Integration Methods
| Integration Approach | Underlying Principle | Example Tools/Methods |
|---|---|---|
| Nearest Neighbor-Based | Identifies mutual nearest neighbors between datasets in a shared low-dimensional space and transfers protein data. | Seurat v3 (CCA & PCA), Seurat v4 (CCA & PCA) [77] |
| Deep Learning (Mapping) | Employs deep neural networks to directly learn a mapping function from transcriptomic to proteomic data. | cTP-net, sciPENN, scMOG, scMoGNN [77] |
| Deep Learning (Latent Representation) | Uses an encoder-decoder framework to learn a joint latent representation from which proteomic data can be decoded. | TotalVI, Babel, moETM, scMM [77] |
A comprehensive benchmark of twelve state-of-the-art imputation methods across eleven datasets and six scenarios offers critical insights for practitioners. The study evaluated methods on accuracy, robustness, and usability, finding that Seurat v4 (PCA) and Seurat v3 (PCA) demonstrated exceptional performance, showing superior accuracy and robustness across diverse experiments and relative insensitivity to training data size [77]. These methods are also highly efficient in memory usage and widely popular. However, they exhibited longer running times compared to some deep-learning-based methods, a consideration for large-scale projects [77].
- Figure 2: Logical relationships between data modalities, computational integration methods, and key downstream applications for integrated scRNA-seq and CyTOF data.
Integrating proteomic (CyTOF) and transcriptomic (scRNA-seq) data provides a powerful, multi-layered view of cellular identity and function that neither modality can achieve in isolation. Quantitative comparisons reveal a significant but imperfect correlation between mRNA and protein, which varies by cell type and gene, underscoring the non-trivial nature of this relationship [10] [79]. The choice between technologies is not a matter of identifying a superior platform but of strategic selection based on research goals: scRNA-seq for discovery-driven, unbiased transcriptome-wide profiling, and CyTOF for targeted, high-throughput validation and deep phenotyping of predefined protein markers [71] [45].
The future of this integrative field lies in refining computational methods and standardizing experimental workflows. As benchmark studies show, methods like Seurat v4 provide robust frameworks for integration, but challenges remain in managing scalability and improving the accuracy of cross-modal predictions [77]. For researchers in stem cell biology and drug development, adopting a multi-omics approach that includes both CyTOF and scRNA-seq will be crucial for uncovering novel biomarkers, understanding complex cellular transitions, and ultimately advancing therapeutic strategies.
This guide provides an objective comparison of two advanced single-cell analysis platforms—spectral flow cytometry and mass cytometry (CyTOF)—to help researchers and drug development professionals select the optimal technology for their specific experimental goals, particularly within stem cell and immunology research.
Platform Comparison at a Glance
The table below summarizes the core technical and practical differences between spectral flow cytometry and mass cytometry to guide initial platform selection.
| Key Consideration | Spectral Flow Cytometry | Mass Cytometry (CyTOF) |
|---|---|---|
| Cell Input Requirements | Lower cell input; suitable for low-yield samples (e.g., TILs, biopsies) [11] | Requires 2-3 times higher cell input; higher cell loss during acquisition [11] |
| Panel Size & Complexity | Handles large panels (40+ markers); excels with smaller panels (12-20 colors) for lowly expressed markers [11] | Large panels (40+ markers) with minimal channel crosstalk [11] |
| Throughput & Acquisition Speed | Higher acquisition throughput (comparable to conventional flow cytometry) [11] | Slower acquisition rates (300-500 cells/second) [80] |
| Post-Stain Stability | Limited stability (typically under 24 hours) [11] | High long-term stability due to stable metal isotopes [11] |
| Reagent Availability & Customization | Wide selection of fluorochrome-bound antibodies; flexible customization [11] | Limited commercial reagents; often requires in-house custom conjugation [11] |
| Data Stability | Stable MFI measurement for quantitative analysis [11] | Exceptionally long post-stain stability [11] |
Experimental Protocols for Platform Evaluation
Protocol for Comparative Platform Assessment
A standardized methodology for directly comparing platform performance, adapted from a published 33-color panel study [45].
- Panel Design: Utilize an identical antibody panel (e.g., 33-color) targeting major immune cell lineages and activation states. Match antibody clones across platforms where possible.
- Sample Preparation: Use split samples from the same donor source (e.g., PBMCs from healthy donors or stem cell-derived immune cell cultures). Stain cells following established protocols for each platform [45].
- Data Acquisition: Acquire data on both platforms using standardized instrument settings. For mass cytometry, acquire at a rate of 300-500 cells/second [80].
- Data Analysis: Analyze data using both manual gating and automated clustering approaches (e.g., the UNITO framework) [25]. Compare the quantification and cluster assignment of major and rare cell populations between platforms and methods.
Protocol for Analysis of Low-Availability Stem Cell Samples
A tailored workflow for projects with limited cell numbers, such as those involving stem cell derivatives or patient biopsies [11].
- Sample Fixation: For frozen specimens, fix cells soon after collection (ideally within two hours) to prevent granulocyte degranulation and epitope alteration. Avoid over-fixation to ensure complete hemolysis upon thawing [11].
- Cell Staining and Acquisition: Prioritize spectral flow cytometry for its lower cell input requirements. To maximize event collection from low-yield samples, avoid overly complex panel designs that may not be necessary for the clinical objective [11].
- Data Quality Control: Implement automated quality control software (e.g., PeacoQC) for initial pre-gating to remove debris and technical artifacts, ensuring a robust analysis even with limited events [25].
Workflow for Cytometry Platform Selection
This diagram outlines the key decision points for selecting between spectral flow cytometry and mass cytometry based on experimental goals.
The Scientist's Toolkit: Essential Reagent Solutions
This table details key reagents and materials critical for successful experimental design and execution in both cytometry platforms.
| Item | Function | Application Notes |
|---|---|---|
| Heavy Metal-tagged Antibodies | Target protein detection in mass cytometry. Minimal spillover between metal channels [80]. | Often require custom conjugation; stable for long-term storage and batch production [80]. |
| Fluorochrome-conjugated Antibodies | Target protein detection in flow cytometry. Wide commercial availability [11]. | Enables flexible panel design; requires careful spectral overlap compensation [11]. |
| DNA Intercalators (e.g., Cisplatin) | Cell viability staining and DNA content detection. Critical for identifying nucleated cells in mass cytometry [80]. | Replaces light scatter parameters from conventional flow cytometry [80]. |
| Cell Barcoding Reagents | Labels individual samples with unique metal or fluorescent tags for multiplexing. | Reduces technical variability and acquisition time; allows pooling of up to 126 samples in CyTOF [80]. |
| Stem Cell Differentiation Kits | Generates specific cell lineages from pluripotent stem cells for disease modeling [81]. | Quality control via flow cytometry is essential to verify target cell morphology and marker expression [81]. |
| Validation Antibody Panels | Benchmarks stem cell models against native tissue using immunophenotyping [81]. | Uses correlated markers assessed via flow cytometry or immunocytochemistry; avoids reliance on single markers [81]. |
Conclusion
Both flow cytometry and mass cytometry are indispensable, yet complementary, tools in the modern stem cell researcher's arsenal. The choice between them is not a matter of superiority but of strategic alignment with experimental objectives. Flow cytometry, especially in its spectral form, offers high throughput, live-cell sorting, and accessibility for focused panels. Mass cytometry provides unparalleled parameter depth for discovering novel cell states within complex populations, as evidenced by its power in deconstructing reprogramming trajectories. Future directions will involve tighter integration of these proteomic technologies with single-cell transcriptomics and spatial biology, alongside advances in automated data analysis and AI, ultimately leading to a more holistic and functional understanding of stem cell biology in health and disease.
References
- 1. Spectral Flow Cytometry: The Current State and Future of ... [https://pmc.ncbi.nlm.nih.gov/articles/PMC12193525/]
- 2. Mass Cytometry - Single Cell Proteomics [https://www.standardbio.com/resources/learning-centers/what-is-mass-cytometry]
- 3. Recent Developments (After 2020) in Flow Cytometry ... [https://pmc.ncbi.nlm.nih.gov/articles/PMC11940362/]
- 4. Performance of spectral flow cytometry and mass ... [https://www.frontiersin.org/journals/immunology/articles/10.3389/fimmu.2023.1191992/full]
- 5. Mass cytometry–based single-cell analysis of human stem ... [https://pmc.ncbi.nlm.nih.gov/articles/PMC6901311/]
- 6. Application of mass cytometry to characterize ... [https://www.sciencedirect.com/science/article/pii/S2531137923026007]
- 7. Key steps and methods in the experimental design and ... [https://www.sciencedirect.com/science/article/pii/S2001037019303848]
- 8. Automated descriptive cell type naming in flow and mass ... [https://www.nature.com/articles/s41598-025-12153-w]
- 9. Twenty years' development and application of flow cytometry [https://link.springer.com/article/10.1007/s12519-025-00949-9]
- 10. Direct comparison of mass cytometry and single-cell RNA ... [https://www.nature.com/articles/s41597-024-03399-6]
- 11. Spectral Flow and Mass Cytometry: Select the Right Platform [https://cellcarta.com/science-hub/spectral-flow-and-mass-cytometry/]
- 12. Review Technologic advances in flow cytometry [https://www.sciencedirect.com/science/article/abs/pii/S0009898125004462]
- 13. Mass Cytometry Future-proof Strategies: Trends, ... [https://www.datainsightsmarket.com/reports/mass-cytometry-611579]
- 14. Imaging flow cytometry: from high - resolution ... [https://www.frontiersin.org/journals/bioengineering-and-biotechnology/articles/10.3389/fbioe.2025.1580749/full]
- 15. Flow Cytometry Applications: Advanced Uses, Benefits ... [https://cellcarta.com/science-hub/flow-cytometry-applications-advanced-uses-benefits-and-limitations/]
- 16. cytoGPNet: Enhancing clinical outcome prediction ... [https://pmc.ncbi.nlm.nih.gov/articles/PMC12485536/]
- 17. Beyond the Limits: How Is Spectral Flow Cytometry ... [https://pmc.ncbi.nlm.nih.gov/articles/PMC12248732/]
- 18. Spectral Flow Cytometry: Understanding Its Advantages [https://kcasbio.com/blogs/spectral-flow-understanding-the-advantages/]
- 19. Unlocking the Power of Spectral Flow: High Parameter ... [https://oncology.labcorp.com/unlocking-power-spectral-flow-high-parameter-immunophenotypic-analysis-preclinical-and-clinical]
- 20. Full spectrum flow cytometry and mass ... [https://pmc.ncbi.nlm.nih.gov/articles/PMC9790709/]
- 21. Comparative analysis of dimension reduction methods for ... [https://www.nature.com/articles/s41467-023-37478-w]
- 22. Beyond the Limits: How Is Spectral Flow Cytometry ... [https://www.mdpi.com/2073-4409/14/13/997]
- 23. Mass Cytometry: A Highly Multiplexed Single-Cell ... [https://www.sciencedirect.com/science/article/abs/pii/S0090955624103418]
- 24. Metal Isotope-Tagged Nanomaterials for Mass Cytometry ... [https://www.sciopen.com/article/10.26599/NBE.2025.9290130]
- 25. Automated cytometric gating with human-level ... [https://www.nature.com/articles/s41467-025-56622-2]
- 26. Artificial intelligence and systems biology analysis in stem cell ... [https://pmc.ncbi.nlm.nih.gov/articles/PMC12476622/]
- 27. How Flow Cytometry Technology at the Stem Cell ... [https://stemcellmedicalcenter.com/treatments/how-flow-cytometry-technology-at-the-stem-cell-medical-center-benefits-patients/]
- 28. Flow cytometry: Shining a light on new therapeutics [https://www.ddw-online.com/flow-cytometry-shining-a-light-on-new-therapeutics-32158-202410/]
- 29. Top Factor Driving Cell Cytometry Market Growth in 2025 [https://www.openpr.com/news/3872993/top-factor-driving-cell-cytometry-market-growth-in-2025-growing]
- 30. Imaging flow cytometry: from high - resolution morphological ... [https://pmc.ncbi.nlm.nih.gov/articles/PMC12098090/]
- 31. Flow Cytometry Market Analysis and Forecast, 2025-2035 [https://finance.yahoo.com/news/flow-cytometry-market-analysis-forecast-151100522.html]
- 32. Flow Cytometry Market Growth, Drivers, and Opportunities [https://www.marketsandmarkets.com/Market-Reports/flow-cytometry-market-65374584.html]
- 33. Hematology Analyzer Market Size & Opportunities, 2025- ... [https://www.coherentmarketinsights.com/industry-reports/hematology-analyzer-market]
- 34. A deep single cell mass cytometry approach to capture ... [https://www.nature.com/articles/s41467-025-63883-4]
- 35. A primer for Mass Cytometry Imaging data analysis [https://www.sciencedirect.com/science/article/abs/pii/S0165993622002771]
- 36. High-dimensional immune phenotyping and transcriptional ... [https://pmc.ncbi.nlm.nih.gov/articles/PMC6512331/]
- 37. Full spectrum flow cytometry and mass ... [https://pubmed.ncbi.nlm.nih.gov/35593221/]
- 38. A robust pipeline for high-content, high-throughput ... [https://www.sciencedirect.com/science/article/pii/S2667237523002837]
- 39. Immunophenotyping of Live Human Pluripotent Stem Cells ... [https://pmc.ncbi.nlm.nih.gov/articles/PMC5903271/]
- 40. : methods, mechanisms and applications Cell reprogramming [https://cellregeneration.springeropen.com/articles/10.1186/s13619-025-00229-x]
- 41. Flow Cytometry: A Tool for New Approach Methodologies [https://www.criver.com/eureka/flow-cytometry-tool-new-approach-methodologies]
- 42. Multi-omic rejuvenation of human cells by maturation phase transient... [https://elifesciences.org/articles/71624]
- 43. Ensure Consistent Flow Cytometry & Optimize Clinical Trials [https://cellcarta.com/science-hub/consistent-flow-cytometry-readouts/]
- 44. Mass Cytometry: Single Cells, Many Features - PMC [https://pmc.ncbi.nlm.nih.gov/articles/PMC4860251/]
- 45. Comparative assessment of cytometry by time-of-flight and ... [https://www.sciencedirect.com/science/article/pii/S0022175924000267]
- 46. Flow Cytometry Analysis of Mesenchymal Stem Cells [https://pubmed.ncbi.nlm.nih.gov/40438705/]
- 47. Application of mass cytometry to characterize hematopoietic ... [https://www.htct.com.br/en-application-mass-cytometry-characterize-hematopoietic-articulo-S2531137923026007]
- 48. Mass cytometry: a highly multiplexed single-cell technology ... [https://pubmed.ncbi.nlm.nih.gov/25349123/]
- 49. Impact of recent innovations in the use of mass cytometry in ... [https://pmc.ncbi.nlm.nih.gov/articles/PMC4668584/]
- 50. analysis of dimension reduction methods for Comparative ... cytometry [https://www.nature.com/articles/s41467-023-37478-w?error=cookies_not_supported&code=387a5c9d-6dc3-4496-aa11-02a334f050a9]
- 51. Single-cell mass cytometry reveals cell type - RSC Publishing [https://pubs.rsc.org/en/content/articlehtml/2025/en/d5en00439j]
- 52. of clustering methods for high-dimensional single-cell... Comparison [https://pubmed.ncbi.nlm.nih.gov/27992111/]
- 53. A comparison framework and guideline of clustering methods for... [https://genomebiology.biomedcentral.com/articles/10.1186/s13059-019-1917-7]
- 54. Market Size, Growth Projections And Insights... Flow Cytometry [https://www.vantagemarketresearch.com/industry-report/flow-cytometry-market-2319]
- 55. Validation of CyTOF Against Flow Cytometry for ... [https://pmc.ncbi.nlm.nih.gov/articles/PMC6534060/]
- 56. Multiparameter Phenotyping of Human PBMCs Using Mass ... [https://pmc.ncbi.nlm.nih.gov/articles/PMC4748856/]
- 57. Frontiers | CyTOF® for the Masses [https://www.frontiersin.org/journals/immunology/articles/10.3389/fimmu.2022.815828/full]
- 58. Mass cytometry immunostaining protocol for multiplexing ... [https://pmc.ncbi.nlm.nih.gov/articles/PMC9424627/]
- 59. Protocol for large scale whole blood immune monitoring by ... [https://www.sciencedirect.com/science/article/pii/S2666166722005779]
- 60. Top Reagent Consumables For Flow Cytometry ... [https://www.linkedin.com/pulse/top-reagent-consumables-flow-cytometry-companies-bymte/]
- 61. Progress and applications of mass cytometry in sketching ... [https://pmc.ncbi.nlm.nih.gov/articles/PMC7556381/]
- 62. Comparison of three machine learning algorithms for ... [https://pmc.ncbi.nlm.nih.gov/articles/PMC11286351/]
- 63. Recent Advances in Computer-Assisted Algorithms for Cell ... [https://www.frontiersin.org/journals/cell-and-developmental-biology/articles/10.3389/fcell.2020.00234/full]
- 64. SPADE: Spanning Tree Progression of Density Normalized ... [https://github.com/nolanlab/spade]
- 65. A Comparison for Dimensionality Reduction Methods of ... [https://pmc.ncbi.nlm.nih.gov/articles/PMC8021860/]
- 66. Research Solutions for High-Dimensional Biology [https://www.bdbiosciences.com/en-us/learn/campaigns/total-research-solutions/research-solutions-for-high-dimensional-biology]
- 67. cytoGPNet: Enhancing clinical outcome prediction ... [https://www.sciencedirect.com/science/article/pii/S266638992500145X]
- 68. High-dimensional data analysis algorithms yield comparable ... [https://pmc.ncbi.nlm.nih.gov/articles/PMC7682594/]
- 69. HDCytoData: Collection of high-dimensional cytometry ... [https://pmc.ncbi.nlm.nih.gov/articles/PMC6904983/]
- 70. ImmCellTyper facilitates systematic mass cytometry data ... [https://elifesciences.org/articles/95494]
- 71. Performance of spectral flow cytometry and ... - PubMed Central [https://pmc.ncbi.nlm.nih.gov/articles/PMC10235610/]
- 72. 5 Reasons to Try Spectral for Both Low and High ... [https://www.thermofisher.com/blog/life-in-the-lab/5-reasons-to-try-spectral-for-both-low-and-high-parameter-flow-cytometry/]
- 73. Spectral flow cytometry: Fundamentals and future impact [https://www.sciencedirect.com/science/article/abs/pii/S0091679X24000530]
- 74. Signal amplification by cyclic extension enables high ... [https://www.nature.com/articles/s41587-024-02316-x]
- 75. Applications of Flow Cytometry in Drug Discovery and ... [https://pmc.ncbi.nlm.nih.gov/articles/PMC11011675/]
- 76. Mass cytometry and single-cell RNA sequencing reveal ... [https://pmc.ncbi.nlm.nih.gov/articles/PMC9878392/]
- 77. Benchmarking single-cell cross-omics imputation methods for ... [https://genomebiology.biomedcentral.com/articles/10.1186/s13059-025-03514-9]
- 78. Integrated Analysis of Transcriptomic and Proteomic Data - PMC [https://pmc.ncbi.nlm.nih.gov/articles/PMC3637682/]
- 79. Integration of mass cytometry and single-cell RNA ... [https://pubmed.ncbi.nlm.nih.gov/40384395/]
- 80. CyTOF as a suitable tool for stratification and monitoring of ... [https://pmc.ncbi.nlm.nih.gov/articles/PMC12220477/]
- 81. Section 4: Stem -based Model Systems — International Society for... Cell [https://www.isscr.org/basic-research-standards/stem-cell-based-model-systems]