Flow Cytometry Authentication of Stem Cell Lines: A Complete Guide to Standards, Protocols, and Troubleshooting
This article provides a comprehensive guide for researchers and drug development professionals on utilizing flow cytometry for the rigorous authentication of stem cell lines.
Flow Cytometry Authentication of Stem Cell Lines: A Complete Guide to Standards, Protocols, and Troubleshooting
Abstract
This article provides a comprehensive guide for researchers and drug development professionals on utilizing flow cytometry for the rigorous authentication of stem cell lines. It covers foundational ethical principles and international standards set by organizations like the ISSCR, detailed methodological protocols for assessing pluripotency and lineage-specific markers, advanced troubleshooting for common experimental pitfalls, and robust validation strategies to ensure data reproducibility. By integrating foundational knowledge with practical application, this resource aims to enhance the reliability, standardization, and translational potential of stem cell research.
Why Authenticate? The Critical Role of Flow Cytometry in Stem Cell Research Integrity
Stem cell research represents a frontier of modern biological science, offering unprecedented potential for regenerative medicine, disease modeling, and drug discovery. However, this promise hinges on a critical foundation: the ability to rigorously authenticate stem cell lines. Authentication encompasses the definitive assessment of three interdependent pillars—purity, pluripotency, and cellular identity. Without this verification, experimental results become unreliable, and translational applications carry significant risk. Flow cytometry has emerged as an indispensable tool in this authentication process, providing rapid, quantitative, and multi-parameter analysis at the single-cell level. This guide examines how flow cytometry-based methodologies compare with alternative techniques, providing researchers with a data-driven framework for validating their most critical cellular reagents.
The Three Pillars of Stem Cell Authentication
Stem cell authentication is a multi-faceted process that confirms a cell population is what researchers believe it to be. This process rests on three core pillars:
- Purity: The proportion of target cells within a heterogeneous population, ensuring that observed effects are attributable to the stem cells themselves and not contaminating cell types [1].
- Pluripotency: The definitive capacity of a stem cell to differentiate into all derivatives of the three primary germ layers (endoderm, ectoderm, and mesoderm) [2].
- Identity: The verification of a specific cell type through the expression of characteristic surface and intracellular markers, confirming lineage and developmental stage [2] [3].
Flow Cytometry: The Gold Standard for Multiparametric Analysis
Flow cytometry offers a powerful platform for stem cell authentication by enabling simultaneous measurement of multiple cellular parameters. Its principle involves passing a single-cell suspension through a laser beam, where light scattering and fluorescence signals are detected and quantified [2]. This technology provides several distinct advantages for authentication:
- High-Throughput Capability: Analysis of up to 10,000 cells per second enables robust statistical assessment of heterogeneous populations [2].
- Single-Cell Resolution: Unlike bulk analysis techniques, flow cytometry can identify rare subpopulations and quantify population heterogeneity [2] [4].
- Multiparametric Analysis: Modern instruments can simultaneously detect up to 60 parameters, allowing comprehensive characterization of complex cell populations [2].
- Physical Isolation Capability: Fluorescence-activated cell sorting (FACS), a specialized form of flow cytometry, can physically isolate even rare stem cell populations from heterogeneous samples for downstream applications [2].
Key Markers for Stem Cell Authentication
The table below summarizes critical markers used for authenticating various stem cell types via flow cytometry.
Table 1: Key Authentication Markers for Different Stem Cell Types
| Stem Cell Type | Purity/Identity Markers | Pluripotency Markers | Differentiation Markers | Key References |
|---|---|---|---|---|
| Human Pluripotent Stem Cells (iPSCs/ESCs) | SSEA-4, TRA-1-60, TRA-1-81 | OCT4, SOX2, NANOG | Spontaneous differentiation assays | [2] [3] |
| Hematopoietic Stem Cells (HSCs) | CD34, CD45, CD133, Thy1 | - | CD38, CD45RA, lineage markers | [2] [1] |
| Mesenchymal Stem Cells (MSCs) | CD105, CD73, CD90 | - | Osteogenic, chondrogenic, adipogenic induction | [2] |
| Muscle Stem Cells (MuSCs) | Syndecan-1/2/4, CD34 | - | Myogenin, MyoD | [4] |
| Spermatogonial Stem Cells (hSSCs) | SSEA4, GFRA1 | (Epigenetically poised) | c-KIT, SYCP3 | [5] |
Experimental Protocol: Flow Cytometry for iPSC Pluripotency Assessment
The following optimized protocol is adapted from current methodologies for evaluating human induced pluripotent stem cells (iPSCs) [3]:
Basic Protocol: iPSC Culture and Collection for Flow Cytometry Analysis
- Culture Conditions: Maintain iPSCs in feeder-free or feeder-dependent conditions using appropriate media. For feeder-free cultures, use defined extracellular matrices such as laminin-111 or vitronectin [6].
- Cell Collection: Dissociate cells using enzyme-free dissociation reagents (e.g., Gentle Cell Dissociation Reagent) to preserve surface epitopes [7].
- Single-Cell Suspension: Accurately resuspend cells in buffer containing a ROCK inhibitor (Y-27632) to enhance single-cell survival [7].
Staining for Extracellular and Intracellular Markers
- Surface Marker Staining: Aliquot 1×10^6 cells per tube. Incubate with fluorochrome-conjugated antibodies against surface markers (SSEA-4, TRA-1-60) for 30 minutes at 2-8°C in the dark [3] [1].
- Intracellular Staining: Fix and permeabilize cells using appropriate buffers. Incubate with antibodies against intracellular transcription factors (OCT4, SOX2, NANOG) for 30-60 minutes at 2-8°C [3].
- Controls: Include fluorescence-minus-one (FMO) and isotype controls for accurate gating and background subtraction [1].
- Viability Assessment: Incorporate a viability dye (7-AAD or propidium iodide) to gate out dead cells during analysis [1].
Flow Cytometry Acquisition and Data Analysis
- Instrument Calibration: Calibrate the flow cytometer using appropriate calibration beads according to manufacturer specifications.
- Data Acquisition: Collect a minimum of 10,000-50,000 events per sample to ensure statistical relevance [1].
- Gating Strategy:
- Gate cells based on forward scatter (FSC) vs. side scatter (SSC) to exclude debris.
- Apply viability gating to exclude dead cells.
- Create fluorescence dot plots to identify positive populations for each marker.
- Use sequential gating for multi-parameter analysis [1].
- Purity Threshold: Establish minimum purity thresholds (typically >90-95% for critical markers) for authenticated lines [1].
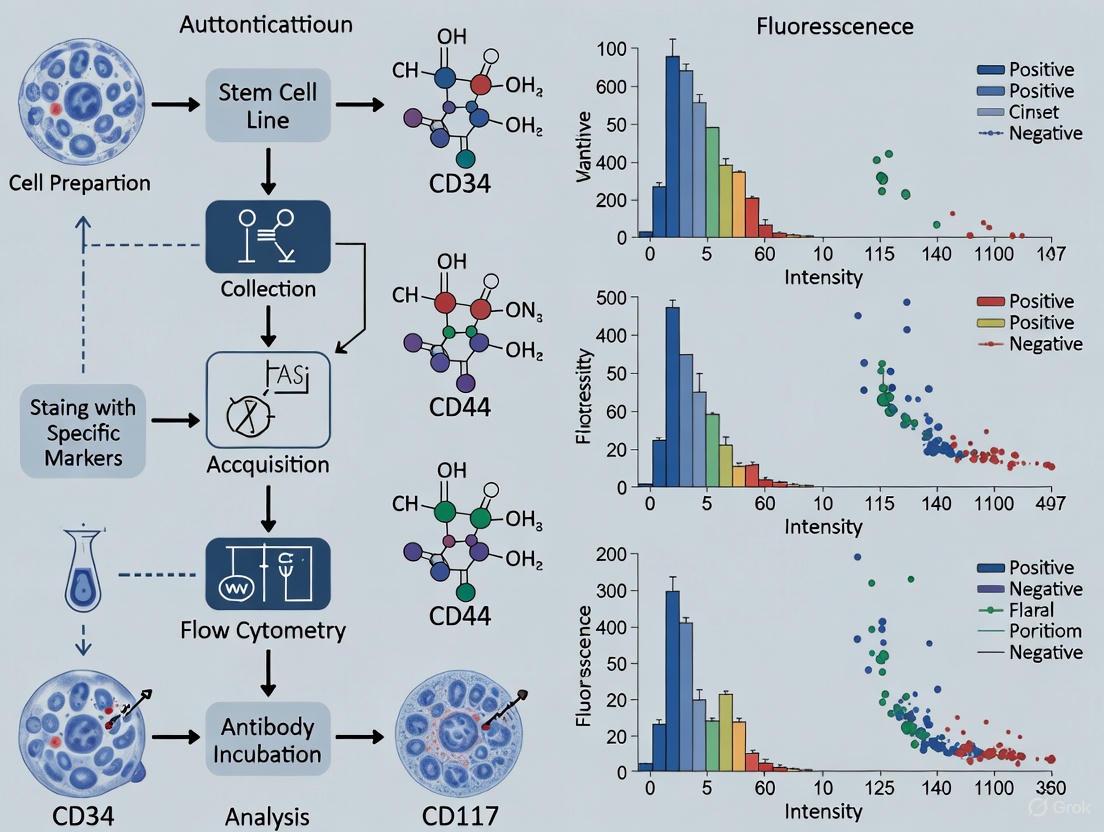
Figure 1: Experimental workflow for flow cytometry-based authentication of stem cell markers, encompassing both surface and intracellular antigen detection.
Comparative Analysis of Authentication Methods
While flow cytometry represents a powerful authentication platform, researchers should understand its performance relative to alternative methodologies. The table below provides a direct comparison of key authentication techniques.
Table 2: Method Comparison for Stem Cell Authentication
| Method | Key Strengths | Key Limitations | Best Application | Purity Data | Pluripotency Data | Identity Resolution |
|---|---|---|---|---|---|---|
| Flow Cytometry | High-throughput, quantitative, multi-parameter, single-cell resolution [2] | Requires single-cell suspension, limited spatial information | Routine quality control, isolation of rare populations | Direct quantification | Indirect (marker-based) | High (protein level) |
| Single-Cell RNA-Seq | Unbiased transcriptome-wide profiling, reveals heterogeneity [5] [4] | High cost, complex data analysis, destructive | Deep characterization, identifying novel subtypes | Computational inference | Gene expression patterns | Very High (transcript level) |
| Immunofluorescence | Provides spatial context and subcellular localization | Semi-quantitative, low-throughput, subjective | Visual confirmation, colocalization studies | Qualitative assessment | Indirect (marker-based) | Moderate (protein level) |
| Bulk RNA-Seq/Western | Cost-effective for homogeneous populations, familiar protocols | Averages population response, misses heterogeneity | Confirmatory analysis of established lines | No direct data | Gene expression/protein levels | Low (population average) |
| Functional Assays (e.g., differentiation) | Direct assessment of biological potential | Time-consuming, variable, qualitative | Ultimate pluripotency verification | No direct data | Direct functional evidence | Context-dependent |
Advanced Applications and Integrative Approaches
Single-Cell RNA-Seq Reveals Cellular Heterogeneity
While flow cytometry excels at quantifying known markers, single-cell RNA sequencing (scRNA-seq) provides an unbiased approach to dissect cellular heterogeneity within stem cell populations. For example, a study on human spermatogonial stem cells (hSSCs) using scRNA-seq identified four distinct cellular states during differentiation, revealing major transitions in cell-cycle regulators, splicing factors, and metabolic pathways [5]. Similarly, scRNA-seq of muscle stem cells (MuSCs) during regeneration identified heterogeneous subpopulations with stage-specific regulatory programs and distinct ligand-receptor interactions [4]. These findings demonstrate how scRNA-seq can complement flow cytometry by identifying novel markers and revealing hidden heterogeneity.
Authentication in Complex Model Systems: Organoids
As stem cell research advances toward more complex 3D model systems like organoids, authentication faces new challenges. Flow cytometry remains valuable for organoid analysis by enabling quantification of cellular composition after dissociation into single-cell suspensions [2]. This approach provides crucial quality control for ensuring reproducibility across organoid batches, addressing a significant challenge in the field.
Integration with Epigenetic Analysis
Comprehensive authentication increasingly extends beyond transcriptomics and protein expression to include epigenetic characterization. Studies profiling DNA methylation (DNAme) and open chromatin (ATAC-seq) in hSSCs revealed that while core pluripotency genes like OCT4 and NANOG are transcriptionally repressed, they exist in a "poised" chromatin state, reflecting their unipotent potential [5]. This epigenetic dimension adds another layer to understanding stem cell identity and potential.
Figure 2: The integrated multi-modal approach to stem cell authentication, combining different methodologies to verify the three core pillars.
The Scientist's Toolkit: Essential Research Reagents
Successful stem cell authentication requires specific reagents and materials. The following table outlines essential solutions for flow cytometry-based authentication.
Table 3: Essential Research Reagents for Stem Cell Authentication
| Reagent/Category | Specific Examples | Function in Authentication | Key Considerations |
|---|---|---|---|
| Cell Dissociation Reagents | Gentle Cell Dissociation Reagent [7] | Generation of single-cell suspensions | Preserves surface epitopes; maintains cell viability |
| Defined Culture Matrices | Laminin-111, Vitronectin, Fibronectin [6] | Provides reproducible substrate for stem cell growth | Enables feeder-free culture; reduces variability |
| Flow Cytometry Antibodies | Anti-SSEA-4, Anti-OCT4, Anti-TRA-1-60 [3] [1] | Detection of specific markers for purity and identity | Validation for specific applications; fluorochrome brightness |
| Viability Stains | Propidium Iodide, 7-AAD [1] | Exclusion of dead cells from analysis | Compatibility with fixation protocols; emission spectra |
| Inhibition Reagents | Y-27632 (ROCK inhibitor) [7] | Enhances single-cell survival after dissociation | Critical for cloning and single-cell sorting applications |
| Specialized Cultureware | 96-well round-bottom plates [8], Organoid culture plates [7] | Standardized format for assays and culture | Enables high-throughput screening; improves reproducibility |
Stem cell authentication through the verification of purity, pluripotency, and identity is not merely a quality control step but a fundamental requirement for rigorous, reproducible research. Flow cytometry stands as a cornerstone technology in this process, offering unparalleled quantitative multiparameter analysis at single-cell resolution. However, as stem cell biology advances, a comprehensive authentication strategy increasingly requires integrating flow cytometry with complementary approaches—including single-cell transcriptomics, epigenetic analysis, and functional assays. This multi-modal framework enables researchers to navigate the complexity of stem cell populations with confidence, ensuring that these powerful cellular models fulfill their transformative potential in basic research and therapeutic applications.
In the field of regenerative medicine and developmental biology, the accurate identification of stem cells is a fundamental ethical and scientific requirement. The use of misidentified or contaminated cell lines can compromise years of research, leading to irreproducible results and misguided clinical applications. Flow cytometry stands as a powerful, high-throughput technology capable of authenticating stem cell lines with single-cell resolution, thereby upholding the pillars of research integrity: rigor, reproducibility, and transparency [2]. This guide provides a objective comparison of flow cytometry technologies and detailed methodologies for their application in stem cell authentication.
Stem cells are defined by their unique capabilities for self-renewal and differentiation into specific cell types. A primary method for their identification relies on analyzing the expression of specific protein markers, which can be located on the cell surface or inside the cell [2]. While techniques like qRT-PCR and Western blotting analyze these markers in bulk, flow cytometry extends the analysis to the single-cell level. It offers a rapid, multi-parameter, and quantitative assessment of thousands of cells within seconds [2].
A critical application is the isolation of even rare populations of stem cells from a heterogeneous sample using fluorescence-activated cell sorting (FACS) [2]. Furthermore, flow cytometry is increasingly used to characterize the complex cell types within stem cell-derived organoids, providing quantitative benchmarks for these in vitro models [2]. The core principle of the technology involves passing a single-cell suspension in a fluid stream through a laser beam. The instrument then detects the light scattering properties of each cell, which provide information on cell size and granularity, as well as the fluorescence emitted from probes bound to specific cellular components [2].
Comparative Analysis of Cytometry Technologies
While conventional flow cytometry is a well-established tool, newer technologies like spectral flow cytometry and mass cytometry have emerged, each with distinct advantages and limitations for specific applications in stem cell research.
Table 1: Technology Comparison for Single-Cell Analysis
| Feature | Conventional Flow Cytometry | Spectral Flow Cytometry | Mass Cytometry (CyTOF) |
|---|---|---|---|
| Core Principle | Detects fluorescence with optical filters and photomultiplier tubes (PMTs) [9]. | Measures full emission spectrum of fluorochromes; uses unmixing algorithms [9]. | Uses metal-tagged antibodies and time-of-flight mass spectrometry [10]. |
| Multiplexing Capacity | Typically 15-20 parameters; modern instruments can detect up to 50 [2] [9]. | Similar high-parameter capacity (40-50 colors) [9]. | Ability to measure over 40 parameters simultaneously [10]. |
| Key Advantage | High-speed analysis and sorting (FACS); well-established protocols [2] [9]. | Improved fluorochrome discrimination; can quantify autofluorescence [9]. | Minimal signal overlap, allowing for highly multiplexed protein detection [10]. |
| Primary Limitation | Spectral overlap requires compensation and can limit panel design [9]. | Complex data unmixing requires specialized software and expertise [9]. | Lower analysis speed; no viable cell sorting as cells are destroyed [10]. |
| Ideal Use Case in Stem Cell Research | High-throughput sorting of live stem cells for culture or transplantation. | Precise, high-dimensional immunophenotyping of complex stem cell populations. | Deep, system-level profiling of intracellular signaling and complex phenotypes. |
Table 2: Key Surface Markers for Authenticating Human Mesenchymal Stem Cells (MSCs) vs. Fibroblasts
| Cell Type | Positive Markers (for identity) | Negative Markers (for exclusion) | Key Discriminatory Markers vs. Fibroblasts |
|---|---|---|---|
| General MSCs (ISCT Criteria) | CD105, CD73, CD90 [11]. | CD45, CD34, CD14/CD11b, CD79α/CD19, HLA-DR [11]. | N/A |
| Adipose-derived MSCs | CD105, CD73, CD90 [11]. | Standard negative markers [11]. | CD79α, CD105, CD106, CD146, CD271 [11]. |
| Bone Marrow-derived MSCs | CD105, CD73, CD90 [11]. | Standard negative markers [11]. | CD105, CD106, CD146 [11]. |
| Wharton's Jelly-derived MSCs | CD105, CD73, CD90 [11]. | Standard negative markers [11]. | CD14, CD56, CD105 [11]. |
| Placental-derived MSCs | CD105, CD73, CD90 [11]. | Standard negative markers [11]. | CD14, CD105, CD146 [11]. |
| Fibroblasts (Foreskin) | May express CD90 and CD44 [11]. | Lacks specific MSC markers [11]. | CD26 (not fibroblast-specific [11]), Lower CD106/CD146 [11]. |
Essential Experimental Protocols for Stem Cell Authentication
Sample Preparation for Flow Cytometry
A high-quality single-cell suspension is critical for reliable data.
- Adherent Cells (MSCs/Stem Cells): Cells can be removed from the culture vessel using mechanical scraping or enzymatic reagents like trypsin. It is crucial to validate that the dissociation method does not alter the detection of protein epitopes of interest. After processing, filtering the cell suspension through a nylon mesh is recommended to remove small clumps and prevent the instrument from clogging [12].
- Tissues: Dissociation of primary tissue requires mechanical mincing and/or enzymatic digestion tailored to the tissue type. The resulting cell suspension is then filtered and treated like other cell samples [12].
- Cryopreservation: For biobanking, cells can be cryopreserved. Upon thawing, cells should be rested before analysis, as viability and protein expression can be temporarily altered. Optimization of this resting period is necessary for standardized preparation [12].
Panel Design and Antibody Validation
A well-designed antibody panel is foundational for rigorous authentication.
- Identify Antigens: Begin by reviewing literature to identify the combination of surface and intracellular markers that define your stem cell population of interest. Resources like Optimized Multicolor Immunofluorescence Panels (OMIPs) are invaluable [12].
- Antigen Density and Fluorophore Brightness: Pair low-density antigens (e.g., some cytokine receptors) with bright fluorophores, and high-density antigens (e.g., CD45) with dim fluorophores to maximize resolution [12].
- Antibody Validation and Titration: Use monoclonal or recombinant antibodies to ensure specificity and improve reproducibility. Each antibody must be titrated on the target cells to determine the optimal concentration that provides the best stain index (a measure of signal-to-noise ratio), avoiding both suboptimal and supraoptimal concentrations that increase background [12] [9].
Gating Strategy and Essential Controls
A rigorous gating strategy is non-negotiable for ethical data interpretation.
- Viability Gating: Exclude dead cells, as they bind antibodies non-specifically.
- Single-Cell Gating: Select single cells based on forward scatter area vs. height to avoid analyzing cell doublets.
- Fluorescence Minus One (FMO) Controls: For proper gating of low-abundance antigens and accurately assessing spillover spreading, FMO controls are the gold standard. They contain all antibodies in the panel except one, providing a more accurate background signal than isotype controls [9].
The Scientist's Toolkit: Research Reagent Solutions
Table 3: Essential Materials for Flow Cytometry Authentication
| Reagent/Material | Function/Application | Key Considerations |
|---|---|---|
| Monoclonal/Recombinant Antibodies | Specific detection of cell surface and intracellular markers. | Prefer over polyclonal antibodies for reduced cross-reactivity; require application-specific validation [12]. |
| Viability Dye | Distinguishes live cells from dead cells during analysis. | Critical for excluding dead cells that cause nonspecific antibody binding. Must be titrated [9]. |
| Cell Dissociation Reagents | Generate single-cell suspensions from adherent cultures (e.g., trypsin, EDTA). | Must be validated to ensure target protein epitopes are not altered or destroyed [12]. |
| Fc Receptor Blocking Reagent | Blocks nonspecific antibody binding via Fc receptors on immune cells. | Reduces background staining and false positives; superior to the use of isotype controls [9]. |
| Compensation Beads | Used to create single-color controls for calculating fluorescence spillover. | Essential for setting up compensation matrices in conventional flow cytometry [9]. |
| DNA Staining Dye | Used in cell cycle analysis to determine proliferative status of stem cells. | Example: Propidium Iodide. Allows assessment of self-renewal capacity [2]. |
Advanced Considerations and Best Practices
Addressing Technical Limitations
Acknowledging and mitigating the limitations of flow cytometry is a key aspect of ethical research practice. A significant challenge is the lack of harmonization in FACS procedures across different laboratories, which can hinder reproducibility [2]. Furthermore, the requirement for a single-cell suspension means that spatial information about the cells in their native tissue context is lost [2] [9]. Adhering to standardized protocols, using shared antibody batches, and reporting methodologies in detail using guidelines like the MiFlowCyt standard are crucial steps toward transparency and reproducibility [2] [12].
The Role of Imaging Flow Cytometry
Imaging flow cytometry (IFC) merges the high-throughput capability of flow cytometry with the morphological detail of microscopy [2]. This technology can characterize cells based on morphology and the subcellular localization of signals—for instance, confirming whether a protein is localized to the nucleus, cytoplasm, or cell surface [2]. For stem cell research, IFC is particularly useful for analyzing complex models like organoids and for verifying the intracellular localization of pluripotency factors.
Flow cytometry, when applied with rigor and transparency, is more than a technical procedure; it is an ethical imperative for authenticating stem cell lines. The choice between conventional, spectral, or mass cytometry should be guided by the specific research question, whether it is high-speed sorting, deep phenotypic profiling, or system-level proteomic analysis. A commitment to robust experimental design—including careful panel design, antibody titration, the use of FMO controls, and standardized sample processing—is fundamental to generating reliable and reproducible data. By adhering to these principles, researchers can ensure the integrity of their work, building a solid foundation for advancements in basic science and the safe translation of stem cell therapies from the bench to the bedside.
In stem cell research, the quality and authenticity of cell lines are fundamental to the reliability of experimental data. The International Society for Stem Cell Research (ISSCR) has established comprehensive standards to promote rigorous characterization of human stem cells, ensuring reproducibility and ethical integrity across the global scientific community [13]. Flow cytometry, with its capacity for high-throughput, multi-parameter analysis at single-cell resolution, serves as an indispensable tool for adhering to these guidelines [2]. This guide details how flow cytometry methodologies align with ISSCR's characterization standards, providing researchers with a framework for validating their stem cell lines.
ISSCR Characterization Standards and Flow Cytometry Applications
The ISSCR's "Standards for Human Stem Cell Use in Research" outline minimum characterization and reporting criteria to enhance reproducibility [13] [14]. The table below summarizes key characterization tenets and the corresponding application of flow cytometry.
Table 1: Aligning Flow Cytometry with ISSCR Characterization Standards
| ISSCR Characterization Category | Key Requirements | Flow Cytometry Application & Measured Parameters |
|---|---|---|
| Pluripotency and the Undifferentiated State [14] | Rigorous demonstration of undifferentiated state and developmental potential. | Detection of pluripotency-associated markers (e.g., surface antigens TRA-1-60, SSEA-4; intracellular transcription factors OCT4, NANOG) [3]. |
| Basic Characterization [14] | Consistent generation and accurate characterization of starting research materials. | Assessment of cell viability, cell size (FSC), and internal complexity (SSC). Verification of species identity in co-cultures [2] [15]. |
| Stem Cell-Based Model Systems (e.g., Organoids) [14] | Confirmation of reproducibility and cellular composition of complex models. | Immunophenotyping of multiple cell types within a single organoid. Quantification of lineage-specific cells and assessment of population heterogeneity [2]. |
Detailed Flow Cytometry Protocols for Stem Cell Characterization
The following protocols are adapted from established methodologies to meet ISSCR standards for characterization [15] [3] [16]. Proper antibody validation and the use of isotype controls are critical throughout.
Protocol 1: Cell Surface Marker Staining
This protocol is designed for the detection of antigens present on the external membrane of live cells, such as the classic pluripotency markers TRA-1-60 and SSEA-4 [16].
- Harvest and Wash: Harvest cells and aliquot up to (1 \times 10^6) cells per tube. Centrifuge at 350–500 × g for 5 minutes and wash the cells three times in a cold phosphate buffer supplemented with 0.5% BSA to remove residual serum components [16].
- Fc Receptor Blocking: Resuspend the cell pellet in buffer and incubate with an Fc receptor blocking reagent (e.g., 1 μg IgG/10^6 cells) for 15 minutes at room temperature to prevent non-specific antibody binding [16].
- Antibody Staining: Without washing, add a pre-titrated amount of fluorochrome-conjugated primary antibody (e.g., 5-10 μL/10^6 cells) to the cells. Vortex gently and incubate for 30 minutes at room temperature in the dark [16].
- Washing and Resuspension: Wash the cells twice with 2 mL of flow cytometry staining buffer to remove unbound antibody. Finally, resuspend the cells in 200–400 μL of buffer for analysis on the flow cytometer [16].
Protocol 2: Intracellular Protein Staining
This method is required for detecting transcription factors like OCT4 and NANOG, or structural proteins like cardiac troponin in differentiated cardiomyocytes [15].
- Cell Fixation: Collect and wash (1 \times 10^6) cells. Centrifuge, remove supernatant, and resuspend the cell pellet in 100 μL of fixation solution (e.g., 4% formaldehyde in PBS). Incubate for 20 minutes with gentle agitation [15].
- Permeabilization and Blocking: Wash the fixed cells twice. Resuspend the pellet in 100 μL of a permeabilization buffer (e.g., flow buffer containing saponin) to punch holes in the membrane. Incubate for 15 minutes to several hours; this step also serves to block non-specific binding [15].
- Intracellular Antibody Staining: Add a titrated volume of primary antibody directly to the permeabilized cells. Incubate for 30–60 minutes at room temperature in the dark [15].
- Washing and Analysis: Wash the cells twice with permeabilization buffer to remove excess antibody. Resuspend in an appropriate buffer for flow cytometric analysis [15].
Figure 1: A workflow for flow cytometry analysis of stem cells, differentiating between the procedures for cell surface and intracellular marker staining.
The Scientist's Toolkit: Essential Reagents and Materials
Successful flow cytometry experiments depend on having the right tools. The following table lists essential reagents and their functions.
Table 2: Key Research Reagent Solutions for Flow Cytometry
| Reagent / Material | Function / Application |
|---|---|
| Flow Cytometry Staining Buffer | A protein-based buffer (e.g., with BSA) used to wash and resuspend cells, reducing non-specific antibody binding and maintaining cell integrity [16]. |
| Fc Receptor Blocking Reagent | Blocks Fc receptors on cells to prevent antibodies from binding non-specifically, thereby reducing background signal and improving data accuracy [16]. |
| Fixation Solution (e.g., 4% Formaldehyde) | Cross-links and preserves cellular proteins, halting biological processes and stabilizing the cell's state for subsequent analysis, especially for intracellular targets [15]. |
| Permeabilization Buffer (e.g., Saponin-based) | Creates pores in the cell membrane after fixation, allowing antibodies to access and bind to intracellular proteins like transcription factors [15]. |
| Fluorochrome-Conjugated Antibodies | Antibules specifically targeting markers of interest (e.g., SSEA-4, OCT4) that are linked to a fluorescent dye for detection by the flow cytometer [2] [3]. |
| Viability Dye | Distinguishes live cells from dead cells during analysis, which is crucial for obtaining accurate data by excluding results from compromised cells [15]. |
Advanced Applications in Stem Cell-Based Models
Flow cytometry is exceptionally suited for analyzing complex stem cell-derived models like 3D organoids, which often contain heterogeneous mixtures of cell types [2]. By designing antibody panels against markers for multiple lineages (e.g., neurons, glia, and progenitors in a neural organoid), researchers can quantitatively deconstruct the cellular composition of entire organoids. This provides a robust, high-throughput method to benchmark the reproducibility and quality of these model systems, directly addressing the ISSCR's emphasis on confirming the reliability of stem cell-based models [14].
Figure 2: Using flow cytometry to analyze the heterogeneous cell populations within a 3D organoid model.
Adherence to the ISSCR standards is no longer optional for rigorous, publishable stem cell research. Flow cytometry provides a powerful, versatile, and quantitative platform to meet these guidelines, from basic characterization of pluripotency to the complex analysis of advanced organoid models. By implementing the standardized protocols and principles outlined in this guide, researchers can significantly enhance the reliability, reproducibility, and ethical standing of their work, thereby accelerating the translation of stem cell discoveries into clinical applications.
Flow cytometry (FC) stands as a cornerstone technique in modern life sciences, enabling high-throughput, multi-parameter analysis of single cells within heterogeneous populations. In the critical field of stem cell research, it has become an indispensable tool for the identification, characterization, and authentication of stem cell lines, providing quantitative insights that are essential for ensuring experimental reproducibility and therapeutic safety [2]. This guide explores the power of flow cytometry, objectively comparing the performance of different technological platforms and detailing the experimental protocols that underpin robust stem cell authentication.
State-of-the-Art Instrumentation: A Comparative Analysis
The capabilities of flow cytometry are continually expanding, driven by innovations in instrumentation. The current landscape includes fluorescence, spectral, mass, and imaging flow cytometers, each with distinct advantages for specific applications in stem cell research.
The table below summarizes the core specifications of various state-of-the-art flow cytometry systems available today.
Table 1: Comparison of Modern Flow Cytometry Instruments
| Instrument | Manufacturer | Classification | Key Parameters | Primary Application in Stem Cell Research |
|---|---|---|---|---|
| FACSymphony A5 [17] | Becton Dickinson | Fluorescence Flow Cytometry | 9 lasers, 50 detectors | High-parameter phenotyping of complex stem cell populations |
| CytoFLEX SRT [18] | Beckman Coulter | Fluorescence Flow Cytometry | 4 lasers, 21 detectors (up to 30-color analysis) | High-throughput, automated cell analysis and sorting |
| FongCyte S [17] | Challenbio (China) | Fluorescence Flow Cytometry | 4 lasers, 14 detectors | Accessible, high-performance multicolor analysis |
| Aurora CS [17] | Cytek | Spectral Flow Cytometry | 5 lasers, 67 detectors | High-precision, full-spectrum analysis minimizing spillover |
| FACSDiscover S8 [17] | Becton Dickinson | Spectral and Imaging Flow Cytometry | 5 lasers, 86 detectors (including 6 imaging) | Phenotyping with simultaneous morphological analysis |
| FP7000 [17] | Sony | Spectral Flow Cytometry | 6 lasers, 182 detectors | Ultra-high-parameter panel design for deep profiling |
| CyTOF XT [17] | Standard BioTools | Mass Flow Cytometry | 135 channels | Ultra-high-parameter discovery without spectral overlap |
| MSFLO [17] | Powclin (China) | Mass Flow Cytometry | 259 channels | Maximum parameter detection for systems-level immunology |
| Amnis ImageStreamX Mark II [17] | Cytek | Imaging Flow Cytometry | 5,000 cells/s | Quantitative image-based analysis of cell morphology and function |
Spectral flow cytometry represents a significant evolution from conventional fluorescence cytometry. It captures the full emission spectrum of every fluorochrome, and through computational unmixing, resolves signals from multiple fluorochromes with minimal spillover [17]. This is particularly beneficial for stem cell research, where populations are often defined by complex combinations of surface and intracellular markers.
Mass cytometry (CyTOF) replaces fluorescent tags with metal isotopes and uses mass spectrometry for detection. This virtually eliminates spectral overlap, allowing for the simultaneous measurement of over 100 parameters [17]. While its lower throughput and the destructive nature of the analysis are limitations, it remains a powerful discovery tool for defining novel stem cell signatures in unprecedented detail.
Imaging flow cytometry merges the high-throughput capability of flow cytometry with the detailed morphological information of microscopy [2]. This allows researchers to confirm not just the presence of a biomarker, but also its subcellular localization—critical for assessing the pluripotent state of stem cells where key transcription factors are nuclear.
Flow Cytometry in Stem Cell Line Authentication
The authentication of stem cell lines is paramount to ensure their identity, purity, and functional capacity. Flow cytometry addresses this need by offering rapid, quantitative, and multi-parameter assessment of specific stem cell markers at a single-cell resolution.
Core Markers and Applications
Stem cells, including embryonic stem cells (ESCs), induced pluripotent stem cells (iPSCs), and various adult stem cells (e.g., mesenchymal, hematopoietic), are defined by their unique expression patterns of cell surface and intracellular markers [2]. FC enables the verification of these expression profiles.
Table 2: Key Applications of Flow Cytometry in Stem Cell Research
| Application | Description | Key Readouts |
|---|---|---|
| Population Purity | Quantifying the percentage of cells expressing pluripotency (e.g., SSEA-4, TRA-1-60, OCT4) or lineage-specific markers [2] [3]. | Percentage of positive cells, fluorescence intensity. |
| Rare Cell Isolation | Using Fluorescence-Activated Cell Sorting (FACS) to physically isolate even rare populations of stem cells from a heterogeneous sample for downstream culture or -omics analysis [2]. | Purity and viability of the sorted population. |
| Cell Cycle Analysis | Assessing the proliferative capacity of stem cells by measuring DNA content with dyes like Propidium Iodide [2]. | Distribution of cells in G0/G1, S, and G2/M phases. |
| Organoid Analysis | Disaggregating complex 3D organoid structures into single-cell suspensions to quantify the types and proportions of differentiated cells present [2]. | Multi-parameter phenotyping of constituent cells. |
Experimental Workflow for Authentication
A typical workflow for authenticating human induced pluripotent stem cells (iPSCs) via flow cytometry involves sample preparation, staining, acquisition, and data analysis [3]. The following diagram outlines the key steps in this protocol.
Diagram: iPSC Authentication Workflow via Flow Cytometry
Basic Protocol 1: iPSC Culture and Collection
- Culture: Maintain iPSCs on a feeder-free matrix in defined, feeder-free medium. Culture until cells are 70-80% confluent.
- Collection: Wash cells with DPBS and dissociate into a single-cell suspension using a gentle cell dissociation reagent. Neutralize the reagent with complete medium and collect the cell suspension.
- Preparation: Centrifuge to pellet cells and wash with FACS buffer (e.g., DPBS with 2% FBS). Pass the cells through a cell strainer to ensure a single-cell suspension and perform a viable cell count.
Basic Protocol 2: Staining for Extracellular and Intracellular Markers
- Extracellular Staining: Resuspend the cell pellet in FACS buffer. Add fluorochrome-conjugated antibodies against surface markers (e.g., anti-SSEA-4). Incubate for 20-30 minutes on ice protected from light. Wash cells with FACS buffer to remove unbound antibody.
- Intracellular Staining: Fix and permeabilize cells using a commercial fixation/permeabilization kit according to the manufacturer's instructions. After permeabilization, incubate cells with fluorochrome-conjugated antibodies against intracellular markers (e.g., anti-OCT4, anti-NANOG). Wash and resuspend in FACS buffer for acquisition.
- Controls: Include unstained cells, fluorescence-minus-one (FMO) controls, and isotype controls for accurate gating and compensation.
Basic Protocol 3 & 4: Flow Cytometry Acquisition and Data Analysis
- Acquisition: Use a flow cytometer calibrated with appropriate calibration beads. Acquire a sufficient number of events (e.g., 10,000-20,000) for statistically robust analysis.
- Analysis: Use CytExpert (Beckman Coulter), BD FACSDiva (BD Biosciences), or equivalent software. Create a forward scatter (FSC) vs. side scatter (SSC) plot to gate on single, viable cells. Then, plot fluorescence parameters to determine the percentage of cells positive for the stem cell markers. A bona fide iPSC line should show high, homogeneous expression of these markers [3].
The Scientist's Toolkit: Essential Research Reagents and Materials
Successful flow cytometry experiments, especially in stem cell research, rely on a suite of essential reagents and materials. The following table details key components of a researcher's toolkit.
Table 3: Essential Research Reagent Solutions for Flow Cytometry
| Item Category | Specific Examples | Function and Importance |
|---|---|---|
| Validated Antibodies | Anti-SSEA-4, Anti-TRA-1-60, Anti-OCT4, Anti-SOX2, Anti-NANOG [3] | Critical for specific detection of stem cell markers. Antibodies must be titrated for optimal signal-to-noise ratio [3]. |
| Viability Dyes | Propidium Iodide (PI), 7-AAD, DAPI | Distinguish live from dead cells, preventing false-positive data from non-viable cells. |
| Fixation & Permeabilization Buffers | Commercial kits (e.g., BD Cytofix/Cytoperm) | Preserve cell structure and allow antibodies to access intracellular targets for staining transcription factors. |
| Fluorochrome-Conjugates | FITC, PE, APC, and tandem dyes (e.g., PE-Cy7) | Generate the detectable signal. Panel design must account for spectral overlap to enable successful compensation [19]. |
| Cell Preparation Reagents | Gentle Cell Dissociation Enzymes, DPBS, Fetal Bovine Serum (FBS) | Generate high-quality single-cell suspensions without affecting surface epitopes. FBS is used to block non-specific binding in buffers. |
| Calibration Beads | Rainbow beads, alignment beads | Ensure the flow cytometer is performing optimally and consistently over time, critical for reproducible data. |
Flow cytometry, in its modern incarnations, provides an unparalleled combination of throughput, multi-parameter capability, and quantitative rigor. For the field of stem cell research, it is more than an analytical tool—it is a fundamental technology for authenticating cell lines, isolating pure populations, and validating differentiation outcomes. As instrumentation continues to advance with spectral, mass, and imaging technologies, and as analytical methods grow more sophisticated, the power of flow cytometry to illuminate the complexities of stem cell biology will only increase, solidifying its role as an indispensable asset in the researcher's arsenal.
Within the context of flow cytometry authentication for stem cell lines, the precise identification of pluripotent and mesenchymal stem cells stands as a fundamental prerequisite for reliable research and therapeutic development. The inherent heterogeneity of stem cell cultures presents a significant challenge for their biomedical application, creating an urgent need for specific, actionable biomarkers [20]. Authentication protocols relying on surface and intracellular proteins provide the foundation for ensuring cellular identity, purity, and functional potential, ultimately determining the validity of experimental data and the safety of clinical applications. This guide provides a detailed, objective comparison of the core markers used to authenticate human Pluripotent Stem Cells (PSCs) and Mesenchymal Stromal Cells (MSCs), as established by leading international societies and validated through contemporary research.
The progression from a pluripotent state to a committed mesenchymal lineage involves dramatic shifts in gene expression and protein presentation, which can be captured through multiparameter flow cytometry. For PSCs, including both embryonic stem cells (ESCs) and induced pluripotent stem cells (iPSCs), markers often reflect a core pluripotency network [21]. In contrast, MSCs derived from various somatic or perinatal tissues are defined by a distinct set of surface antigens and multilineage differentiation capacity [22] [23]. The following sections will dissect the specific marker profiles for each cell type, supported by experimental data and standardized protocols essential for any rigorous authentication pipeline.
Core Marker Panels for Stem Cell Authentication
Pluripotent Stem Cell (PSC) Markers
Human PSCs are characterized by a well-defined set of cell surface glycolipid and glycoprotein antigens, originally identified on human embryonic carcinoma cells and the inner cell mass of pre-implantation embryos [21]. The intracellular transcription factors that maintain the undifferentiated state are equally critical for authentication.
Table 1: Key Markers for Human Pluripotent Stem Cell Authentication
| Marker Name | Type | Expression in hPSCs | Key Characteristics |
|---|---|---|---|
| SSEA-3 [21] | Cell Surface Glycolipid | Positive | Stage-Specific Embryonic Antigen-3; downregulated upon differentiation. |
| SSEA-4 [21] | Cell Surface Glycolipid | Positive | Stage-Specific Embryonic Antigen-4; downregulated upon differentiation. |
| TRA-1-60 [21] | Cell Surface Glycoprotein | Positive | Antibody recognizes a podocalyxin epitope; key marker of pluripotency. |
| TRA-1-81 [21] | Cell Surface Glycoprotein | Positive | Antibody recognizes a podocalyxin epitope; key marker of pluripotency. |
| SSEA-1 [21] | Cell Surface Glycolipid | Negative | Expressed on differentiated cells; used as a negative selection marker. |
| OCT3/4 [21] | Intracellular Transcription Factor | Positive | A critical element in the "pluripotency network"; maintains undifferentiated state. |
| SOX2 [21] | Intracellular Transcription Factor | Positive | A critical element in the "pluripotency network"; maintains undifferentiated state. |
| NANOG [21] | Intracellular Transcription Factor | Positive | A critical element in the "pluripotency network"; maintains undifferentiated state. |
High-quality, undifferentiated hPSC cultures should demonstrate homogeneous expression of the positive surface markers (SSEA-3, SSEA-4, TRA-1-60, TRA-1-81) and transcription factors (OCT3/4, SOX2, NANOG) across nearly all cells, while showing minimal to no expression of the negative marker SSEA-1 [21]. This profile is unique from that of mouse PSCs, highlighting the importance of species-specific authentication panels.
Mesenchymal Stromal Cell (MSC) Markers
The International Society for Cellular Therapy (ISCT) has established minimal criteria for defining human MSCs. These include plastic-adherence, tri-lineage differentiation potential (into osteocytes, adipocytes, and chondrocytes), and a specific immunophenotype [23] [24]. This phenotype is defined by the positive expression of a set of surface markers and the absence of hematopoietic and myeloid markers.
Table 2: Key Markers for Human Mesenchymal Stromal Cell Authentication per ISCT Criteria
| Marker Name | Expression in hMSCs | Function / Note |
|---|---|---|
| CD73 [23] [24] | Positive | 5'-Nucleotidase; ectoenzyme. |
| CD90 [23] [24] | Positive | Thy-1; cell adhesion molecule. |
| CD105 [23] [24] | Positive | Endoglin; receptor for TGF-beta. |
| CD11b/CD14 [23] | Negative | Myeloid lineage markers. |
| CD19/CD79a [23] | Negative | B-cell lineage markers. |
| CD34 [23] [24] | Negative | Hematopoietic progenitor cell marker. |
| CD45 [23] [24] | Negative | Pan-hematopoietic marker (Leukocyte Common Antigen). |
| HLA-DR [23] | Negative | MHC Class II molecule (should be negative on unstimulated MSCs). |
While the ISCT criteria provide a foundational definition, it is important to note that MSCs isolated from different tissue sources may express additional markers. For example, MSCs from bone marrow, adipose tissue, dental pulp, and umbilical cord (Wharton's Jelly) can exhibit variations in the expression of markers like STRO-1, CD106 (VCAM-1), CD146, and CD49a [22] [23] [24]. Furthermore, the field is evolving to recognize MSCs as "Medicinal Signaling Cells," emphasizing their paracrine actions, but the core surface marker profile remains a critical release criterion for cellular products [22].
Experimental Protocols for Flow Cytometry Authentication
Sample Preparation and Staining
Robust flow cytometry begins with high-quality sample preparation. The goal is to achieve a suspension of live, single cells without altering the protein epitopes of interest.
- Cell Processing: The processing method must be tailored to the cell type. Non-adherent cells require minimal manipulation, while adherent cells (like many MSC cultures) often need chemical dissociation using enzymes like trypsin or dissociation reagents containing EDTA. The use of enzymes must be validated to ensure target protein detection is not compromised [12]. For primary tissues, mechanical and/or enzymatic digestion is typically required [12].
- Single-Cell Suspension: After processing, filtering samples through a nylon mesh is recommended to remove cell clumps and lower the risk of clogging the flow cytometer. For adherent cells, trituration (aspirating the suspension through a small needle) can help disperse aggregates [12].
- Viability and Cryopreservation: Cell viability can be assessed using viability dyes. If cells are cryopreserved, it is critical to note that the freeze-thaw process alters cell viability and may impact protein expression. Thawed cells may need to be "rested" before analysis, a condition that requires optimization [12].
- Antibody Staining: The choice of antibody is paramount. For improved reproducibility, it is generally advised to use monoclonal or recombinant antibodies, which are less likely to have cross-reactivity compared to polyclonal antibodies [12]. Antibodies must be validated for specificity and selectivity for flow cytometry applications, following guidelines proposed by the International Working Group for Antibody Validation (IWGAV) [12].
Panel Design and Gating Strategy
Multicolor flow cytometry panel design is a deliberate process that requires careful planning to avoid analytical errors.
- Antigen Density and Fluorochrome Pairing: Understanding the expression level (antigen density) of each target is crucial. A best practice is to pair lowly expressed antigens with the brightest fluorochromes to ensure clear resolution. Highly expressed antigens can be paired with dimmer fluorochromes [25].
- Gating Strategy: Before the experiment, outline a preliminary gating strategy. This involves defining the relationships between antigens and identifying which markers are co-expressed or mutually exclusive. This strategy helps in placing fluorochromes to minimize spectral overlap issues on the same cell type [12]. A well-defined strategy starts with doublet exclusion (FSC-H vs FSC-A) and live cell gating, followed by sequential gating to identify the population of interest based on the marker panels defined in Tables 1 and 2.
- Controls: Appropriate controls, including unstained cells, fluorescence-minus-one (FMO) controls, and isotype controls, are essential for setting gates accurately and interpreting data correctly.
The workflow below summarizes the key experimental and analytical stages for authenticating stem cells using flow cytometry.
The Scientist's Toolkit: Essential Research Reagents and Materials
Successful authentication relies on a suite of reliable tools and reagents. The following table details essential items for a flow cytometry-based stem cell authentication workflow.
Table 3: Essential Research Reagent Solutions for Stem Cell Authentication
| Item / Solution | Function / Application | Examples / Key Features |
|---|---|---|
| Validated Antibody Panels [12] [23] [24] | Detection of specific surface and intracellular markers for PSCs and MSCs. | Monoclonal or recombinant antibodies against CD73, CD90, CD105 for MSCs; SSEA-4, TRA-1-60 for PSCs. Pre-verified multi-color flow cytometry kits are available. |
| Cell Dissociation Reagents [12] | Gentle detachment of adherent stem cells for creating single-cell suspensions. | Enzymatic (e.g., trypsin, accutase) and non-enzymatic (e.g., EDTA-containing) reagents. Choice must be validated to preserve epitopes. |
| Viability Dyes [12] | Discrimination of live/dead cells during flow analysis to ensure analysis of healthy cells. | Dyes that penetrate compromised membranes of dead cells (e.g., propidium iodide, 7-AAD, or amine-reactive dyes). |
| Flow Cytometry Instrumentation [12] [26] | High-throughput, multiparameter analysis and sorting of single cells. | Conventional (compensation-based) or spectral (unmixing-based) cytometers. Mass cytometry (CyTOF) allows for >40 parameters using heavy metal tags [26]. |
| Specialized Culture Media [27] [23] | Maintenance and directed differentiation of stem cells to confirm functional potential. | Media for pluripotency maintenance (e.g., E8 for iPSCs [27]) and trilineage differentiation for MSCs (e.g., adipogenic, osteogenic, chondrogenic media [23]). |
| Data Analysis Software [25] | Analysis of high-dimensional flow cytometry data. | Software for conventional sequential gating and unsupervised clustering algorithms (e.g., tSNE, Wishbone [26] [25]) to identify novel subsets. |
The rigorous authentication of pluripotent and mesenchymal stem cells through defined surface and intracellular markers is a non-negotiable standard in both basic research and translational therapy development. As evidenced by the established criteria, PSCs and MSCs possess distinct and definitive molecular signatures that can be consistently tracked using flow cytometry when supported by optimized experimental protocols. The continued evolution of single-cell proteomics and spectral flow cytometry promises to further refine these definitions, uncovering deeper heterogeneity and more nuanced markers [20] [26]. By adhering to these detailed guidelines for marker selection, panel design, and experimental execution, researchers can ensure the integrity of their stem cell lines, thereby generating reliable, reproducible, and clinically relevant data.
From Theory to Practice: A Step-by-Step Flow Cytometry Protocol for Stem Cell Authentication
In the field of flow cytometry authentication for stem cell lines, the reliability of experimental data hinges on the precise identification and verification of cellular phenotypes. The inherent heterogeneity of human pluripotent stem cell-derived cardiomyocytes (hPSC-CMs) complicates their use in critical applications like cardiotoxicity testing and cellular replacement therapy, where imprecise specification can confound results or pose serious safety concerns [28]. As research increasingly moves toward clinical translation and personalized medicine, implementing a fit-for-purpose authentication workflow becomes paramount for ensuring reproducible, interpretable, and comparable data across laboratories and studies [28] [29].
The fundamental challenge lies in the fact that stem cell differentiation does not yield a single, homogeneous endpoint, and the resulting heterogeneity varies considerably among laboratories, cell lines, and protocols [28]. This perspective article establishes a framework for developing authentication workflows specifically tailored for flow cytometry-based analysis of stem cell derivatives, advocating for a mindset where antibodies and experimental conditions are demonstrated as specific within a defined experimental design and biological context [28] [30].
Foundational Concepts in Stem Cell Authentication
Defining Authentication in the Stem Cell Context
Within stem cell research, "authentication" encompasses multiple dimensions of verification, each addressing different aspects of cell line identity and characteristics:
Genetic Identity: Synonymous with the biological identity of a line, derived from the original donor and used to authenticate cells and cell lines through methods such as Short Tandem Repeat (STR) profiling, SNP arrays, or whole-genome sequencing [29]. The International Society for Stem Cell Research (ISSCR) recommends STR analysis as the internationally recognized consensus standard for human cell line authentication [31].
Biological Phenotype: Describes the characteristic phenotypes of a cell line, including pluripotency, cell morphology, and accompanying transcriptomic or metabolic features [29]. For hPSC-derived cardiomyocytes, this includes the expression of intracellular proteins like cardiac troponin T or I (TNNT2 or TNNI3) [28].
Digital Phenotype: Encompasses the body of data linked to a digital identifier through centralized cell line registries, requiring both data files and metadata explaining the experimental setup [29].
The Fit-for-Purpose Validation Mindset
The concept of "fit-for-purpose" represents a paradigm shift in antibody validation and experimental design for flow cytometry authentication. Unlike blanket claims of antibody "validation," the fit-for-purpose approach recognizes that antibody specificity is always context-dependent [28]. Demonstrating specificity in one experimental application (e.g., Western blotting) does not guarantee specificity in another (e.g., flow cytometry of intact cells) due to differences in protein denaturation, solubilization, dilution, and separation [28].
This approach emphasizes that authentication protocols must be rigorously tested and demonstrated to accurately distinguish between defined positive and negative cell types within the specific experimental context in which they will be applied [28] [30]. The workflow includes critical steps such as negative cell-type controls, mixed population experiments, and careful evaluation of how sample preparation affects different antibody clones and cell types [28].
Comparative Analysis of Authentication Methodologies
Cell Line Identity Authentication Methods
Table 1: Comparison of Cell Line Identity Authentication Methods
| Method | Key Principle | Applications in Stem Cell Research | Strengths | Limitations |
|---|---|---|---|---|
| STR Profiling [31] | Analysis of highly polymorphic short tandem repeat regions | Primary method for authenticating human cell lines; detecting cross-contamination | - Internationally recognized standard- Cost-effective- Reproducible across platforms- Can detect multiple cell sources in a culture | - Requires reference sample from original donor or earliest passage stocks- Genetic profiles should not be made public to protect donor privacy |
| SNP Profiling [31] | Analysis of single nucleotide polymorphisms throughout the genome | Alternative authentication method; particularly useful for genetic studies | - Can provide additional genetic information- Useful for lineage tracking | - Less established as a standard for routine authentication- May require more complex analysis |
| Whole Genome Sequencing (WGS) [31] | Comprehensive sequencing of the entire genome | Most comprehensive authentication; provides full genetic characterization | - Provides complete genetic information- Can identify subtle genetic changes over time | - More costly and computationally intensive- Overkill for routine authentication needs |
Flow Cytometry Immunophenotyping Approaches
Table 2: Comparison of Flow Cytometry Authentication Approaches for Stem Cell Derivatives
| Method | Target Markers | Applications | Technical Considerations | Data Analysis Framework |
|---|---|---|---|---|
| Surface Marker Detection [28] | Cell surface proteins (e.g., CD markers) | Live cell sorting and analysis; isolation of specific populations | - Enables detection and isolation of live cells- Limited by availability of specific surface markers for some cell types | Traditional gating strategies; requires careful negative control selection |
| Intracellular Protein Detection [28] [30] | Intracellular proteins (e.g., cardiac troponin T/I) | Gold standard for demarking specific cell identities like cardiomyocytes | - Requires fixation and permeabilization- Sample preparation significantly affects results- Antibody clone-dependent effects observed | Generalized Linear Models (GLM) framework accommodates non-normal proportional data [32] |
| Machine Learning-Assisted Analysis [33] | Multiple parameters simultaneously | Automated detection of abnormal populations (e.g., acute myeloid leukemia) | - Reduces error rates and increases reproducibility- Requires infrastructure for automated inference and monitoring | Cloud-based inference with Kubernetes workflow systems for scalability and reproducibility |
Experimental Performance Comparison
Table 3: Experimental Performance of Authentication Methods in Published Studies
| Application Context | Method | Reported Performance | Key Experimental Variables | Reference |
|---|---|---|---|---|
| hPSC-CM Identification [28] | Flow cytometry with cardiac troponin antibodies | Varied by antibody clone and sample preparation protocol | - Antibody clone selection- Fixation/permeabilization method- Negative control cell type | Seven antitroponin antibody clones evaluated across three sample preparation protocols |
| TB Vaccine Research [32] | GLM of flow cytometry data | Effectively handled proportional, non-normal data distributions | - Sex of animal model- Vaccination status- Days post-infection | Analyzed probabilities of immune cell phenotypes following Mtb challenge |
| AML Detection [33] | Machine learning-based flow cytometry | Reduced error rates, increased reproducibility in clinical setting | - Model monitoring infrastructure- Structured data extraction from reports- Cloud-based inference systems | Post-deployment analysis showed impacts on turn-around time and accuracy |
Essential Research Reagent Solutions
Core Authentication Reagents and Materials
Table 4: Key Research Reagent Solutions for Fit-for-Purpose Authentication
| Reagent/Material | Function in Authentication Workflow | Critical Specifications | Application Notes |
|---|---|---|---|
| Validated Antibodies [28] [30] | Detection of cell type-specific markers (surface or intracellular) | Clone-specific performance; specificity for target antigen in specific application | Must undergo fit-for-purpose validation; performance varies by sample preparation method |
| Isotype Controls [28] | Assessment of non-specific antibody binding | Matched to primary antibody isotype and conjugation | Alone insufficient for establishing specificity; must be used with negative cell-type controls |
| Negative Control Cell Types [28] | Establishing true negative populations for protocol validation | Genetically defined negative cells (e.g., undifferentiated hPSCs for hPSC-CM analysis) | Critical for evaluating whether protocol can distinguish positive and negative populations |
| Positive Control Cell Types [28] | Establishing true positive populations for protocol validation | Mass spectrometry confirmation of target protein presence provides antibody-independent validation | Essential for demonstrating true positive detection capability |
| Fixation/Permeabilization Reagents [28] [30] | Enable intracellular protein detection for flow cytometry | Protocol-dependent effects on antibody binding and background signal | Significantly impact results in cell-type and antibody clone-dependent manner |
| Reference Standard Cell Lines [31] [29] | Method validation and cross-laboratory standardization | Well-characterized with registered digital identifiers (RRIDs) | Enable standardization across experiments and laboratories |
Experimental Protocols for Fit-for-Purpose Validation
Workflow for Establishing Authentication Protocols
The development of a fit-for-purpose authentication protocol follows a systematic workflow to ensure reliability and specificity [28] [30]. The process begins with the critical step of defining true negative and true positive cell types, which may involve genetic manipulation to create true negative populations or mass spectrometry to confirm target protein presence in positive populations [28]. The protocol then proceeds through iterative testing of antibodies and sample preparation conditions against these defined controls, evaluating the effects of different reagents and incubation times on the ability to distinguish between positive and negative populations [28].
A cornerstone of the fit-for-purpose workflow is the mixed population experiment, where the protocol in development is applied to mixtures containing defined proportions of positive and negative cells across a specified dynamic range [28]. The interpretation relies on comparing the known percent composition to the experimentally determined percent positivity for each sample, with valid protocols demonstrating a direct relationship between these values [28].
Figure 1: Fit-for-Purpose Protocol Development Workflow. This systematic approach ensures authentication methods are rigorously validated within specific experimental contexts.
Standard Operating Procedure for hPSC-Derived Cardiomyocyte Authentication
Based on the fit-for-purpose workflow, a detailed Standard Operating Procedure (SOP) can be developed for authenticating specific stem cell derivatives. For hPSC-derived cardiomyocytes (hPSC-CMs), this involves [30]:
Sample Preparation: Selection of appropriate fixation and permeabilization methods that minimize background while preserving antigen accessibility. The protocol must be optimized for specific antibody clones, as performance varies significantly with different preparation conditions [28].
Antibody Validation: Systematic testing of multiple antibody clones against both hPSC-CMs (positive) and undifferentiated hPSCs (negative) using different sample preparation protocols. This identifies clones and conditions that provide clear discrimination between positive and negative populations [28].
Control Strategies: Implementation of both isotype controls and negative cell-type controls to distinguish specific from non-specific binding. Research shows that isotype controls alone are insufficient, as they may not reveal sample preparation-dependent background signals that affect both positive and negative cell types differently [28].
Data Acquisition and Analysis: Application of appropriate statistical frameworks such as Generalized Linear Models (GLMs) that can handle proportional, non-normal data distributions common in flow cytometry analysis [32]. For advanced applications, machine learning approaches can enhance detection of complex phenotypes [33].
Advanced Framework: Integrated Digital Authentication
The Role of Digital Identifiers in Stem Cell Authentication
A critical advancement in stem cell authentication is the implementation of digital identifiers that create unambiguous links between physical cell lines and their characterizing data [29]. These unique and persistent codes, issued by authoritative cell line registries such as hPSCreg and Cellosaurus, support the use of human-readable cell line names while enabling machine-readable data integration [29].
Cellosaurus, which serves as the cell line resource for the Resource Identification Initiative (RII), aims to describe all cell lines used in biomedical research and assigns Research Resource Identifiers (RRIDs) that are increasingly mandated in journal method sections [29]. This infrastructure addresses the challenge of poorly coordinated cell line naming practices, where user-generated names are often neither unique, stable, nor persistent across laboratories [29].
Implementing a Comprehensive Digital Phenotyping Strategy
The integration of digital identifiers with experimental data creates digital phenotypes that comprehensively characterize stem cell lines [29]. This requires:
Registration of Cell Lines: Active participation by researchers in registering cell lines with appropriate registries to obtain persistent digital identifiers before publication or distribution [29].
Documentation of Ethical Provenance: Ensuring fundamental information about donor consent and approved uses travels with the cell line through machine-readable profiles [29].
Linking Experimental Data: Associating flow cytometry authentication data and other characterization results with the cell line's digital identifier to build a comprehensive phenotypic profile [29].
Federated Data Sharing: Utilizing the interoperability between registries, repositories, and databases to enable seamless data sharing while maintaining provenance and attribution [29].
Figure 2: Integrated Digital Authentication Ecosystem. Digital identifiers create persistent links between physical cell lines and their associated data throughout the research lifecycle.
Developing a robust, fit-for-purpose authentication workflow for flow cytometry analysis of stem cell lines requires both technical rigor and strategic infrastructure. The comparative analysis presented here demonstrates that no single authentication method suffices for all applications; rather, researchers must implement complementary approaches tailored to their specific research questions and intended applications.
The most effective authentication strategies integrate traditional methods like STR profiling for cell line identity with functional phenotyping through flow cytometry and digital tracking through registered identifiers. This multi-layered approach ensures both the genetic identity and functional characteristics of stem cell lines are properly authenticated and documented throughout the research lifecycle.
Successful implementation requires adherence to core principles: (1) adopting a fit-for-purpose validation mindset for all reagents and protocols, (2) establishing well-characterized positive and negative control materials, (3) implementing digital identifiers to track cell lines and associated data, and (4) selecting appropriate statistical frameworks for data analysis that accommodate the specific characteristics of flow cytometry data. By following these principles and leveraging the comparative data presented herein, researchers can develop authentication workflows that enhance reproducibility, facilitate data interpretation, and ultimately accelerate the translation of stem cell research toward clinical applications.
In flow cytometry authentication of stem cell lines, the accuracy of the results is profoundly dependent on the initial steps of sample preparation. Inconsistent or suboptimal cell dissociation, fixation, and permeabilization can introduce artifacts, compromise cell viability, and mask critical antigenic sites, leading to misinterpretation of a stem cell population's identity, purity, and functional state. This guide objectively compares the performance of various techniques and reagents central to these processes, providing structured experimental data and protocols to empower researchers in making informed methodological choices.
Cell Dissociation Techniques for Single-Cell Suspensions
The first critical step for flow cytometry analysis is creating a high-quality single-cell suspension from tissue or cultured cells. The method chosen directly impacts cell yield, viability, and the preservation of surface markers.
Table 1: Comparison of Core Cell Dissociation Methods [34]
| Method | Principle | Advantages | Disadvantages | Typical Cell Viability | Optimal Tissue Type |
|---|---|---|---|---|---|
| Mechanical | Physical cutting, crushing, or scraping of tissue. | Fast; simple protocol [34]. | Inconsistent yield and viability; can damage cells [34]. | Variable | Loosely associated tissues (e.g., spleen, lymph nodes) [34]. |
| Enzymatic | Uses enzymes (e.g., trypsin, collagenase) to digest extracellular matrix [35] [34]. | Highly efficient for compact tissues; high cell yield [34]. | Time-consuming; can damage cell surface proteins [35] [34]. | >90% (method-dependent) [35] | Compact tissues (e.g., liver, solid tumors) [35] [34]. |
| Chemical | Uses cation-chelating agents (e.g., EGTA) to disrupt intercellular bonds [34]. | Gentle; does not alter surface proteins [34]. | Can be a slow process; results can be inconsistent [34]. | High (healthy cultured cells) | Delicate cells (e.g., embryonic cells) [34]. |
Advanced, non-enzymatic dissociation technologies are emerging to overcome the limitations of traditional methods. Electrical dissociation can achieve 95% efficacy with 90% viability in just 5 minutes for bovine liver tissue, while ultrasound dissociation (sonication) has shown 72% efficacy when combined with enzymes [35]. Microfluidic platforms represent another innovative approach, enabling the dissociation of minced tissue into single cells with high viability (e.g., ~95% for kidney epithelial cells) in significantly reduced processing times (1-60 minutes) [35].
Fixation Methods for Cellular Architecture and Antigen Preservation
Fixation stabilizes cells and tissues by inactivating enzymes and preserving morphological structure. The choice of fixative is a critical balance between optimal preservation and the retention of antigenicity for antibody binding.
Table 2: Comparison of Common Chemical Fixatives [36] [37] [38]
| Fixative | Mechanism | Effect on Antigens | Best For | Limitations |
|---|---|---|---|---|
| Aldehydes (e.g., PFA, Formalin) | Crosslinks proteins, creating a stable network [36] [39]. | Good for many antigens; can mask some epitopes [36] [39]. | Preserving morphology; IHC/IF; most intracellular and surface proteins [36] [38]. | Over-fixation can require antigen retrieval; may reduce fluorescence signal [40]. |
| Precipitating (e.g., Methanol, Acetone) | Dehydrates and precipitates proteins in situ [36] [39]. | Can expose buried epitopes; may destroy delicate antigens [36] [39]. | Large protein antigens (e.g., immunoglobulins); certain cytoskeletal targets [36] [39]. | Can cause severe tissue shrinkage; less suited for soluble targets or phospho-specific antibodies [36] [39]. |
| Trichloroacetic Acid (TCA) | Precipitates proteins. | Alters tissue morphology; ineffective for mRNA HCR [38]. | Can reveal protein signals in tissues inaccessible to PFA [38]. | Not a general-purpose fixative; requires application-specific validation [38]. |
The impact of fixation is not merely theoretical. A 2019 study on cytology specimens directly compared 10% Neutral Buffered Formalin (NBF) with 96% alcohol for cell block preparation. Using E-cadherin (membrane protein) and Ki67 (nuclear protein) as markers, it found a significant difference (p=0.0001) in immunohistochemistry (IHC) expression scores across all fixation durations in alcohol (1-72 hours) compared to the NBF gold standard, concluding that 96% alcohol is unsuitable for these markers [37]. This underscores the necessity of fixative validation.
Permeabilization Strategies for Intracellular Marker Access
For staining intracellular or nuclear targets—such as the transcription factors essential for identifying pluripotent stem cells (e.g., Nanog, Oct4)—permeabilization is mandatory after crosslinking fixation. This step creates pores in the membrane to allow antibodies access to the cell's interior.
Table 3: Comparison of Cell Permeabilization Agents [41] [40] [39]
| Agent / Method | Mechanism | Key Considerations |
|---|---|---|
| Detergents (Triton X-100, Tween-20, Saponin) | Dissolves lipids in cell membranes, creating pores [41] [39]. | Triton X-100: Strong, general-purpose permeabilization [39]. Saponin: Mild, creates reversible pores; often used for secreted proteins or with mild detergents [41] [39]. Tween-20: In one study, 0.2% Tween-20 for 30 min provided superior results for intracellular 18S rRNA detection by flow cytometry (97.9% cell frequency) [41]. |
| Alcohols (Methanol, Ethanol) | Dehydrates cells and precipitates proteins, simultaneously fixing and permeabilizing [40] [39]. | Can alter light scatter properties and decrease fluorescence of some surface markers (e.g., CD3, CD45) [40]. Can improve signals for some cytoskeletal and organelle targets [39]. |
The choice of permeabilization buffer is particularly crucial for complex assays like T regulatory (Treg) cell characterization. A comparative study of five commercial FoxP3 buffer sets revealed dramatic differences in the resolution of the CD25+FoxP3+ population and the intensity of key surface markers like CD45 [40]. This highlights that the permeabilization method must be optimized for the specific antibody panel and cell type.
Sample Prep Workflow for Flow Cytometry
Integrated Experimental Protocols
Protocol 1: optimized dissociation & staining for stem cell markers
This protocol for the flow cytometric analysis of undifferentiated markers in human induced pluripotent stem cells (iPSCs) illustrates the integration of these techniques [3].
- iPSC Culture and Collection: Culture iPSCs in standard conditions. For collection, dissociate the cells into a single-cell suspension using a gentle enzymatic reagent like Accutase. Quench the enzyme with complete medium and wash the cells with PBS [3].
- Staining for Extracellular and Intracellular Markers: Resuspend the cell pellet in flow cytometry staining buffer. For surface markers (e.g., SSEA-4), incubate with fluorochrome-conjugated primary antibodies for 30-60 minutes on ice. Wash to remove unbound antibody. Fix cells using 4% Paraformaldehyde (PFA) for 15-20 minutes at room temperature. Wash again. Permeabilize cells using a detergent-based permeabilization buffer (e.g., with Triton X-100 or saponin) for 15-30 minutes. For intracellular markers (e.g., Nanog, Oct4), incubate with the corresponding antibodies in permeabilization buffer. Wash and resuspend in buffer for analysis [3].
- Flow Cytometry Acquisition and Analysis: Acquire data on a flow cytometer, using unstained and single-color controls for compensation and gating. Analyze the data to verify high, homogeneous expression of pluripotency markers [3].
Protocol 2: comparing fixation & permeabilization buffers
When validating a new antibody or cell type, a comparative test of different buffers is essential [40].
- Sample Preparation: Split a single cell suspension into multiple aliquots.
- Fixation and Permeabilization: Treat each aliquot with a different commercial buffer set (e.g., BD Pharmingen FoxP3 Buffer Set, BioLegend FoxP3 Fix/Perm Buffer Set) according to their respective protocols [40].
- Staining and Analysis: Stain all aliquots with an identical antibody panel targeting key surface (e.g., CD45, CD3, CD4) and intracellular (e.g., FoxP3) markers. Analyze on a flow cytometer, comparing the fluorescence intensity, resolution of positive populations, and preservation of light scatter characteristics [40].
The Scientist's Toolkit: Key Research Reagents
Table 4: Essential Reagents for Sample Preparation [36] [41] [34]
| Reagent | Function | Example Use Case |
|---|---|---|
| Paraformaldehyde (PFA) | Crosslinking fixative. Preserves cellular morphology and immobilizes antigens [36] [39]. | Standard fixation for most IF/IHC and flow cytometry protocols (often at 2-4%) [36] [41]. |
| Triton X-100 | Non-ionic detergent for permeabilization. Creates pores in lipid membranes [41] [39]. | General-purpose permeabilization after PFA fixation (e.g., at 0.1-0.5%) [41] [39]. |
| Tween-20 | Mild non-ionic detergent for permeabilization. | Effective for intracellular RNA detection by flow cytometry (e.g., at 0.2%) [41]. |
| Methanol | Precipitating fixative and permeabilizer. Denatures and precipitates proteins [40] [39]. | Fixing and permeabilizing in a single step for robust cytoskeletal antigens [39]. |
| Saponin | Mild detergent permeabilization. Creates temporary pores by complexing with cholesterol [41]. | Staining for labile intracellular antigens or secreted proteins; often used in wash buffers [41] [39]. |
| Collagenase/Dispase | Enzymatic blend for tissue dissociation. Digests collagen and other ECM proteins [35]. | Dissociating tough, fibrous tissues like tumors or organs for primary cell isolation [35]. |
| Trypsin-EDTA | Enzymatic and chemical dissociation. Trypsin digests proteins, EDTA chelates calcium to disrupt adhesions [35] [41]. | Routine passaging and dissociation of adherent cell cultures (e.g., HeLa cells) [41]. |
The journey to reliable and reproducible flow cytometry data, especially in the nuanced field of stem cell authentication, begins at the sample preparation stage. There is no universal "best" method for dissociation, fixation, or permeabilization. The optimal protocol is a function of the specific cell type, the target antigens (surface or intracellular), and the required balance between preservation of structure and antigenicity. As evidenced by the comparative data presented, empirical validation of these techniques is not a mere formality but a fundamental requirement for rigorous scientific practice. By systematically selecting and optimizing these foundational steps, researchers can ensure their data truly reflects biological reality.
In the field of flow cytometry authentication of stem cell lines, the power of multicolor panels is undeniable. However, this power is fully realized only through rigorous panel design, where the careful matching of fluorochrome brightness to antigen density is paramount. For researchers characterizing pluripotent stem cell derivatives, a methodical approach is essential to accurately identify and isolate specific cell types, such as cardiomyocytes, based on intracellular protein expression [30]. This guide outlines a systematic workflow and provides the necessary tools to design robust, high-performing flow cytometry panels tailored to this critical application.
A Systematic Workflow for Panel Design
A structured approach to panel design ensures that all critical factors are considered, from the initial biological question to the final validation of the staining protocol. The following workflow, adapted from established resources in the field, provides a reliable framework [42].
Figure 1. The logical sequence of steps for building a robust flow cytometry panel, beginning with a clear experimental hypothesis and culminating in panel validation [42].
Step 1: Define Your Experimental Hypothesis
The first step involves precisely defining the biological information you need to obtain. This includes identifying the specific population of cells you wish to interrogate (e.g., hPSC-derived cardiomyocytes) and determining whether your targets are on the cell surface or located intracellularly (e.g., cardiac troponin) [42] [30].
Step 2: Marker Selection and Antigen Density
Next, identify the markers needed to define your population of interest. Critically, you must categorize these markers not just by biological function, but by their expression level on the target cells [42]:
- Primary antigens: Lineage-defining markers expressed at high density.
- Secondary antigens: Markers often expressed over a continuum.
- Tertiary antigens: Critical markers, such as many transcription factors or activation markers, expressed at low density.
This ranking is a cornerstone of effective panel design, as it directly informs fluorochrome assignment.
Step 3: Know Your Flow Cytometer
Understanding your instrument's configuration is non-negotiable. You must know the laser wavelengths available for excitation and the number and filter configuration of the detectors for each laser. This information defines the palette of fluorochromes available for your panel [42].
Step 4: Fluorochrome Assignment
This is the critical execution phase where markers are paired with fluorochromes. The fundamental rule is to pair bright fluorochromes with low-expression (tertiary) antigens and dim fluorochromes with high-expression (primary) antigens [42] [25]. This strategy maximizes the sensitivity for detecting difficult-to-find markers. It is equally important to minimize spectral overlap by using tools like a spillover spread matrix (SSM) recorded on the instrument intended for the experiments. Fluorochromes with significant spectral overlap should not be used to detect markers that are co-expressed on the same cell type [25].
Step 5: Review Panel and Optimize
Finally, review your panel design and begin ordering reagents. Remember that antibody titration is essential for optimal performance. Include proper controls, such as compensation controls, fluorescence-minus-one (FMO) controls, and biological controls, to ensure the data generated is reliable [42].
Determining Antigen Density: The Scientist's Toolkit
A key challenge in panel design has been the lack of accessible data on antigen expression levels. Previously reliant on literature reviews and guesswork, researchers now have powerful tools to make informed decisions.
Table 1. Key Resources for Determining Antigen Density
| Resource Name | Type of Data | Key Features & Application |
|---|---|---|
| Benchsci.com [43] | AI-curated published data | Uses artificial intelligence to search published figures for specific targets, clones, and cells; aids in reagent selection and validation. |
| Human Cell Differentiation Molecules (HCDM) [43] | Systematically measured expression levels | Provides data on expression levels of CD antigens across 47 immune cell subsets; a reference for expected expression. |
| Astrolabe Platform [43] | Mass cytometry data | Screens over 350 antibodies; allows exploration of antigen density in high-dimensional datasets. |
Experimental Protocols for Fit-for-Purpose Validation
When working with novel cell types like stem cell derivatives, a standardized protocol may not exist. Therefore, establishing a fit-for-purpose workflow for antibody validation and staining is crucial. The following protocol is adapted from methods used for intracellular protein analysis in hPSC-derived cardiomyocytes (hPSC-CMs) [30].
Protocol: Establishing a Standard Operating Procedure (SOP) for Intracellular Staining
1. Antibody Validation
- Fixation and Permeabilization Optimization: Test different combinations of fixation (e.g., PFA) and permeabilization buffers (e.g., methanol, saponin-based) to find the condition that provides the best signal-to-noise ratio for your specific intracellular target.
- Titration: Titrate the antibody of interest on a well-characterized positive control sample (e.g., a known hPSC-CM line) and a negative control (e.g., undifferentiated hPSCs or an isotype control) to determine the optimal concentration that maximizes specificity.
2. Staining and Data Acquisition
- Cell Preparation: Harvest and wash cells. Perform surface marker staining if required, then fix and permeabilize cells according to the optimized protocol.
- Intracellular Staining: Incubate cells with the validated, titrated antibody for the intracellular target.
- Flow Cytometry: Acquire data on your flow cytometer, ensuring instrument settings are standardized and stable.
3. Gating Strategy and Data Analysis
- Viability and Singlets: Gate on live cells based on a viability dye, followed by sequential gating on single cells using FSC-A vs. FSC-H.
- Positive Population Identification: Use FMO controls to accurately set the gate for the positive population of the intracellular marker. This is critical for low-expression antigens.
- Analysis: Report the percentage of positive cells and the median fluorescence intensity (MFI).
Fluorochrome Brightness and Antigen Density in Practice
The theoretical framework of pairing bright fluorochromes with dim antigens must be implemented with a clear understanding of both variables. The relationship between these elements and the resulting data quality can be visualized as follows.
Figure 2. The critical relationship between antigen density and fluorochrome brightness. Pairing a dim antigen with a dim fluorochrome leads to a poor signal and an inability to resolve the positive population. The optimal pairing for critical, low-abundance markers is a bright fluorochrome to ensure a strong, detectable signal [42] [43].
Table 2. Categorization of Markers and Recommended Fluorochrome Pairing
| Antigen Category | Expression Level | Examples in Stem Cell/Authentication | Recommended Fluorochrome Brightness |
|---|---|---|---|
| Primary | High | CD3, CD19, CD4 [43] | Dim |
| Secondary | Moderate/Variable | CD45, CD44 | Medium |
| Tertiary | Low | Cardiac Troponin (hPSC-CMs) [30], Cytokines, Transcription Factors | Bright |
Research Reagent Solutions for Flow Cytometry Authentication
Building a reliable panel requires more than just antibodies; it involves a suite of reagents and tools for quality control.
Table 3. Essential Materials for Panel Development and Validation
| Item | Function | Example Application |
|---|---|---|
| Titrated Antibodies | Ensures optimal staining with maximal signal-to-noise ratio. | Validating a new clone for an intracellular target like Nanog or SOX2. |
| Viability Dye | Distinguishes live cells from dead cells, improving data quality. | Excluding dead cells during analysis of sensitive hPSC-derived cultures. |
| Fixation & Permeabilization Buffers | Enables intracellular antigen staining by making the cell membrane permeable. | Staining for intracellular proteins in pluripotent stem cell derivatives [30]. |
| Compensation Beads | Used to create single-color controls for accurate spectral compensation. | Setting compensation for a 10+ color panel on a new instrument. |
| FMO Controls | Critical for correctly setting positive population gates, especially for dim markers. | Determining the true positive population for lowly expressed surface receptors. |
The authentication of stem cell lines and their derivatives via flow cytometry demands rigorous panel design. By systematically applying the principles outlined—defining your hypothesis, categorizing markers by antigen density, understanding your instrument, and strategically assigning fluorochromes—researchers can construct panels that are both powerful and precise. Leveraging modern tools to determine antigen density and adhering to fit-for-purpose experimental protocols ensures that the resulting data is reliable and reproducible, forming a solid foundation for critical research and drug development decisions.
Within the broader context of flow cytometry authentication for stem cell lines, the accurate assessment of intracellular markers represents a cornerstone for reliable research outcomes. The transition of human pluripotent stem cells (hPSCs) into differentiated lineages, such as cardiomyocytes (hPSC-CMs), invariably produces heterogeneous cultures, the characterization of which is paramount for disease modeling, drug testing, and personalized medicine [15] [2]. Flow cytometry stands as a powerful tool for this single-cell analysis, offering quantitative, multi-parameter data on population heterogeneity [2]. However, the accuracy of this technique is critically dependent on a rigorously validated sample preparation protocol, particularly for intracellular proteins like cardiac troponin (cTnI and cTnT). Studies reveal significant pitfalls with commonly used antibodies and preparation methods, leading to non-specific binding and inaccurate quantification of cardiomyocyte identity [44] [45]. This Standard Operating Procedure (SOP) is therefore designed within a fit-for-purpose framework, providing a validated methodology for intracellular troponin staining to ensure the generation of robust, reproducible, and reliable data for the scientific community.
Methodological Comparison: Evaluating Sample Preparation and Antibody Performance
The development of a reliable protocol necessitates a systematic comparison of critical variables. The following data summarizes a key investigation into the performance of various anti-troponin antibodies under different sample preparation conditions, using hPSC-CMs and undifferentiated hPSCs as a negative control [44].
Table 1: Performance of Anti-Troponin Antibodies Across Different Sample Preparation Methods [44]
| Antibody Target | Clone | Preparation Method 1 | Preparation Method 2 | Preparation Method 3 | Specificity Score (1-5) |
|---|---|---|---|---|---|
| TNNI3 | 1 | High Non-Specificity | Specific Staining | Specific Staining | 4 |
| TNNI3 | 2 | Specific Staining | Specific Staining | High Non-Specificity | 5 |
| TNNI3 | 3 | Specific Staining | Intermediate | Specific Staining | 5 |
| TNNI3 | 4 | High Non-Specificity | High Non-Specificity | High Non-Specificity | 1 |
| TNNI3 | 5 | Specific Staining | Specific Staining | Specific Staining | 5 |
| TNNT2 | 13-11 | Specific Staining | Specific Staining | High Non-Specificity | 4 |
| TNNT2 | 1C11 | High Non-Specificity | Specific Staining | Specific Staining | 4 |
This comparative analysis highlights that antibody performance is highly dependent on the preparation context. For instance, while Clone 2 for TNNI3 performed excellently in Methods 1 and 2, it showed high non-specificity in Method 3. Similarly, the common TNNT2 clone 13-11 performed well in two methods but failed in a third [44]. This underscores the necessity of a fit-for-purpose validation workflow rather than relying on published antibody clones alone.
A Fit-for-Purpose Protocol Development Workflow
The following workflow diagram outlines the systematic approach for developing and validating a flow cytometry protocol for any intracellular marker, as applied in the development of this SOP.
Experimental Protocols: A Detailed SOP for Intracellular Cardiac Troponin Staining
The following protocol is the outcome of applying the above workflow, resulting in a validated SOP for assessing cardiac troponin T (TNNT2) and I (TNNI3) in hPSC-CM cultures [15] [44]. The procedure is designed for a tube format, starting with cells in a 6-well plate.
Materials and Reagents
Table 2: Essential Research Reagent Solutions for Intracellular Staining [15]
| Reagent Solution | Composition | Function in Protocol |
|---|---|---|
| Liberase/DNase Solution | Liberase-TH + DNase I in DPBS | Enzymatic digestion to dissociate cardiomyocyte monolayers |
| Fixation Solution | 4% Formaldehyde (w/v) in DPBS | Cross-links cellular components to preserve cell structure |
| Flow Buffer 1 | DPBS + 1% BSA + 0.5% Saponin | Permeabilizes cell membranes and blocks non-specific binding |
| Flow Buffer 2 | DPBS + 1% BSA | Washes and resuspends cells post-staining without permeabilization |
Step-by-Step Procedure
I. Cell Collection and Fixation
- Wash: Gently wash the hPSC-CM monolayer in the 6-well plate with 2 mL of Dulbecco's Phosphate Buffered Saline (DPBS), Ca²⁺/Mg²⁺ free.
- Digest: Aspirate DPBS and add 1 mL of pre-warmed Liberase/DNase solution. Incubate at 37°C for 30 minutes, tapping the plate gently to aid cell detachment.
- Dissociate: Add 1 mL of TrypLE Express and incubate at 37°C for 3 minutes. Triturate the cell suspension gently 3 times using a P1000 pipette to create a single-cell suspension.
- Neutralize and Count: Collect cells into 8 mL of growth media in a 15 mL conical tube. Centrifuge at 200 × g for 5 minutes. Aspirate supernatant, resuspend pellet in 6 mL of DPBS, and perform a cell count using trypan blue exclusion. Cell viability should exceed 90%.
- Fix: Aliquot 1×10⁶ cells per 5 mL round-bottom tube. Centrifuge at 200 × g for 5 min, remove supernatant, and resuspend the cell pellet in 100 µL of Fixation Solution by gentle vortexing.
- Incubate: Place tubes on a rocker for 20 minutes at room temperature for gentle agitation.
- Wash: Add 3 mL of DPBS, centrifuge at 200 × g for 3 minutes, and carefully aspirate the supernatant. Repeat this wash step a second time [15].
II. Permeabilization and Antibody Staining
- Permeabilize and Block: Resuspend the fixed cell pellets in 100 µL of Flow Buffer 1. Place tubes on a rocker for 15 minutes. This step permeabilizes the cell membranes and blocks non-specific antibody binding.
- Stain with Antibody: Add the pre-titrated volume of primary antibody (e.g., anti-TNNI3 or anti-TNNT2) directly to the tube. Vortex gently.
- Incubate: Protect the tubes from light and incubate on a rocker for 30 minutes at room temperature.
- Critical Note: Antibody titration and the use of isotype controls are mandatory for validating specificity (see Support Protocol 1 in [15]).
- Wash: Add 3 mL of Flow Buffer 1 to the tube, centrifuge at 200 × g for 3 minutes, and aspirate the supernatant. Repeat this wash step once.
- Resuspend: Resuspend the final cell pellet in 200 - 500 µL of Flow Buffer 2 for flow cytometry analysis [15].
The entire procedure, from cell collection to analysis, can be completed in under 3 hours [44]. The timeline below visualizes the key stages of the experimental workflow.
Discussion: Implications for Stem Cell Research and Authentication
The implementation of a standardized, rigorously validated SOP for intracellular staining, as detailed herein, has profound implications for the field of stem cell research. The demonstrated variability in antibody performance under different fixation and permeabilization conditions [44] provides a clear explanation for the challenges in replicating findings across laboratories. By adopting a fit-for-purpose workflow that mandates the use of relevant negative controls (e.g., undifferentiated hPSCs) and systematic antibody validation, researchers can significantly enhance the accuracy of cell identity assessments [15] [44]. This is particularly crucial for the authentication of stem cell-derived lineages, where functional readouts are directly correlated with cellular purity. Furthermore, the principles outlined in this protocol—careful reagent selection, controlled sample preparation, and rigorous antibody testing—establish a benchmark that can be adapted for the analysis of other intracellular markers in various stem cell-derived populations, thereby strengthening the overall rigor and reproducibility of flow cytometry data in developmental biology and translational medicine.
The field of drug development is undergoing a significant shift from traditional two-dimensional (2D) cell cultures to more physiologically relevant three-dimensional (3D) models, such as organoids and spheroids. These 3D systems preserve the structural integrity and cellular heterogeneity of original patient tumors, providing a more accurate platform for studying drug response and resistance [46] [47]. However, analyzing these complex, densely-packed structures presents unique challenges. Flow cytometry, a cornerstone of single-cell analysis, is being adapted to meet this need. When applied to 3D models, it enables quantitative cell death measurement and detailed phenotypic characterization, bridging the gap between simple cell lines and in vivo studies for more predictive pre-clinical data [48]. This guide explores the practical application of flow cytometry to 3D organoids, providing methodologies, comparative data, and strategic insights for researchers in stem cell and cancer research.
Experimental Protocols: From Organoid Culture to Single-Cell Analysis
Generation and Preparation of Organoid Single-Cell Suspensions
The first critical step for flow cytometric analysis of organoids is the efficient generation of high-quality single-cell suspensions. This process must balance the thorough dissociation of the 3D structure with the preservation of cell viability and surface markers.
- Organoid Culture: Tumor organoids are typically established from patient-derived tissue, circulating tumor cells, or even cell lines. Samples are digested and the resulting cells or cell clusters are embedded in an extracellular matrix (ECM) hydrogel, such as Matrigel or BME, to support 3D growth [47]. The working medium is tailored to the tumor type to maintain genetic stability and mimic the in vivo environment over long-term culture.
- Dissociation for Analysis: For densely-packed organoids, such as glioblastoma organoids (GBOs), a combined approach of enzymatic and mechanical dissociation is required. Organoids are harvested and subjected to enzymatic digestion relevant to the tissue type (e.g., collagenase/hyaluronidase). This is followed by mechanical disruption through vigorous pipetting to achieve a single-cell suspension [48].
- Quality Control: The resulting suspension is passed through a strainer to remove any remaining aggregates. Cell density and viability should be assessed before proceeding to staining, as the dissociation process can be stressful to cells.
A Detailed Flow Cytometry Protocol for Cell Death Analysis
A validated protocol from glioblastoma research provides a robust method for quantifying cell death—a key readout in drug-efficacy studies [48]. The workflow is designed to be reliable and reproducible for large, dense organoids.
Table: Key Reagent Solutions for Organoid Flow Cytometry
| Research Reagent | Function/Application in the Protocol |
|---|---|
| Triton X-100 | A detergent used to permeabilize the cell membrane, allowing the dye to access nuclear DNA. |
| Propidium Iodide (PI) | A fluorescent dye that intercalates into fragmented DNA, marking dead/dying cells. |
| Collagenase/Hyaluronidase | Enzymes used in the digestion process to break down the extracellular matrix of the organoid. |
| ROCK Inhibitor | Added during digestion or plating to improve cell survival and growth efficiency. |
| Extracellular Matrix (ECM) | A hydrogel (e.g., Matrigel, BME) used as a scaffold for 3D organoid growth. |
Diagram: Experimental Workflow for Organoid Cell Death Analysis
The core steps of the staining and analysis protocol are as follows:
- After creating a single-cell suspension, permeabilize the cells with a detergent like Triton X-100.
- Stain the cells with Propidium Iodide (PI). PI enters cells with compromised membranes and binds to fragmented DNA, which is a hallmark of late-stage apoptosis.
- Analyze the samples on a flow cytometer. PI fluorescence is measured, and a hypodiploid "sub-G1" peak is identified, which corresponds to the population of dead cells with degraded DNA [48].
- This method has been validated against other techniques, such as Hoechst staining and lactate dehydrogenase (LDH) release assays, confirming its reliability for quantifying treatment-induced cell death in organoids [48].
Comparative Analysis: Flow Cytometry Platforms for 3D Model Interrogation
The choice of cytometry platform depends heavily on the research question, whether it is focused on measuring a specific endpoint like cell death or conducting deep phenotypic profiling.
Quantitative Comparison of Drug Efficacy in GBOs
Applying the above protocol enables direct comparison of chemotherapeutic agents. The table below summarizes experimental data from a study treating patient-derived GBOs with standard therapies Temozolomide (TMZ) and Lomustine (CCNU) [48].
Table: Cell Death Analysis in Glioblastoma Organoids (GBOs) After Chemotherapy
| Treatment | Duration | Average Cell Death Rate | Key Experimental Insight |
|---|---|---|---|
| Temozolomide (TMZ) | 144 hours | Data not specified | Impact less pronounced than CCNU at the tested concentration. |
| Temozolomide (TMZ) | 288 hours | Up to 63% (varies by GBO population) | Cell death rates surpassed those of the 144-hour treatment. |
| Lomustine (CCNU) | 144 hours | Data not specified | Effect more pronounced than TMZ at the given concentration. |
| Lomustine (CCNU) | 288 hours | Up to 63% (varies by GBO population) | Cell death rates were higher than at 144 hours; effect was more pronounced than TMZ. |
| Key Technical Note | Both biological and technical replicates showed low variability, underscoring the protocol's robustness. |
Navigating the High-Dimensional Cytometry Landscape
For research requiring more than a simple readout, such as identifying complex cellular subpopulations within organoids, several advanced cytometry and analysis platforms are available.
Table: Comparison of High-Dimensional Cytometry Analysis Platforms
| Platform/Algorithm | Core Principle | Key Application in Analysis | Considerations for Use |
|---|---|---|---|
| viSNE [49] | Dimensionality reduction to 2D map. | Visualizing high-dimensional data on a scatter plot where each point is a cell. | Excellent for visualization; cellular phenotypes must be assigned based on marker expression. |
| PhenoGraph [49] | Automated graph-based clustering. | Identifying and quantifying distinct cellular subpopulations without prior gating. | Directly defines cell clusters; requires computational analysis of cluster phenotype and significance. |
| SPADE [49] | Clustering and minimum spanning tree. | Visualizing cellular hierarchy and relationships between clusters. | Shows connections between cell populations; can help understand differentiation trajectories. |
| Mass Cytometry (CyTOF) [49] | Uses metal-tagged antibodies and time-of-flight detection. | Measuring >30 cellular parameters simultaneously with minimal spectral overlap. | Avoids fluorescence spillover issues; requires specialized instrumentation and reagents. |
Diagram: Cytometry Analysis Pathways for Complex Datasets
Panel Design and Technical Considerations for 3D Models
Successfully profiling organoids requires careful experimental design, particularly when building multicolor flow cytometry panels.
- Know Your Instrument: The configuration of your flow cytometer—specifically the number and type of lasers and the filters available—dictates which fluorophores can be used effectively. Always design your panel with your specific instrument in mind [50].
- Match Fluorophore Brightness to Antigen Expression: For low-density antigens or rare cell populations, use bright fluorophores like PE or APC. For highly expressed antigens, dimmer fluorophores are sufficient. This strategy ensures a strong signal-to-background ratio for critical markers [50].
- Minimize Spectral Overlap: Choose fluorophores with little to no emission spectrum overlap whenever possible. When overlap is inevitable, proper fluorescence compensation is critical. This process uses single-stain controls to correct for false-positive signals in adjacent channels, ensuring data accuracy [50].
The integration of flow cytometry with complex 3D organoid models represents a significant advancement in pre-clinical research. This combination leverages the physiological relevance of organoids with the quantitative, single-cell power of flow cytometry, enabling more accurate assessment of drug efficacy, mechanism of action, and resistance patterns. As the field moves towards personalized medicine, the ability to use patient-derived organoids to test therapies and deeply analyze the results with high-dimensional cytometry will be invaluable for translating laboratory findings into effective clinical strategies, ultimately improving patient outcomes.
In the field of flow cytometry authentication of stem cell lines, isolating pure cellular populations is not just a preliminary step but a critical determinant of experimental success. The integrity of downstream genomic, proteomic, and functional analyses hinges entirely on the precision and quality of the initial cell sort. Among the available technologies, Fluorescence-Activated Cell Sorting (FACS) has established itself as a cornerstone technique. However, researchers must navigate a landscape of multiple cell sorting technologies, each with distinct performance characteristics. This guide provides an objective comparison of FACS against prominent alternatives, underpinned by experimental data and detailed protocols, to empower researchers in selecting the optimal tool for authenticating and working with stem cell lines.
The Technology Landscape: A Comparative Analysis
To make an informed choice, scientists must understand the core principles, capabilities, and limitations of each major sorting technology. The following table provides a high-level comparison of FACS, MACS, and the emerging Buoyancy-Activated Cell Sorting (BACS).
Table 1: Core Characteristics of Major Cell Sorting Technologies
| Feature | FACS (Fluorescence-Activated Cell Sorting) | MACS (Magnetic-Activated Cell Sorting) | BACS (Buoyancy-Activated Cell Sorting) |
|---|---|---|---|
| Sorting Principle | Electrostatic deflection of fluorescently-labeled droplets [51] [52] | Column-based retention using antibody-coated magnetic beads [52] [53] | Buoyancy-based separation using microbubbles [52] |
| Throughput & Speed | High-speed (up to ~30,000 events/sec) [51]; process can take several hours [52] | Rapid separation; typically 30+ minutes [52] | Fast; typically 30-60 minutes [52] |
| Multiplexing Capability | High (multiple parameters simultaneously) [52] [53] | Low (typically 1-2 parameters per run) | Adaptable to various targets [52] |
| Cell Viability & Gentleness | Can be harsh on cells due to high pressure [51] [52] | Harsh on membranes of delicate cells [52] | High viability; gentle on cells [52] |
| Typical Purity | High (often >95%) [51] | High | High integrity and viability reported [52] |
| Relative Cost | High (equipment and upkeep) [52] [54] | Middle (equipment and consumables) [52] | Low (no special equipment needed) [52] |
| Key Applications in Stem Cell Research | Isolation of rare stem cell populations, single-cell sorting for genomics, complex immunophenotyping | Bulk isolation of specific cell types, sample enrichment, negative selection | Cell enrichment, negative selection, cleaning samples of dead cells or RBCs [52] |
The market for these technologies is growing steadily, driven by demand in biotechnology and pharmaceutical research. The global cell sorting market, valued at approximately USD 261-269 million in 2024, is projected to grow at a compound annual growth rate (CAGR) of 7.0% to 9.2%, reaching up to USD 681 million by 2035 [55] [56] [54]. Reagents and consumables dominate the product share, accounting for over 60% of revenue, underscoring the recurring application of these techniques [55] [56].
Quantitative Performance Data in Research Applications
Beyond principle, the practical performance of a sorter is measured by its purity, yield, and viability. The following table summarizes key metrics from recent research applications.
Table 2: Experimental Performance Data of Cell Sorting Technologies
| Technology | Reported Purity | Reported Cell Viability | Key Application Context (Cell Type) | Source/Reference |
|---|---|---|---|---|
| FACS (Electrostatic) | >95% [51] | Not specified (Viability depends on cell type and pressure) | Human T cells (CD4+, CD8+) from PBMCs [51] | Research Publication [51] |
| FACS (Droplet Microsystem) | 91% and 85% for MCF-7 cells | >95% | MCF-7 breast cancer cells [54] | Research Publication [54] |
| MACS | High (specific % not always quantified) | Viability can be affected, especially for delicate cells [52] | CD34+ hematopoietic stem and progenitor cells [53] | Manufacturer & User Reports [52] [53] |
| BACS | High integrity and viability reported [52] | High viability and integrity [52] | Delicate primary cells, stem cells [52] | Manufacturer Data [52] |
Experimental Protocols for Stem Cell Authentication
For researchers in stem cell biology, the application of these technologies is critical. The workflow below outlines the key steps for using FACS to authenticate and isolate pluripotent stem cell populations, a common requirement for ensuring line integrity.
Diagram 1: FACS Workflow for Pluripotent Stem Cell Isolation
Detailed FACS Protocol for iPSC Characterization
The following protocol is adapted from high-throughput methods used for characterizing induced Pluripotent Stem Cells (iPSCs) [57].
- Sample Preparation: Harvest and dissociate iPSCs into a single-cell suspension. Accutase or enzyme-free dissociation buffers are preferred to preserve surface epitopes.
- Staining Cocktail Preparation: Prepare antibodies in a FACS buffer (e.g., PBS with 1-2% FBS). Key markers for pluripotency include:
- SSEA-4 and TRA-1-60 (Positive markers for pluripotency)
- SSEA-1 (A marker of differentiation; should be negative in pure pluripotent populations) [57].
- Staining Procedure:
- Transfer 100 µL of cell suspension (1x10^6 to 1x10^7 cells/mL) into FACS tubes [1].
- Add the appropriate fluorophore-conjugated monoclonal antibodies (typically 5-20 µL per test) as per manufacturer instructions [1].
- Include a tube with fluorescently-conjugated isotype control antibodies.
- Add a viability dye, such as propidium iodide (PI) or 7AAD, to exclude non-viable cells from the analysis and sort [1].
- Incubate at 2-8°C or on ice for 30 minutes in the dark [1].
- Wash cells with 1 mL of PBS, pour off the supernatant, and resuspend the pellet in 100-500 µL of ice-cold sorting buffer or PBS [1].
- FACS Gating and Sorting:
- Gate on Leukocytes: Create a dot plot of Forward Scatter (FSC) vs. Side Scatter (SSC) and gate to exclude cellular debris and red blood cells [1].
- Gate on Live Cells: Create a dot plot of FSC vs. the viability dye signal, and gate to exclude dead cells (which are positive for the dye) [1].
- Gate on Pluripotent Cells: On the gated live cell population, apply sequential gates to identify cells that are SSEA-4 positive, TRA-1-60 positive, and SSEA-1 negative [57].
- Sort Collection: Set the sorter to sort the target population into collection tubes containing an appropriate culture medium. For single-cell genomics, sort directly into lysis buffer or PCR tubes.
The Scientist's Toolkit: Essential Reagents for FACS-based Stem Cell Sorting
Table 3: Key Research Reagent Solutions for Stem Cell Sorting
| Reagent / Material | Function | Example Application in Stem Cell Research |
|---|---|---|
| Fluorophore-Conjugated Antibodies | Label specific cell surface or intracellular markers for detection. | Anti-SSEA-4, TRA-1-60 (pluripotency); anti-SSEA-1 (differentiation); anti-CD184 (definitive endoderm) [57]. |
| Viability Dye | Distinguish and exclude dead cells from the analysis and sort. | Propidium Iodide (PI), 7AAD, or cell membrane integrity dyes. Critical for obtaining viable cultures post-sort [1] [57]. |
| Cell Dissociation Reagent | Generate a single-cell suspension from adherent cultures. | Accutase, Trypsin-EDTA, or enzyme-free dissociation buffers. Choice affects epitope integrity and cell health. |
| FACS / Sorting Buffer | Maintain cell viability and prevent clumping during sort. | PBS supplemented with 1-2% Fetal Bovine Serum (FBS) or Bovine Serum Albumin (BSA), and sometimes EDTA. |
| Collection Medium | Receive and sustain sorted cells for downstream applications. | Rich culture medium (e.g., mTESR for iPSCs) often with higher serum or additives to support recovery. |
The choice between FACS, MACS, and emerging technologies like BACS is not a matter of identifying a single superior technology, but of matching the tool to the specific research question and experimental constraints. For the flow cytometry authentication of stem cell lines, FACS remains the gold standard when high-resolution, multi-parameter sorting of complex populations is required—such as isolating a pristine pluripotent population based on multiple surface markers. Its ability to provide high purity and its compatibility with single-cell downstream applications are unmatched. However, MACS offers a compelling alternative for faster, more cost-effective bulk isolations or for pre-enrichment prior to FACS. BACS presents itself as a very gentle and accessible option, particularly attractive for labs without access to sophisticated FACS infrastructure or when working with exceptionally fragile cells. Ultimately, a deep understanding of the comparative data and protocols empowers researchers to strategically implement these powerful technologies, ensuring the isolation of pure cell populations that underpin reliable and reproducible scientific discovery.
Solving Common Problems: An Expert Flow Cytometry Troubleshooting Guide
In stem cell research, the authentication of cell lines relies heavily on the precise detection of specific surface and intracellular markers to confirm pluripotency and lineage commitment. Flow cytometry serves as a powerful tool for this purpose, offering high-throughput, multi-parameter analysis at single-cell resolution [2]. However, a weak or absent fluorescent signal can compromise data integrity, leading to inaccurate assessment of stem cell quality and differentiation status. Such signal failures can originate from multiple points in the experimental workflow, ranging from reagent preparation to instrument configuration [58] [59]. This guide systematically compares the common pitfalls in flow cytometry experiments aimed at stem cell characterization and provides validated, comparative solutions to ensure the reliable data essential for rigorous research and drug development.
Comparative Analysis of Signal Failure Causes and Solutions
The following tables consolidate the primary causes and recommended solutions for weak or no signal, as identified through standardized troubleshooting protocols. The experimental data supporting these recommendations were derived from consistent validation practices, including antibody titration curves, instrument performance checks with calibration beads, and controlled comparisons of cell preparation methods [58] [60] [61].
Table 1: Reagent and Staining-Related Causes and Solutions
| Cause of Weak/No Signal | Comparative Solution & Experimental Rationale | Key Experimental Controls |
|---|---|---|
| Suboptimal Antibody Concentration [58] [59] [60] | Antibody Titration: A serial dilution series (e.g., 8-12 points) identifies the concentration yielding the highest signal-to-noise ratio [60]. Excess antibody causes high background, while insufficient antibody fails to saturate binding sites [60]. | Use antigen-expressing cells for titration; calculate optimal concentration from the dilution that maximizes the separation index between positive and negative populations [60]. |
| Inaccessible Intracellular Target [58] [59] [61] | Optimized Permeabilization: For nuclear antigens, vigorous detergents (e.g., 0.1–1% Triton X-100) are required. For cytoplasmic targets, milder agents (e.g., 0.1-0.5% Saponin) are sufficient [58]. Alcohol permeabilization is an alternative but may damage some epitopes [58]. | Include a control antibody for a well-characterized intracellular antigen (e.g., a transcription factor like NANOG in iPSCs) to confirm permeabilization efficacy [3]. |
| Low Antigen Expression or Secretion [58] [59] [62] | Golgi-Blocking Agents: Use Brefeldin A or monensin to trap secreted proteins (e.g., cytokines) within the cell [58] [59]. For low-expression markers, pair with the brightest fluorochromes (e.g., PE, APC) [58] [61]. | Use a positive control cell line known to express the target antigen at high levels. An FMO control is essential for accurate gating of dim populations [58] [61]. |
| Antibody Degradation or Fluorochrome Fading [59] [62] | Proper Storage and Handling: Protect conjugated antibodies from light and follow manufacturer storage instructions. Tandem dyes are particularly sensitive to prolonged fixation and light exposure [58]. | Include a positive control stain with an antibody known to be functional to rule out general reagent failure [62]. |
Table 2: Instrument and Protocol-Related Causes and Solutions
| Cause of Weak/No Signal | Comparative Solution & Experimental Rationale | Key Experimental Controls |
|---|---|---|
| Laser Misalignment or Incorrect PMT Settings [59] [62] [61] | Instrument Calibration: Regularly run calibration beads to check laser alignment and PMT performance. Ensure the PMT voltage is set appropriately for the fluorochrome's emission spectrum [58] [59]. | Use calibration beads and single-stained controls for each fluorochrome to verify instrument performance and set appropriate voltages before running experimental samples [58]. |
| Signal Compensation Errors [58] [62] | Accurate Compensation Controls: Use single-stained controls (cells or beads) with a high number of events (>5,000) for each fluorochrome. This allows the software to accurately calculate and subtract spectral overlap [58]. | Fluorescence-minus-one (FMO) controls help determine the extent of spillover spreading and are critical for setting gates for dimly positive populations [58]. |
| Loss of Surface Antigen [58] [59] [62] | Cold Staining with Sodium Azide: Perform all staining steps on ice with cold buffers. Adding sodium azide (0.09-0.1%) prevents the internalization and modulation of surface antigens [58] [59]. | For adherent stem cells (e.g., iPSCs), compare gentle dissociation enzymes with trypsin, which can cleave certain surface epitopes [59]. |
| Presence of Dead Cells [58] [61] | Viability Dye Staining: Gate out dead cells using dyes like DAPI, PI, 7-AAD, or fixable viability dyes. Dead cells exhibit high autofluorescence and non-specific antibody binding, obscuring specific signal [58] [61]. | Always include an unstained control and a viability dye-only control to properly set gates for live cells. |
Experimental Protocols for Signal Optimization
Basic Protocol: Antibody Titration for Optimal Signal-to-Noise Ratio
The following protocol, adapted from current best practices, is essential for assay optimization and ensures reliable, reproducible results [60].
- Cell Preparation: Use a positive control cell line known to express the target antigen (e.g., human iPSCs for pluripotency markers). Prepare a single-cell suspension at a concentration of 2 × 10^6 cells/mL in staining buffer [60].
- Antibody Dilution Series:
- Calculate the antibody stock concentration. For antibodies labeled in mg/mL, begin the dilution series at 1000 ng/test. For those labeled in μL/test, start at double the recommended volume/test [60].
- In a 96-well V-bottom plate, perform an 8- to 12-point serial dilution of the antibody in staining buffer, with each dilution in a final volume of 150-250 μL [60].
- Staining Procedure:
- Add 100 μL of cell suspension (2 × 10^5 cells) to each well of the titration series.
- Mix gently and incubate for 20 minutes at room temperature in the dark, consistent with the intended staining protocol.
- Centrifuge the plate at 400 × g for 5 minutes, decant the supernatant, and blot on a paper towel.
- Wash the cells twice with 200 μL of staining buffer.
- Resuspend the final pellet in a suitable volume of buffer for acquisition [60].
- Data Analysis and Optimal Titer Selection:
- Acquire data on a flow cytometer, ensuring to collect a sufficient number of events.
- For each dilution, plot the median fluorescence intensity (MFI) of the positive population and the background (negative) signal.
- Calculate the staining index (SI) or signal-to-noise ratio for each dilution: SI = (MFIpositive - MFInegative) / (2 × SD_negative).
- The optimal antibody titer is the concentration that yields the highest staining index, saturating the binding sites with minimal excess antibody [60].
Basic Protocol: Intracellular Staining of Pluripotency Markers in iPSCs
This protocol outlines a cost-effective method for defining the pluripotency status of human induced pluripotent stem cells (iPSCs) by flow cytometry, combining surface and intracellular marker analysis [3].
- iPSC Culture and Collection: Culture iPSCs using standard feeder-free or feeder-dependent conditions. For collection, use a gentle cell dissociation reagent to generate a single-cell suspension. Avoid trypsin if it is known to cleave the surface epitopes of interest [59] [3].
- Surface Staining:
- Resuspend up to 1 × 10^6 cells in ice-cold flow staining buffer.
- Add fluorochrome-conjugated antibodies against surface pluripotency markers (e.g., TRA-1-60, SSEA-4). Include an Fc receptor blocking step if needed.
- Incubate for 20-30 minutes on ice in the dark.
- Wash cells with 2 mL of ice-cold buffer and centrifuge [3].
- Fixation and Permeabilization:
- Fix cells using 1-4% methanol-free formaldehyde for 15-30 minutes at room temperature. Note that over-fixation can diminish fluorescence signal [61].
- Centrifuge and thoroughly decant the fixative.
- Permeabilize cells using a detergent-based permeabilization buffer (e.g., containing 0.1% Triton X-100 for nuclear targets like NANOG or SOX2, or 0.5% Saponin for cytoplasmic targets) for 15-30 minutes [58] [3].
- Intracellular Staining:
- Without washing, add fluorochrome-conjugated antibodies against intracellular targets directly to the permeabilization buffer. Use low molecular weight fluorochromes (e.g., Alexa Fluor dyes) for better penetration.
- Incubate for 30-60 minutes at room temperature in the dark.
- Wash cells twice with permeabilization buffer, then once with standard staining buffer.
- Resuspend in buffer for acquisition [3].
- Acquisition and Analysis: Acquire data on a flow cytometer. Use appropriate FMO and isotype controls to set gates. A bona fide undifferentiated iPSC population should show high, homogeneous expression of core pluripotency markers [3].
Workflow Visualization
The following diagnostic pathway synthesizes the primary causes and solutions into a logical workflow for researchers troubleshooting weak or no signal in their flow cytometry experiments.
Flow Cytometry Signal Troubleshooting Workflow
The Scientist's Toolkit: Essential Reagents and Materials
Table 3: Key Research Reagent Solutions for Flow Cytometry
| Item | Function in Experiment | Application Notes for Stem Cell Research |
|---|---|---|
| Fc Receptor Blocking Reagent [58] [61] | Reduces non-specific background staining by blocking Fc receptors on cells, preventing antibody binding via the Fc region. | Critical when working with immune cells or stem cells that may express Fc receptors. Should be used prior to antibody staining [58]. |
| Viability Dyes (e.g., PI, 7-AAD, DAPI) [58] [61] | Distinguishes live cells from dead cells. Dead cells are highly autofluorescent and bind antibodies non-specifically, so gating them out is essential for clean data. | Use fixable viability dyes for experiments involving intracellular staining, as they withstand fixation/permeabilization steps [61]. |
| Cell Permeabilization Buffers [58] [61] | Allows antibodies to access intracellular targets by disrupting the cell membrane. Different types are required for different targets. | Mild Detergents (Saponin): For cytoplasmic antigens. Strong Detergents (Triton X-100): For nuclear antigens. Methanol: A vigorous alternative, but can destroy some epitopes and reduce fluorescence of PE/APC conjugates [58]. |
| Golgi-Blocking Agents (Brefeldin A) [58] [59] | Inhibits protein transport from the endoplasmic reticulum to the Golgi apparatus, trapping secreted proteins (e.g., cytokines) inside the cell. | Necessary for the detection of secreted factors in stem cell cultures or during differentiation studies [58]. |
| Compensation Beads [58] | Uniform particles that bind antibodies, used to create single-stained controls for accurate fluorescence compensation. | More consistent than using cells for compensation controls, leading to more reliable calculation of spectral overlap [58]. |
| Antibody Capture Beads [58] | Used for validation and titration of antibodies, ensuring specific binding and optimal concentration. | Useful for checking new antibody lots or validating antibodies before using precious stem cell samples [58]. |
In flow cytometry authentication of stem cell lines, high background and non-specific staining pose significant challenges to data accuracy and interpretation. These artifacts can obscure genuine signals, leading to misidentification of cell populations and compromising experimental reproducibility. For researchers, scientists, and drug development professionals, implementing robust strategies to mitigate these issues is essential for generating high-quality, publication-ready data. This guide objectively compares the performance of Fc receptor blocking reagents and viability dyes—two critical tools for reducing non-specific staining—based on current experimental data and standardized protocols. Within the broader context of stem cell authentication, proper application of these techniques ensures accurate phenotyping of pluripotent stem cell derivatives and reliable assessment of differentiation efficiency.
Fc Receptor-Mediated Binding
Fc receptors (FcRs) present on various immune cells and some stem cell derivatives can bind the constant region (Fc) of antibodies independently of their antigen-specific variable regions. This non-specific interaction leads to false-positive signals and increased background. The extent of this binding depends on multiple factors, including Fc receptor expression levels, antibody host species, and antibody isotype [63].
CD64 (FcγRI), a high-affinity Fc receptor, binds monomeric IgG with affinities as low as 10^-8 M, making it a primary concern for flow cytometry. In contrast, low-affinity Fc receptors like CD16 and CD32 typically require immune complexes for meaningful binding, with affinities in the 10^-5 to 10^-6 M range [64]. For human cells stained with mouse antibodies, Fc-mediated binding is particularly problematic due to the strong interaction between mouse antibodies and human Fc receptors [63].
Non-Specific Binding in Dead Cells
Dead cells exhibit increased non-specific antibody binding and autofluorescence due to compromised membrane integrity. This occurs because:
- Permeabilized membranes allow antibodies to access intracellular components non-specifically
- The release of cellular contents, including DNA, creates sticky matrices that trap antibodies
- Alterations in surface charge and chemistry increase hydrophobic interactions [65]
These effects are especially problematic in stem cell cultures where differentiation protocols may inherently reduce viability, and accurate identification of specific cell populations is crucial for authentication.
Dye-Dye Interactions and Tandem Degradation
In highly multiplexed panels, certain fluorophore classes are prone to specific interactions that generate artifactual signals:
- Brilliant dyes, NovaFluors, and Qdots can engage in dye-dye interactions when multiple reagents from the same family are used simultaneously, creating correlated emission patterns that may be misassigned to different markers [63]
- Tandem fluorophores are susceptible to breakdown into constituent fluorophores, causing signals to be misassigned to incorrect channels [63]
Fc Blocking Reagents: Comparative Performance
Mechanism of Fc Blocking
Fc blocking reagents work by saturating Fc receptors with inert antibodies, antibody fragments, or serum immunoglobulins, preventing subsequent binding of staining antibodies via their Fc regions. This preserves specific binding through the antibody variable regions while eliminating non-specific Fc-mediated interactions [63] [64].
Figure 1: Fc Blocking Mechanism - Comparing experimental outcomes with and without Fc blocking reagents
Comparative Performance of Fc Blocking Reagents
Table 1: Performance Comparison of Fc Blocking Reagents
| Blocking Reagent | Mechanism | Recommended Application | Experimental Performance | Limitations |
|---|---|---|---|---|
| Anti-CD16/32 (2.4G2) | Monoclonal antibody blocking mouse CD16/32 | Mouse lymphoid tissues | Minimal effect on mouse splenocytes with properly titrated antibodies [64] | Less effective for high-affinity FcγRI (CD64); limited efficacy with rat antibodies [64] |
| Species-Matched Serum | Polyclonal immunoglobulins block multiple Fc receptors | Broad application, especially intracellular staining | Superior blocking of non-specific binding to macrophages compared to anti-CD16/32 [64] | Interferes with staining for immunoglobulins; potential introduction of new specificities [63] |
| Commercial Fc Block (BD, BioLegend) | Proprietary formulations often containing anti-CD16/32 | Human blood samples; standard surface staining | Effective reduction of non-specific binding in human PBMCs, especially with overnight staining [63] | May contain azide (toxic for functional assays); potential interference with IgG staining [64] |
| FcX (BioLegend) | Commercial proprietary blocking reagent | Human cells; challenging staining conditions | Effective for human PBMCs, but may reduce specific staining for IgG [64] | Contains human IgG, which may neutralize some anti-IgG reagents [64] |
| Mouse Serum | Polyclonal mouse immunoglobulins | Blocking mouse cells or mouse-origin antibodies on human cells | Effective blocking performance comparable to FcX in human PBMC experiments [64] | Not suitable for staining mouse immunoglobulins [63] |
Experimental Data on Fc Blocking Efficacy
Experimental comparisons demonstrate significant variability in blocking efficacy depending on cell type and staining conditions:
Mouse vs. Human Cells: In mouse splenocytes, anti-CD16/32 blocking shows minimal effects when antibodies are properly titrated, as most anti-mouse antibodies are rat-derived and bind poorly to mouse Fc receptors. In contrast, human PBMCs consistently benefit from Fc blocking due to stronger interactions between mouse antibodies and human Fc receptors [64].
Staining Conditions: Overnight intracellular staining demonstrates more pronounced benefits from Fc blocking compared to standard surface staining, with commercial blocking reagents (FcX) and species-matched serum performing equally well or better than anti-CD16/32 [64].
Cell-Type Specific Effects: Macrophages and other CD64-expressing cells show the most significant improvement with Fc blocking, with mouse serum outperforming anti-CD16/32 for these populations [64].
Viability Dyes: Comparative Performance
Mechanisms of Viability Staining
Viability dyes exploit the differential membrane integrity of live and dead cells through two primary mechanisms:
DNA-binding dyes (Propidium Iodide, 7-AAD, DAPI) penetrate dead cells with compromised membranes and intercalate with DNA, producing bright fluorescence. These work well for unfixed samples but cannot be used after fixation [65].
Amine-reactive dyes (Zombie, Live/Dead Fixable dyes) bind freely available amines on proteins. Live cells label only on surface proteins, while dead cells label extensively intracellularly, creating a brightness differential that persists after fixation [65].
Figure 2: Viability Dye Mechanism - Differential staining of live versus dead cells based on membrane integrity
Comparative Performance of Viability Assessment Methods
Table 2: Performance Comparison of Viability Assessment Methods for Flow Cytometry
| Method | Principle | Compatibility with Fixation | Signal Stability | Limitations |
|---|---|---|---|---|
| DNA-binding Dyes (PI, 7-AAD) | Membrane integrity/DNA binding | Not compatible (cannot use after fixation) | Stable until analysis | Limited to fresh samples; can stain fixed cells non-specifically [65] |
| Amine-reactive Dyes (Zombie, Live/Dead) | Protein amine accessibility | Compatible (differential staining preserved) | Stable long-term after fixation | Requires pre-fixation staining; more expensive [65] |
| Enzyme-based Assays (LDH release) | Release of cytoplasmic enzymes | Not applicable to fixed cells | Requires careful timing | High background in untreated samples; interference from nanoparticles [66] |
| Morphological Assessment | Light scatter properties | Compatible | Subject to interpretation | Altered by fixation; poor specificity for death [66] |
| Dye Exclusion (Trypan Blue) | Membrane integrity | Not compatible | Requires immediate reading | Short staining window; underestimates death [66] |
Experimental Data on Viability Dye Performance
Fixation Compatibility: Amine-reactive viability dyes maintain the differential between live and dead cells after fixation with formaldehyde, allowing for intracellular staining protocols without loss of viability information [65].
Background Reduction: Proper use of viability dyes reduces background fluorescence by 20-50% by enabling exclusion of dead cells from analysis, significantly improving detection of weakly expressed markers [65].
Temporal Stability: DNA-binding dyes like propidium iodide require careful timing as continued cell death during staining increases positive populations, while amine-reactive dyes capture a snapshot of viability at the time of staining [65].
Integrated Experimental Protocols
Surface Staining with Fc Block and Viability Dye
This optimized protocol for high-parameter flow cytometry incorporates both Fc blocking and viability staining for surface antigen detection [63]:
Materials:
- Mouse serum (Thermo Fisher, cat. no. 10410)
- Rat serum (Thermo Fisher, cat. no. 10710C)
- Brilliant Stain Buffer (Thermo Fisher, cat. no. 00-4409-75)
- Amine-reactive viability dye (choose channel compatible with panel)
- FACS buffer (PBS with 0.5-1% BSA and optional 2-5 mM EDTA)
- Antibody cocktail
Procedure:
- Prepare single cell suspension and count cells. Include DNase (10-100 μg/mL) in digestion buffers to prevent clumping from released DNA.
- Resuspend cells at 10-50 × 10^6 cells/mL in FACS buffer containing amine-reactive viability dye at recommended dilution. Incubate 20 minutes at room temperature in dark.
- Wash cells with 3-5× staining volume of FACS buffer. Centrifuge at 300-400 × g for 5 minutes.
- Prepare blocking solution: 30% mouse serum, 30% rat serum, 1:1000 tandem stabilizer in FACS buffer.
- Resuspend cell pellet in blocking solution (20 μL per 10^6 cells). Incubate 15 minutes at room temperature in dark.
- Prepare surface staining master mix containing antibodies, 30% Brilliant Stain Buffer, and tandem stabilizer in FACS buffer.
- Add 100 μL staining mix per 10^6 cells without washing out blocking solution. Mix gently by pipetting.
- Incubate 1 hour at room temperature in dark (or 30 minutes on ice for sensitive antigens).
- Wash twice with 2-3 mL FACS buffer. Centrifuge at 300-400 × g for 5 minutes.
- Resuspend in FACS buffer containing tandem stabilizer (1:1000) for acquisition.
- Include compensation controls and unstained cells.
Intracellular Staining Protocol for Stem Cell Derivatives
This protocol, optimized for hPSC-derived cardiomyocytes, incorporates an additional blocking step after permeabilization to reduce non-specific binding to newly exposed epitopes [15]:
Materials:
- Intracellular Fixation & Permeabilization Buffer Set (Thermo Fisher, cat. no. 88-8824) or Foxp3/Transcription Factor Staining Buffer Set (Thermo Fisher, cat. no. 00-5523)
- Permeabilization buffer (1X)
- Species-matched serum for blocking (match antibody host species)
- Primary antibodies for intracellular targets
Procedure:
- Complete surface staining and viability staining as in Basic Protocol 1, including Fc blocking.
- After final surface staining wash, fix cells using IC Fixation Buffer (100 μL per 10^6 cells). Incubate 20-60 minutes at room temperature in dark.
- Wash twice with 2 mL 1X Permeabilization Buffer. Centrifuge at 400-600 × g for 5 minutes.
- Resuspend cells in 100 μL 1X Permeabilization Buffer containing 2% species-matched serum. Incubate 15 minutes at room temperature for blocking.
- Add intracellular antibodies directly to blocking solution without washing. Use titrated concentrations determined in support protocols.
- Incubate 30-60 minutes at room temperature in dark.
- Wash twice with 2 mL 1X Permeabilization Buffer.
- Resuspend in Flow Cytometry Staining Buffer for acquisition.
Titration and Validation Protocols
Antibody Titration Support Protocol [15]:
- Prepare a single cell suspension of positive and negative control cells (e.g., hPSC-CMs and undifferentiated hPSCs).
- Perform 2-fold serial dilutions of antibody in FACS buffer, typically covering 8 concentrations from 1:50 to 1:6400.
- Stain cells with each dilution using standard protocol.
- Analyze by flow cytometry and calculate staining index: (Medianpositive - Mediannegative) / (2 × SD_negative).
- Select the concentration that provides the highest staining index without increasing background.
Specificity Validation [15]:
- Include isotype controls at matched concentrations to antibody staining.
- Use genetic controls (KO cells) if available.
- Employ competing peptides for peptide-based antibodies.
- Compare staining patterns across related cell types with known expression profiles.
The Scientist's Toolkit: Essential Research Reagents
Table 3: Essential Reagents for Reducing Background in Stem Cell Flow Cytometry
| Reagent Category | Specific Examples | Function | Application Notes |
|---|---|---|---|
| Fc Blocking Reagents | Anti-CD16/32 (2.4G2), species-matched serum, commercial Fc blocks | Reduce non-specific antibody binding via Fc receptors | Species-matched serum often outperforms anti-CD16/32 for CD64+ cells [64] |
| Viability Dyes | PI, 7-AAD, Zombie dyes, Live/Dead fixable dyes | Identify dead cells for exclusion from analysis | Amine-reactive dyes preserve viability information after fixation [65] |
| Tandem Stabilizers | BioLegend Tandem Stabilizer | Prevent degradation of tandem fluorophores | Essential for panels containing PE-Cy5, APC-Cy7, and other tandems [63] |
| Brilliant Stain Buffers | BD Horizon Brilliant Stain Buffer Plus | Prevent polymer dye interactions | Required for panels containing SIRIGEN Brilliant or Super Bright dyes [63] |
| Permeabilization Buffers | Intracellular Fixation & Permeabilization Buffer Set, Foxp3/Transcription Factor Buffer Set | Enable antibody access to intracellular antigens | Different buffer systems optimized for cytoplasmic vs. nuclear targets [67] |
| Blocking Serums | Normal mouse, rat, human serum | Block non-specific interactions | Match serum species to antibody host species for most effective blocking [63] |
Implementation Strategies for Stem Cell Authentication
Optimized Gating Strategies
Implement sequential gating to properly identify viable, single cells of interest:
- Viability gate: Use amine-reactive dye to exclude dead cells
- Single cells gate: Use FSC-H vs FSC-A to exclude doublets
- Lineage gate: Use cell-type specific markers to identify target population
- Analysis gate: Assess expression of differentiation markers
This approach is particularly important for hPSC derivatives where differentiation efficiency varies and populations are often heterogeneous [15].
Panel Design Considerations
- Viability dye selection: Choose channels not occupied by critical lineage markers
- Compensation planning: Include viability dyes in compensation controls
- Tandem dye stability: Incorporate stabilizers and avoid excessive light exposure
- Blocking strategy: Pre-incubate with Fc block or include in staining mixture based on experimental needs
Troubleshooting High Background
- Persistent high background after Fc blocking: Increase serum concentration to 5-10% or try different blocking reagents
- High viability dye background: Titrate dye concentration and ensure consistent staining time
- Increased background after fixation: Add extra protein (BSA or serum) to permeabilization buffers
- Cell clumping: Increase DNase concentration in preparation buffers and filter cells before acquisition
Effective reduction of background and non-specific staining through appropriate Fc blocking and viability dye application is essential for reliable flow cytometry authentication of stem cell lines. The experimental data presented demonstrates that species-matched serum often provides superior blocking compared to anti-CD16/32 alone, particularly for intracellular staining and when working with CD64-expressing cells. Similarly, amine-reactive viability dyes offer significant advantages for fixed cell applications common in stem cell differentiation analysis. By implementing the standardized protocols and reagent comparisons outlined in this guide, researchers can significantly improve data quality, enhance reproducibility, and generate more accurate authentication of pluripotent stem cell derivatives for both basic research and drug development applications.
Optimizing Fixation and Permeabilization for Intracellular Targets
In stem cell research, the authentication of cell lines relies heavily on the precise identification of intracellular markers, from key transcription factors to lineage-specific proteins. The processes of fixation and permeabilization are foundational to this endeavor, as they preserve cellular architecture and provide antibody access to internal targets. However, these chemical treatments present a significant challenge: they can alter or destroy the very epitopes and fluorescent labels researchers aim to detect [68] [69] [70]. This guide objectively compares the performance of different fixation and permeabilization methods, providing structured experimental data and protocols to empower researchers in selecting the optimal approach for their work in flow cytometry authentication of stem cell lines.
Method Comparison: Core Techniques and Performance Data
The choice of fixation and permeabilization method is dictated by the localization and sensitivity of the target antigen, as well as the compatibility with required fluorophores. The table below summarizes the key characteristics of the most common reagents.
Table 1: Comparison of Common Fixation and Permeabilization Methods
| Method | Mechanism of Action | Best For Antigens In | Key Advantages | Key Limitations |
|---|---|---|---|---|
| Aldehyde-based (e.g., Formaldehyde/PFA) [69] | Creates cross-links between protein lysine residues. | Cell surface; some cytoplasmic [71]. | Preserves cellular structure well; allows for long-term storage [69]. | Can mask epitopes; may generate autofluorescence [69]. |
| Alcohol-based (e.g., Methanol) [69] [72] | Dehydrates samples, precipitating proteins. | Cytoskeletal; viral; some nuclear [71]. | Excellent for many intracellular targets; also permeabilizes; fixed samples can be stored long-term [72] [71]. | Can destroy epitopes of surface markers and sensitive fluorescent proteins [68] [72]. |
| Detergent-based (e.g., Saponin) [69] [71] | Creates pores in membranes by binding cholesterol. | Cytoplasm; cytoplasmic face of the plasma membrane [71]. | Does not alter surface antigen epitopes; reversible pores allow for sequential staining [72] [71]. | Pores require detergent in all subsequent buffers; harsher detergents can lyse cells [72] [71]. |
The performance of these methods is further complicated by their impact on fluorophores. A critical consideration for panel design is that many tandem dyes and some core fluorophores are sensitive to harsh treatments.
Table 2: Fluorophore Compatibility with Methanol Treatment [72]
| Methanol Sensitive | Methanol Resistant |
|---|---|
| FITC | PE (Phycoerythrin) |
| eFluor 450 | APC (Allophycocyanin) |
| eFluor 660 | Alexa Fluor 647 |
| Alexa Fluor 488 | |
| PerCP (Peridinin-chlorophyll-protein complex) | |
| All tandem dyes |
Detailed Experimental Protocols
To ensure reproducible and high-quality results, adherence to standardized protocols is essential. The following are detailed methodologies for key applications.
Basic Protocol: Combined Surface and Intracellular Staining
This is a standard two-step protocol for detecting cytoplasmic proteins and cytokines, adapted from general best practices [71] [67].
Materials:
- Single-cell suspension
- Flow cytometry staining buffer (e.g., PBS with 1-5% FCS)
- Antibodies against surface markers
- Fixative (e.g., 1-4% PFA)
- Permeabilization buffer (e.g., 0.1% Saponin in PBS or commercial buffer)
- Antibodies against intracellular targets
Procedure:
- Surface Staining: Harvest and wash cells. Resuspend the cell pellet in staining buffer containing antibodies against surface markers. Incubate for 20-60 minutes on ice or at 4°C in the dark [71] [67].
- Fixation: Wash cells to remove unbound surface antibodies. Resuspend the cell pellet in fixative (e.g., 100-200 µL of 1-4% PFA) and incubate for 15-20 minutes on ice [71] [67].
- Permeabilization: Wash cells twice. Resuspend the cell pellet in permeabilization buffer for 10-15 minutes at room temperature [71].
- Intracellular Staining: Centrifuge cells and discard supernatant. Resuspend the cell pellet in 100 µL of permeabilization buffer and add antibodies against intracellular targets. Incubate for 20-60 minutes at room temperature in the dark [67].
- Acquisition: Wash cells twice with permeabilization buffer, then once with standard staining buffer. Resuspend in an appropriate volume of staining buffer and analyze by flow cytometry [67].
Specialized Protocol: Multi-Pass Flow Cytometry via Optical Barcoding
For targets highly sensitive to fixation/permeabilization, such as fluorescent proteins (FPs) or methanol-sensitive epitopes, a novel multi-pass approach overcomes traditional limitations [68] [70].
Workflow Overview: This workflow uses laser particles (LPs) as optical barcodes to track individual cells through sequential measurements.
Key Experimental Steps from Multi-Pass Phospho-Flow Protocol [68]:
- Stimulation & Fixation: Cells (e.g., hPBMCs) are stimulated and then fixed with formaldehyde.
- Barcoding: Fixed cells are stained with biotinylated antibodies against ubiquitous surface markers (e.g., CD45, β2-microglobulin), then incubated with streptavidin-coated laser particles (LP) at a 10:1 LP-to-cell ratio.
- First Pass Measurement: Cells are stained with a surface antibody panel and acquired on a specialized multi-pass flow cytometer to measure these stable markers.
- Harsh Processing: The captured cells are then treated with ice-cold methanol for 30 minutes to permeabilize them.
- Second Pass Measurement: Cells are stained for intracellular targets (e.g., p-ERK1/2) and acquired a second time. Data from both passes are combined for each cell using its unique LP barcode.
The Scientist's Toolkit: Essential Research Reagents
Successful intracellular staining relies on a suite of key reagents, each serving a specific function to enhance specificity and signal-to-noise ratio.
Table 3: Essential Reagents for Intracellular Flow Cytometry
| Reagent | Function | Examples & Notes |
|---|---|---|
| Fc Receptor Blocking Reagents [63] | Reduces non-specific antibody binding by blocking Fc receptors on immune cells. | Normal serum from the host species of your antibodies (e.g., rat or mouse serum); purified anti-CD16/CD32 antibodies. |
| Protein Transport Inhibitors [72] [67] | Traps secreted proteins (e.g., cytokines) inside the cell for detection. | Brefeldin A, Monensin. Added during the stimulation phase prior to fixation. |
| Tandem Dye Stabilizer [63] | Prevents the degradation of susceptible tandem dyes, preserving signal integrity. | Commercial Brilliant Stain Buffer or similar products. Essential for panels containing tandem dyes. |
| Permeabilization Agents [69] [71] | Disrupts cell membranes to allow antibody access to intracellular targets. | Saponin: For cytoplasmic and peri-membrane antigens. Triton X-100: For nuclear antigens. Methanol: Fixes and permeabilizes. |
| Fixable Viability Dyes [71] [67] | Distinguishes live from dead cells; crucial as dead cells bind antibodies non-specifically. | Amine-reactive dyes that are compatible with subsequent fixation and permeabilization steps. |
Application in Stem Cell Line Authentication
Within the context of stem cell research, the choice of method directly impacts the reliability of authentication assays. The multi-pass flow cytometry technique is particularly promising for this field, as it enables the simultaneous and accurate measurement of fragile pluripotency markers (like Oct4 or Nanog, often encoded as fluorescent reporter proteins) alongside robust intracellular lineage markers after harsh processing [68]. This provides a more comprehensive and reliable phenotypic fingerprint of stem cell populations.
Furthermore, consistency in sample handling is paramount. Variations in fixation time, permeabilization agent concentration, and incubation temperature can all alter the results of an authentication assay [69]. Establishing and rigorously adhering to a single optimized protocol is necessary to generate comparable data over time and across experiments, ensuring the authenticated state of a stem cell line.
The optimal fixation and permeabilization strategy is not a one-size-fits-all solution but is dictated by the specific biological questions and reagents at hand. For robust intracellular targets, traditional one-step protocols offer simplicity and efficiency. However, for the comprehensive phenotypic analysis required in stem cell authentication—where the preservation of sensitive epitopes and fluorescent proteins is non-negotiable—innovative methods like multi-pass flow cytometry with optical barcoding provide a superior solution. By enabling the accurate measurement of markers before destructive processing, this advanced technique significantly enhances data quality and opens new avenues for reliable, high-dimensional stem cell characterization.
Addressing Cell Clumping, Low Event Rates, and Flow Cytometer Clogs
In the authentication of stem cell lines, the integrity of flow cytometry data is paramount. This analytical technique is a cornerstone of stem cell research, enabling the identification and characterization of pluripotent markers such as OCT4 and NANOG, which are critical quality attributes (CQAs) for ensuring cellular identity and function [2] [73]. However, technical challenges like cell clumping, low event rates, and flow cytometer clogs can severely compromise data quality, leading to inaccurate interpretations of stem cell pluripotency and differentiation status. This guide objectively compares solutions for these common issues, providing structured experimental data and protocols to ensure robust, reproducible analysis in drug development and basic research.
Technical Challenges and Comparative Solution Analysis
Cell clumping, often caused by free DNA from lysed cells or overdigestion with enzymes like trypsin, can obstruct the flow cell and cause analytical errors by being misinterpreted as single cells [74] [75]. Low event rates, frequently resulting from inadequate cell concentration or sample degradation, prolong acquisition times and reduce statistical power [76] [77]. The following tables compare the root causes and efficacy of various solutions for these challenges.
Table 1: Comparative Analysis of Solutions for Cell Clumping
| Solution | Mechanism of Action | Key Advantages | Key Limitations/Considerations | Reported Impact on Data Quality |
|---|---|---|---|---|
| DNase I Treatment [74] [76] [78] | Degrades sticky free DNA that binds cells together. | Highly effective at dissolving DNA-mediated clumps. | May affect cell physiology for downstream engineering [74]. | Prevents aggregate-related cytometer clogs and false positives in analysis [78]. |
| EDTA Chelation [74] [78] | Binds calcium and magnesium ions, disrupting cell adhesion. | Simple addition to staining buffers; widely used. | May not be sufficient for severe clumping from other causes. | Reduces clumping caused by cationic bridges; improves single-cell resolution [78]. |
| Mechanical Filtration [78] [77] | Physically removes clumps via a fine mesh (e.g., 40-70 µm). | Fast, simple, and highly effective for removing existing aggregates. | Potential for minor cell loss; mesh size must be chosen carefully. | Prevents instrument clogs and excludes doublets from analysis [79]. |
| Optimized Trituration [74] | Gently breaks weak cell-cell bonds via repetitive pipetting. | Low-cost and can be performed with standard lab equipment. | Requires care to avoid generating mechanical stress that lyses cells. | Improves single-cell suspension quality before staining [74]. |
| Gentle Centrifugation [78] | Prevents over-pelleting that can promote clumping. | Preserves cell health and integrity. | Requires calibration of centrifuge to correct RCF. | Reduces clumping at the sample prep stage, improving viability [78]. |
Table 2: Comparative Analysis of Solutions for Low Event Rates & Clogs
| Solution | Mechanism of Action | Key Advantages | Key Limitations/Considerations | Reported Impact on Data Quality |
|---|---|---|---|---|
| Sample Concentration [76] | Increases the number of cells per unit volume. | Maintains high event rate without increasing sample flow rate. | Over-concentration can lead to increased clumping. | Enables efficient data acquisition while preserving data resolution [76]. |
| Viability Staining & Gating [80] [79] [77] | Uses dyes (e.g., PI, 7-AAD) to identify and exclude dead cells. | Reduces background noise and non-specific binding from dead cells. | Requires a fluorescence channel to be allocated for the viability dye. | Significantly improves signal-to-noise ratio and accuracy of marker expression analysis [77]. |
| Instrument Maintenance & Cleaning [76] [80] | Prevents and removes physical blockages in the fluidics system. | Essential for instrument longevity and consistent performance. | Requires downtime; often overlooked in shared facilities. | Precludes data loss from aborted runs and maintains stable baseline measurements [76]. |
| Using Freshly Isolated Cells [76] [79] | Avoids cell death and aggregation associated with freeze-thaw cycles. | Maximizes cell health and marker integrity. | Not always logistically feasible for all sample types. | Yields higher viability and lower background compared to freshly thawed cells [76]. |
| Low Sample Flow Rate [76] [80] | Reduces the rate at which cells pass the laser interrogation point. | Minimizes doublet events and electronic aborts. | Extends the total acquisition time for large samples. | Improves resolution of subpopulations and accuracy in cell cycle analysis [80]. |
Essential Experimental Protocols for Reliable Stem Cell Analysis
Standardized protocols are critical for generating reproducible flow cytometry data in stem cell research. The following methods are adapted from best practices and recent literature.
Protocol 1: Preparation of a Single-Cell Suspension from hPSCs
This protocol is designed to minimize clumping during the initial harvest of human pluripotent stem cells (hPSCs), a critical step for accurate analysis of pluripotency markers [73].
- Cell Harvesting: Aspirate culture medium and wash cells with Mg++/Ca++-free PBS. Add a gentle dissociation reagent like Accumax and incubate at 37°C until cells detach (typically 5-10 minutes) [73].
- Neutralization & Washing: Transfer the cell suspension to a tube containing staining buffer (PBS with 0.1-1% BSA, 1 mM EDTA). Centrifuge at a calibrated, gentle relative centrifugal force (e.g., 300-500 x g for 5 minutes) to avoid over-pelleting [78].
- DNase Treatment (Optional): If clumping is observed, resuspend the cell pellet in staining buffer supplemented with 10 units of DNase I per mL and incubate for 5-10 minutes at room temperature [74] [78].
- Filtration: Pass the cell suspension through a pre-wetted 40-50 µm cell strainer to remove any remaining aggregates immediately before loading onto the cytometer [78] [77].
- Cell Counting and Viability Assessment: Count cells using a hemocytometer or an automated cell counter. Assess viability using a cell-impermeant dye like trypan blue or propidium iodide [78] [73]. Adjust cell concentration to 10^5–10^7 cells/mL for staining [77].
Protocol 2: Flow Cytometry Analysis of Intracellular Pluripotency Markers
This protocol outlines the procedure for staining and analyzing key intracellular transcription factors like OCT4, a CQA for hPSCs [73].
- Cell Fixation: After preparing a single-cell suspension, fix cells with 4% methanol-free formaldehyde in PBS for 10-15 minutes at room temperature. This cross-links proteins and preserves intracellular antigens [80].
- Cell Permeabilization: Centrifuge the fixed cells and thoroughly resuspend the pellet in a permeabilization buffer. For nuclear targets like OCT4, ice-cold 90% methanol can be used, adding it drop-wise while gently vortexing. Alternatively, detergents like saponin or Triton X-100 can be used for cytoplasmic targets [80].
- Intracellular Staining: Centrifuge the permeabilized cells and resuspend in staining buffer. Add a titrated, fluorophore-conjugated antibody against the target (e.g., anti-OCT4). Incubate for 30-60 minutes in the dark.
- Washing and Resuspension: Wash cells twice with staining buffer to remove unbound antibody. Resuspend the final pellet in staining buffer containing 1 mM EDTA for analysis.
- Data Acquisition and Gating: Acquire data on the flow cytometer at a low flow rate. In the analysis software, use forward and side scatter to gate on single, viable cells, and then analyze the fluorescence intensity of the pluripotency marker within this population [76] [80].
Research Reagent Solutions for Stem Cell Flow Cytometry
The following reagents are essential for successful flow cytometry experiments in stem cell research.
Table 3: Essential Research Reagents and Materials
| Reagent/Material | Function | Application Notes |
|---|---|---|
| DNase I [74] [78] | Enzyme that fragments extracellular DNA. | Critical for reducing cell clumping; use at 10 U/mL in buffer. |
| EDTA [74] [78] | Chelating agent that binds divalent cations. | Add to staining buffers (1 mM) to prevent cell adhesion. |
| Viability Dye (e.g., Propidium Iodide, 7-AAD) [80] [79] | Cell-impermeant dye that labels dead cells. | Allows for gating and exclusion of dead cells to reduce background. |
| Fc Receptor Blocking Reagent [80] [77] | Blocks non-specific antibody binding to immune cells. | Essential when working with primary cells or hematopoietic lineages. |
| Cell Strainers (40-70 µm) [78] [77] | Mesh filters to remove cell clumps and debris. | A final filtration step prevents clogs and ensures a single-cell stream. |
| Accumax [73] | Gentle enzymatic cell dissociation reagent. | Preferred over trypsin for harvesting sensitive hPSCs to minimize clumping and damage. |
| Antibodies to Pluripotency Markers (e.g., OCT4, NANOG) [2] [73] | Fluorescently-conjugated probes for detecting stem cell identity. | Must be titrated for optimal signal-to-noise; bright fluorophores (e.g., PE) recommended for low-abundance targets [80]. |
Visualizing the Workflow and Decision Pathway
The following diagram illustrates the logical workflow for addressing the key technical challenges discussed, from sample preparation to data acquisition.
The reliability of flow cytometry data in stem cell authentication is fundamentally dependent on meticulous sample preparation and systematic troubleshooting. As demonstrated, proven strategies such as DNase I treatment, EDTA chelation, and mechanical filtration are highly effective against cell clumping, while careful attention to cell concentration, viability, and instrument settings ensures optimal event rates and prevents clogs. For researchers in drug development, adopting these standardized protocols and utilizing the compared solutions is not merely a technical exercise but a critical component of Quality by Design (QbD). It ensures that the data informing critical decisions—from characterizing a stem cell line's critical quality attributes to assessing the purity of a cellular therapeutic—are as accurate and reproducible as possible.
Managing Autofluorescence and Compensating for Spectral Spillover
In the field of flow cytometry authentication of stem cell lines, two significant technical challenges are the management of cellular autofluorescence and the accurate compensation for spectral spillover. Autofluorescence, the background fluorescence emitted by endogenous cellular components, can obscure weak signals from specific markers, a particular concern when working with rare stem cell populations or assessing low-abundance antigens [81]. Spectral spillover, where the emission of one fluorophore is detected in the channel of another, can lead to false-positive signals and misidentification of cell populations [50]. This guide compares traditional compensation methods with the newer, principles-based AutoSpill framework, providing researchers with the data and protocols needed to implement these approaches in stem cell characterization workflows.
Understanding the Challenges: Autofluorescence and Spillover
Cellular Autofluorescence
Autofluorescence is an intrinsic property of cells caused by endogenous molecules like NAD(P)H, flavins, and lipopigments [81]. When excited by a laser, these molecules emit fluorescence, creating a background signal that can interfere with the detection of specific fluorescent labels [81]. This is a critical consideration in stem cell research, where:
- Cell Type Dependence: Larger, more granular cells often produce higher levels of autofluorescence [81].
- Metabolic Activity: Autofluorescence can provide estimates of cellular metabolic state, which is relevant for assessing stem cell pluripotency and differentiation [81].
- Spectral Range: Autofluorescence is typically more pronounced in shorter wavelength channels (UV, violet, blue) and less so in far-red and near-infrared regions [81] [9].
Spectral Spillover
Fluorophores emit photons across a range of wavelengths. In multicolor panels, the emission from one fluorophore can be detected by a photodetector intended for a different fluorophore, a phenomenon known as spectral spillover [50] [9]. This spillover must be corrected through a process called compensation to avoid false-positive signals and ensure accurate data interpretation [50].
Comparative Analysis: Traditional Compensation vs. AutoSpill
The table below summarizes the core differences between the traditional compensation method and the AutoSpill algorithm.
Table 1: Core Methodological Comparison between Traditional Compensation and AutoSpill
| Feature | Traditional Compensation | AutoSpill Algorithm |
|---|---|---|
| Core Principle | Calculates spillover based on median fluorescence intensities (MFI) of gated positive and negative populations [82]. | Uses robust linear regression on all events in a singly-stained control to model the spillover relationship [83] [82]. |
| Input Data | Relies on clearly defined, gated positive and negative populations for each control [84]. | Uses all data from the singly-stained control file; does not require pre-gated populations [84] [83]. |
| Handling of Autofluorescence | Often increases background spread in spillover channels; not directly accounted for in the calculation [9]. | Can directly incorporate an unstained control to measure and subtract autofluorescence during matrix calculation [84] [83]. |
| Iterative Refinement | Typically a one-step calculation [82]. | Applies the initial matrix, checks for residual spillover, and iteratively refines the matrix for greater accuracy [82]. |
| Best For | Well-defined, bimodal staining (e.g., compensation beads, highly expressed antigens like CD4) [82]. | Complex cell samples, dimly expressed markers, rare populations, and panels where autofluorescence is a significant concern [83] [82]. |
The following workflow diagrams illustrate the key procedural differences between the two methods.
Traditional Compensation Workflow
AutoSpill Compensation Workflow
Experimental Protocols for Implementation
Basic Protocol: Traditional Compensation with Single-Stained Controls
This protocol is essential for establishing proper compensation, whether done manually or as a prerequisite for understanding automated methods [50] [9].
- Preparation of Controls: For each fluorophore in your panel, prepare a single-stained control. This can be cells or compensation beads.
- Data Acquisition: Acquire data for each control on your flow cytometer.
- Gating Populations: For each control file, create a histogram of the primary channel for that fluorophore. Manually draw a gate to define the positive and negative populations.
- Critical Note: The positive population should be at least as bright as any sample you will analyze, and ideally form at least 10% of the total events [50].
- Matrix Calculation: Use your flow cytometry software (e.g., FlowJo, FACSDiva) to calculate the spillover matrix. The software uses the Median Fluorescence Intensity (MFI) of the positive and negative populations in each detector to compute the spillover coefficients [82].
- Application: Apply the generated compensation matrix to your experimental samples.
Advanced Protocol: Implementing AutoSpill Compensation
AutoSpill automates and improves the calculation of the spillover matrix, reducing manual effort and potential bias [84] [83].
- Input Preparation:
- Singly-Stained Controls: Prepare a set of single-stained control files (cells are recommended for accurate autofluorescence profiling).
- Metadata File (for R package): Create a CSV file listing each control file and its corresponding target channel (e.g., "Ax488-A", "PE-Cy7-A") [82].
- Software Setup: AutoSpill is available in several platforms:
- FlowJo (v10.7+):
- Create a new compensation group and load your single-stained controls.
- In the compensation wizard, tick the "AutoSpill" option.
- FlowJo will automatically associate controls with channels and perform auto-gating. The algorithm will then run and produce the optimized matrix [84].
- OMIQ:
- Add an AutoSpill task to your workflow.
- Select your single-stained control files and their corresponding features (channels).
- Enable pregating to exclude debris and select the autofluorescence feature if an unstained control is available [83].
- R Package:
- Use the
read.flow.control()function to read the FCS files and metadata. - Run
gate.flow.data()for auto-gating. - Execute
get.marker.spillover()andrefine.spillover()to calculate and iteratively refine the matrix [82].
- Use the
- FlowJo (v10.7+):
- Autofluorescence Subtraction (Optional): Include an unstained control file in your set. In the software, assign this control to an empty detector. AutoSpill will treat autofluorescence as an endogenous dye and subtract its signal during the calculation [84] [83].
- Apply Matrix: The final output is an optimized spillover (compensation) matrix. Apply this matrix to your experimental data in your analysis software.
The Scientist's Toolkit: Essential Research Reagents and Materials
The table below lists key reagents and materials required for the flow cytometry authentication of stem cell lines, with a focus on managing autofluorescence and spillover.
Table 2: Key Research Reagents and Materials for Flow Cytometry Authentication
| Item | Function/Application | Example Use Case in Stem Cell Research |
|---|---|---|
| Single-Stained Controls | Essential for calculating spillover matrices in both traditional and AutoSpill methods. | Using cells (e.g., compensation beads or known positive cell lines) stained with each fluorophore in the panel to define its spectral signature [50] [83]. |
| Unstained Cell Control | Serves as a negative control and enables autofluorescence measurement. | Profiling the intrinsic autofluorescence of the specific stem cell line being authenticated (e.g., iPSCs, MSCs) for background subtraction [81] [84]. |
| Viability Stain | Distinguishes live from dead cells. | Dead cells often have higher autofluorescence and nonspecific antibody binding; excluding them improves analysis accuracy [9]. |
| Titrated Antibodies | Antibodies used at optimal, pre-determined concentrations. | Ensuring clear detection of stem cell markers (e.g., NANOG, OCT4, SSEA-4 for pluripotency) while minimizing background and spillover spread [3] [9]. |
| Far-Red/NIR Fluorophores | Fluorophores emitting in spectral regions with lower cellular autofluorescence. | Detecting low-abundance surface markers on stem cells or in highly autofluorescent tissue-derived cell samples [81] [50]. |
| Fc Receptor Blocking Reagent | Reduces nonspecific antibody binding. | Critical when working with immune cells or macrophages derived from stem cells to prevent false-positive signals [9]. |
| AutoSpill Software | Algorithm for automated, improved spillover calculation. | Simplifies and enhances the accuracy of compensating complex multicolor panels used for deep phenotyping of stem cell populations [84] [82]. |
Supporting Experimental Data and Application in Stem Cell Research
The implementation of robust compensation and autofluorescence management is not just a technical exercise; it directly impacts the quality and reliability of stem cell data.
- Impact of Proper Compensation: Incorrect compensation can lead to the misidentification of cell populations. For example, a failure to properly compensate for PE spillover into the FITC channel could cause a false double-positive population to appear, potentially leading to the incorrect classification of a stem cell subtype [50].
- Quantifying Autofluorescence: Studies show that autofluorescence can provide estimates of cellular metabolic activity, as changes in emission are influenced by the amount and state of endogenous fluorophores like NAD(P)H [81]. This is highly relevant for monitoring the metabolic shifts that occur during stem cell differentiation.
- Authentication of Pluripotency: Flow cytometry is a cornerstone for verifying the pluripotent status of stem cell lines like induced Pluripotent Stem Cells (iPSCs) by evaluating the homogeneous expression of markers such as TRA-1-60, SSEA-4, and OCT4 [3]. Accurate compensation is vital here, as incomplete spillover correction could make a partially differentiated colony appear homogeneously positive, compromising experimental reproducibility.
The choice between traditional compensation and AutoSpill depends on the complexity of the panel and the nature of the sample. For simple panels with bright, well-defined stains, traditional methods remain sufficient. However, for high-dimensional stem cell research involving rare populations, dim markers, or highly autofluorescent cells, AutoSpill offers a principled and robust framework that simplifies workflow and enhances data accuracy.
In the field of stem cell research, the authentication of cell lines via flow cytometry relies on rigorous experimental controls to ensure data accuracy and reproducibility. These controls are essential for distinguishing specific signal from background noise, particularly when characterizing rare populations like hematopoietic stem cells. Proper use of controls safeguards against artifacts from dead cells, spectral overlap, non-specific antibody binding, and biological variability, forming the foundation for reliable immunophenotyping in both basic research and clinical applications such as cellular therapy product manufacturing [85] [86]. This guide provides a comparative analysis of critical flow cytometry controls—isotype, FMO, viability, and biological controls—within the context of authenticating stem cell lines.
Comparative Analysis of Critical Flow Cytometry Controls
The table below summarizes the primary purpose, key applications, and strengths and weaknesses of the four major control types used in flow cytometry for stem cell research.
| Control Type | Primary Purpose | Key Applications in Stem Cell Authentication | Key Strengths | Major Limitations |
|---|---|---|---|---|
| Viability Control [86] [87] [88] | Identify and exclude dead cells with compromised membranes. | Prevents false positives from non-specific antibody binding in precious stem cell samples. | Directly improves data accuracy; multiple dye options (PI, 7-AAD, fixable dyes). | Accuracy can be affected in cryopreserved samples with high debris [86]. |
| FMO Control [89] [87] | Define accurate positive/negative boundaries in multicolor panels by accounting for background fluorescence spread. | Critical for precisely gating low-abundance or weakly expressing stem cell populations (e.g., CD34+). | Essential for complex panels; provides the most accurate background for gating. | Logistically challenging; increases reagent use and sample number. |
| Isotype Control [90] [91] [92] | Estimate background from non-specific antibody binding. | Historically used to define negativity, e.g., in CD34+ stem cell enumeration kits [92]. | Easy to obtain from commercial vendors. | Poor indicator of true background; affected by factors like Fc receptor binding and fluorophore-to-protein ratio; not recommended for setting positive gates [90] [91]. |
| Biological Control [93] | Provide a native reference for marker expression levels using cells with known phenotype. | Verify staining specificity and assay sensitivity; confirm a stem cell line is negative for a marker as expected. | Uses biologically relevant cells; best practice for verifying assay specificity. | Can be difficult to obtain (e.g., knockout cell lines); requires prior knowledge of marker expression. |
Experimental Workflow for Control Implementation
The following diagram illustrates a logical, sequential workflow for incorporating these critical controls into a flow cytometry experiment for stem cell authentication.
Detailed Experimental Protocols and Supporting Data
Cell Viability Assessment Protocol
Accurate viability assessment is a critical first step, as dead cells are a major source of non-specific binding and autofluorescence [87]. This is particularly crucial for analyzing cryopreserved stem cell products, where viability can be significantly impacted [86].
Propidium Iodide (PI) Staining Method [88]:
- Reagents: 1X PBS or HBSS, flow cytometry staining buffer, PI staining solution (10 µg/mL in PBS).
- Procedure:
- Harvest and wash up to 1 x 10^6 cells in PBS by centrifuging at 300 x g for 5 minutes. Repeat twice.
- Resuspend the cell pellet in 100 µL of flow cytometry staining buffer.
- Add 5-10 µL of PI staining solution immediately before analysis on the flow cytometer. Do not wash after PI addition.
- Acquire data using the FL-2 or FL-3 channel, gating on the viable (PI-negative) cell population.
Comparative Viability Assay Performance: A 2023 study compared various viability methods on fresh and cryopreserved cellular therapy products, including stem cell apheresis products [86]. The data below summarize the key findings regarding assay performance.
| Assay Method | Principle | Best Suited For | Key Advantage | Consideration for Stem Cell Research |
|---|---|---|---|---|
| Manual Trypan Blue | Dye exclusion by viable cells [86]. | Quick assessment of fresh samples. | Simple, cost-effective. | Subjective; not recommended for cryopreserved samples with debris [86]. |
| Flow Cytometry (PI/7-AAD) | Membrane integrity; nucleic acid binding in dead cells [86] [88]. | High-throughput, objective analysis; multicolor panels. | Objective, can be combined with surface staining. | Reliable for fresh products; accurate for cryopreserved samples [86]. |
| Image-Based (e.g., Cellometer) | Fluorescent staining (AO/PI) and automated counting [86]. | Rapid, auditable viability counts. | Provides image documentation. | Shows good agreement with other methods for fresh products [86]. |
Implementing FMO and Biological Controls
For multicolor immunophenotyping of stem cells, such as identifying CD34+ hematopoietic stem cells, FMO controls are indispensable for setting gates accurately, especially for markers with low expression or complex staining patterns [89] [87].
FMO Control Protocol [89] [87]:
- Preparation: For each fluorophore in your panel, prepare one control tube containing all antibodies except the one conjugated to that fluorophore.
- Example: In a panel containing FITC, PE, and APC, the PE FMO control would be stained with FITC- and APC-conjugated antibodies only.
- Usage: During analysis, use the FMO control to set the boundary for positive staining in the channel corresponding to the omitted antibody. This accounts for background fluorescence and spillover from all other fluorochromes in the panel.
Biological Control Selection [93]:
- Negative Biological Control: Use a cell population known to lack the antigen of interest. This can be a knockout cell line or a native population within a heterogeneous sample (e.g., CD3+ T cells in a PBSC sample serving as an internal negative control for CD34 expression).
- Positive Biological Control: Use a cell line or native cells with a well-defined and stable expression level of the marker. This verifies that the staining protocol is working and helps normalize data across different experimental runs.
The Scientist's Toolkit: Essential Research Reagent Solutions
The table below lists key reagents and their critical functions for implementing the controls discussed in this guide.
| Reagent / Material | Primary Function | Example Use Case |
|---|---|---|
| Viability Dyes (PI, 7-AAD) [86] [88] | Bind to nucleic acids in dead cells with permeable membranes. | Distinguish and gate out dead cells in a thawed stem cell sample prior to analysis. |
| Fixable Viability Dyes [87] | Covalently bind to amines in dead cells; compatible with cell fixation. | Viability staining for intracellular antigen staining protocols requiring permeabilization. |
| Compensation Beads [89] [87] | Synthetic beads that bind antibodies; used to create single-color controls. | Generate consistent and reproducible compensation matrices for complex multicolor panels. |
| Fc Receptor Blocking Reagent [87] [91] | Blocks non-specific binding of antibodies to Fc receptors on monocytes, macrophages. | Essential pre-treatment for staining immune cells or heterogeneous samples containing monocytes. |
| Reference Control Cells [93] [94] | Biological or synthetic cells with known marker expression. | Serve as a positive or negative control to validate staining specificity and assay performance. |
The authentication of stem cell lines through flow cytometry demands a disciplined, controlled approach. While each control type serves a distinct purpose, viability controls and FMO controls are non-negotiable for generating high-quality data, as they directly address the two most significant sources of artifacts: dead cells and spectral spillover. Isotype controls, while easily accessible, are limited and should not be used to set positivity gates. Whenever possible, biological controls provide the most biologically relevant standard for verifying staining specificity. By integrating these controls into a coherent workflow, researchers can ensure the reliability and reproducibility of their stem cell characterization data, which is fundamental for both translational research and clinical application.
Ensuring Reproducibility: Validation, Standards, and Comparative Analysis
In the field of flow cytometry authentication of stem cell lines, the reliability of experimental data is fundamentally dependent on antibody specificity. Antibodies are critical tools for identifying, characterizing, and isolating specific cell populations from heterogeneous samples, such as human pluripotent stem cell-derived cardiomyocytes (hPSC-CMs) [28]. However, the scientific community faces a significant challenge: without rigorous validation, antibodies may produce unreliable results due to non-specific binding, batch-to-batch variability, or context-dependent performance issues [95] [96].
The concept of "fit-for-purpose" validation has emerged as a essential principle, emphasizing that antibodies must be demonstrated as specific within a defined experimental design and biological context [28] [97] [98]. This approach is particularly crucial in stem cell research, where accurately assessing phenotypic heterogeneity is critical for interpreting and reproducing studies [28]. This guide provides a comprehensive comparison of antibody validation strategies, experimental protocols, and practical recommendations to ensure antibody specificity in flow cytometry-based stem cell research.
Core Principles of Antibody Validation
The "Fit-for-Purpose" Philosophy
The fit-for-purpose approach recognizes that antibody validation cannot follow a one-size-fits-all protocol. Instead, antibodies and experimental conditions must be demonstrated as specific within a defined experimental design and biological context [28] [98]. This principle is especially important in flow cytometry analyses of stem cell models, where the ability to distinguish between closely related cell populations depends on antibody specificity [28].
Context of Use (COU) is a critical component of fit-for-purpose validation, defining the specific purpose for which the biomarker data will be used [97]. Without a clear understanding of COU, it is not possible to properly validate an assay for its intended use – "no context, no validated assay" [97].
The Five Pillars of Antibody Validation
The International Working Group on Antibody Validation (IWGAV) established five conceptual pillars to provide a comprehensive framework for antibody validation [99] [96]. These pillars offer complementary approaches to confirm antibody specificity:
Table: The Five Pillars of Antibody Validation
| Pillar | Core Principle | Key Advantage | Common Limitations |
|---|---|---|---|
| Genetic Strategies [99] [96] | Knockout or knockdown of target gene | Provides true negative control; considered highly reliable | Not feasible for essential genes; cell line-dependent results |
| Orthogonal Strategies [99] [96] | Comparison with antibody-independent method | Leverages existing omics data; streamlines validation | Potential discordance between RNA and protein levels |
| Independent Antibodies [99] [96] | Multiple antibodies against different epitopes | Confirms target identity without specialized techniques | Risk of identical non-specific binding; challenging to find truly independent antibodies |
| Immunoprecipitation + Mass Spectrometry (IP/MS) [99] [96] | Direct identification of antibody-bound proteins | Comprehensively identifies all binding partners | Technically demanding; requires specialized equipment |
| Tagged Protein Expression [99] [96] | Expression of tagged target protein | Clear confirmation of target binding | Overexpression may mask off-target binding; may not reflect endogenous levels |
Antibody Validation Techniques for Flow Cytometry
Flow Cytometry-Specific Considerations
Validating antibodies for flow cytometry presents unique challenges and requirements compared to other applications. A critical aspect is demonstrating that the antibody can distinguish between positive and negative cell types within the specific experimental system [28]. For intracellular staining in stem cell derivatives, this requires careful attention to fixation and permeabilization protocols, which can significantly impact antibody binding [28].
The mixed population experiment serves as an ultimate assessment for flow cytometry validation. This approach involves testing the antibody on defined mixtures of positive and negative cells across a dynamic range, then comparing the known percent composition to the experimentally determined percent positivity [28]. Strong correlation between these values indicates the protocol is fit for purpose.
Comparison of Validation Techniques
Different validation techniques offer varying levels of evidence for antibody specificity in flow cytometry applications. The table below summarizes the quantitative data available for commercially available antibodies validated using these methods:
Table: Commercially Available Antibodies with Validation Data (CiteAb 2022) [96]
| Validation Method | Number of Commercially Available Antibodies | Strength of Evidence | Recommended Application |
|---|---|---|---|
| Genetic Strategies (KO/KD) | >21,000 | High | All applications, especially novel targets |
| Orthogonal Strategies | >14,000 | Medium-High | When suitable reference data exists |
| Independent Antibodies | >4,000 | Medium | For well-characterized targets |
| Tagged Protein Expression | ~5,000 | Medium | Initial screening and confirmation |
| Capture-MS | >300 | High | Comprehensive specificity assessment |
Experimental Protocols for Antibody Validation
Genetic Validation Protocols
Genetic approaches using CRISPR/Cas9 knockout or RNA interference (RNAi) knockdown represent one of the most reliable validation methods [99] [100] [96]. The step-by-step protocol includes:
- Generate knockout/knockdown cells: Use CRISPR/Cas9 for complete knockout or siRNA/shRNA for transient knockdown of the target gene [96].
- Confirm genetic modification: Verify knockout/knowndown efficiency at the RNA level using RT-qPCR [100].
- Account for protein turnover: Determine the optimal timepoint for protein depletion by considering the target protein's half-life [100].
- Perform flow cytometry analysis: Stain both wild-type and modified cells with the test antibody using standardized protocols [28].
- Interpret results: Specific antibodies show significantly reduced or absent signal in knockout cells compared to wild-type controls [99].
For difficult targets where complete knockout is not feasible (e.g., essential genes), partial knockdown combined with other validation methods may be necessary [100] [96].
Orthogonal Validation Using Correlation with Omics Data
This method correlates antibody-based detection with antibody-independent measurements across multiple cell types [100]:
- Select cell panel: Choose 4-5 cell lines with varying expression levels of the target protein, as determined by transcriptomic or proteomic data [100].
- Pre-stain cells (optional): Use cell tracker dyes to pre-stain different cell lines, enabling mixing before antibody labeling [100].
- Perform antibody staining: Follow standard flow cytometry protocols for all cell lines in parallel [100].
- Correlate results: Compare median fluorescence intensity (MFI) with expected expression levels from omics data [100].
- Validate correlation: A specific antibody should show strong correlation between staining intensity and expected expression levels [100].
This approach can also incorporate biological treatments known to modulate target expression, comparing expected changes with observed antibody staining patterns [100].
Mixed Population Experiment for Flow Cytometry
This critical validation test, specifically recommended for flow cytometry applications, assesses whether an antibody can accurately quantify population heterogeneity [28]:
- Prepare defined mixtures: Create samples containing known ratios of positive and negative control cells (e.g., hPSC-CMs and undifferentiated hPSCs) [28].
- Process samples: Apply the standardized flow cytometry protocol to all mixtures [28].
- Analyze results: Compare the experimentally determined percent positivity with the known composition of each mixture [28].
- Assess accuracy: A validated antibody and protocol will show direct correlation between known and measured values across the dynamic range [28].
Research Reagent Solutions for Stem Cell Authentication
The following table details essential reagents and their specific functions in antibody validation for flow cytometry-based stem cell authentication:
Table: Essential Research Reagents for Antibody Validation in Stem Cell Research
| Reagent / Resource | Function in Validation | Application Notes |
|---|---|---|
| CRISPR/Cas9 Systems [96] | Generate knockout cell lines for genetic validation | Essential for creating true negative controls; preferred over knockdown for complete protein removal |
| Validated Positive/Negative Cell Lines [28] | Provide biological controls for specificity testing | hPSC-CMs (positive) and undifferentiated hPSCs (negative) critical for stem cell applications |
| Isotype Controls [28] | Assess non-specific antibody binding | Necessary but insufficient alone; must be combined with biological negative controls |
| HLDA Workshop Approved Antibodies [100] | Provide pre-validated antibody clones for common targets | CD markers characterized by Human Cell Differentiation Molecules offer validated starting points |
| Cell Tracking Dyes [100] | Enable multiplexing of cell lines in correlation experiments | Allow mixing of different cell types before antibody staining for standardized processing |
| siRNA/shRNA Vectors [100] | Create transient knockdown for genetic validation | Alternative when complete knockout is not feasible; requires careful optimization of timing |
Implementation in Stem Cell Research
Special Considerations for Stem Cell Models
Stem cell research presents unique challenges for antibody validation. Human pluripotent stem cell-derived cultures often contain heterogeneous cell populations, making accurate immunophenotyping essential [28]. Additionally, intracellular proteins such as cardiac troponin T or I (TNNT2 or TNNI3) frequently serve as markers for cardiomyocyte identification, requiring fixation and permeabilization steps that can affect antibody binding [28].
The lack of suitable cell type-specific surface markers for many stem cell derivatives further complicates flow cytometry analysis, necessitating rigorous validation of intracellular staining protocols [28]. Sample preparation conditions have been shown to have cell-type and antibody clone-dependent effects on staining results, emphasizing the need for protocol-specific validation [28].
Addressing the Reproducibility Crisis
Poorly validated antibodies have contributed significantly to the reproducibility crisis in biomedical research. More than 70% of researchers have struggled to reproduce experiments conducted by other scientists, often due to issues with antibodies [99]. Specific examples include:
- C9ORF72 studies: Research on this protein associated with neurodegenerative diseases used non-specific antibodies in many highly cited papers [96].
- Epigenetics research: Approximately 25% of 246 commercially available antibodies tested for epigenetic research were not specific [96].
- Oestrogen receptor β (ERβ/ESR2): A new research field failed to develop as expected when validation revealed that only one of 13 anti-ERβ antibodies was specific for IHC [96].
These cases highlight the critical importance of rigorous antibody validation for advancing reliable scientific knowledge.
Future Directions and Community Initiatives
The future of antibody validation lies in increased collaboration and standardization across the research community. Initiatives such as the International Working Group for Antibody Validation (IWGAV) and the Human Cell Differentiation Molecules (HCDM) organization work to establish and promote validation standards [99] [100].
The adoption of recombinant antibodies represents another promising development, as these offer defined sequences, superior batch-to-batch consistency, and unlimited supply compared to traditional monoclonal and polyclonal antibodies [95] [101]. As the field progresses, technological advances such as imaging flow cytometry that combines high-throughput analysis with morphological validation may provide additional layers of antibody verification [102].
By implementing comprehensive, fit-for-purpose antibody validation strategies, researchers in stem cell biology and drug development can generate more reliable, reproducible data that accelerates scientific discovery and therapeutic development.
In the field of stem cell research and clinical translation, the integrity of experimental data and the safety of subsequent applications are fundamentally dependent on the quality of the starting cell population. Quantitative verification of cell population purity is therefore not merely a preliminary step, but a critical authentication checkpoint within a broader quality control framework [31] [103]. Techniques such as fluorescence-activated cell sorting (FACS) are powerful for isolating rare stem cells from heterogeneous samples; however, the isolated population's reliability for downstream applications—like differentiation studies, organoid generation, or therapeutic use—hinges on demonstrating its purity [2] [104]. The presence of non-target cells can significantly skew research outcomes, from misrepresenting gene expression profiles in bulk assays to altering the differentiation potential of stem cell cultures. This article objectively compares flow cytometry, the dominant method for purity assessment, with other analytical alternatives, providing structured experimental data and protocols to guide researchers in implementing rigorous, quantitative verification.
Core Principles and Regulatory Mandates
Cell purity is quantitatively defined as the percentage of a specific cell type, possessing defined biological characteristics, within a larger cell population [103]. In practical terms, for a sorted population of CD34+ hematopoietic stem cells (HSCs), purity is the proportion of cells that are positively identified as CD34+ via a definitive detection method.
The mandate for this assessment is underscored by official guidelines from professional bodies. The European Federation for Immunogenetics (EFI) and the American Society for Histocompatibility and Immunogenetics (ASHI) explicitly state that when cellular subsets are isolated for sensitive analyses like chimerism monitoring, "the purity of the sorted population must be documented and taken into account in the analysis of the results" [1]. This requirement is a direct response to the well-documented risk of cell line misidentification and cross-contamination in vitro, which is a major contributor to erroneous conclusions and a threat to reproducibility in biological research [31]. Funding agencies and high-impact journals increasingly require evidence of such quality control to receive funds or publish [31].
Experimental Protocols for Purity Assessment
Flow Cytometry-Based Purity Assessment
Flow cytometry remains the gold standard for purity assessment due to its rapid, quantitative, single-cell resolution. The following is a generalized step-by-step protocol, adaptable for various cell types including stem cell populations.
Basic Protocol: Purity Assessment by Flow Cytometry [1] [105]
- Step 1: Sample Preparation. After cell separation (e.g., via FACS or magnetic sorting), aliquot approximately 1-5 x 10^5 cells into a FACS tube. The cell concentration should be adjusted to between 1 x 10^6 and 1 x 10^7 cells/mL in a volume of 100 µL of PBS or a suitable buffer.
- Step 2: Staining. Add fluorochrome-conjugated antibodies targeting the primary cell surface marker(s) of the isolated population (e.g., CD3 for T cells, CD34 for HSCs) according to the manufacturer's instructions. A typical volume is 5-20 µL per test. Simultaneously, prepare a separate tube with an appropriate fluorescently-conjugated isotype control antibody.
- Step 3: Viability Staining (Optional but Recommended). To gate out dead cells for a more accurate assessment, add a viability stain such as propidium iodide (PI) or 7-AAD to each sample.
- Step 4: Incubation. Incubate the cells with the antibodies for 30 minutes at 2-8°C or on ice, protected from light.
- Step 5: Washing and Resuspension. Wash the cells with 1-2 mL of PBS to remove unbound antibody. Centrifuge, pour off the supernatant, and resuspend the cell pellet in 100-500 µL of PBS or FACS sheath fluid. If analysis cannot be performed immediately, fix cells with 1% paraformaldehyde and store at 2-8°C for up to two weeks, protected from light.
- Step 6: Flow Cytometry Acquisition. Acquire data on a flow cytometer. It is recommended to collect 10,000 to 50,000 events per sample to ensure statistical significance [1].
- Step 7: Gating Strategy and Analysis.
- Create a dot plot of Forward Scatter (FSC) vs. Side Scatter (SSC) and gate the population of interest to exclude debris and red blood cells.
- From this gate, create a second dot plot of FSC vs. the viability dye (e.g., PI) to exclude dead cells.
- On the viable cell population, plot fluorescence for the marker of interest. The purity is calculated as the percentage of cells positive for the specific antibody within the gated, viable population.
An Advanced Alternative: Imaging Flow Cytometry
Imaging flow cytometry (IFC) merges the high-throughput, quantitative capabilities of conventional flow cytometry with the morphological detail of microscopy [2]. This allows for verification of purity not just based on marker expression, but also on cellular morphology, and can confirm the subcellular localization of signals—a crucial advantage when distinguishing similar cell types or confirming the expression of intracellular pluripotency markers in stem cells [2]. Recent technological breakthroughs, such as optofluidic time-stretch (OTS) IFC, have pushed the real-time throughput of these systems to exceed 1,000,000 events per second while maintaining sub-micron resolution, opening the door for ultra-high-throughput purity analysis in large-scale applications [106].
Orthogonal Methods for Verification
While flow cytometry is the workhorse for purity analysis, orthogonal methods provide valuable verification.
- Short Tandem Repeat (STR) Analysis: This DNA profiling technology is the internationally recognized consensus standard for authenticating human cell lines and confirming the absence of cross-contamination [31]. While not a direct measure of phenotypic purity, it is essential for confirming the genetic identity of a stem cell line. A study on monitoring chimerism post-transplant found that flow cytometry-based purity assessment produced data comparable to a PCR-based genetic method [105].
- PCR-based Methods: These can be used to detect specific genetic markers or the presence of host/donor DNA in chimerism studies, serving as a genetic counterpart to immunophenotypic analysis [105].
Comparative Analysis of Purity Assessment Techniques
Table 1: Comparative analysis of cell population purity assessment techniques.
| Method | Principle | Throughput | Key Advantages | Key Limitations | Ideal Use Case |
|---|---|---|---|---|---|
| Flow Cytometry | Fluorochrome-antibody binding and light scattering | High (up to 10,000s of cells/sec) | High-throughput, quantitative, multi-parameter, single-cell resolution [2] [104]. | Lacks morphological context; requires specific antibodies. | Routine, high-throughput purity checks of immunophenotypically defined populations. |
| Imaging Flow Cytometry (IFC) | Fluorescence microscopy combined with flow | Medium to Very High (1,000 to >1,000,000 eps) [106] | Adds high-resolution morphological data; verifies subcellular localization [2] [106]. | Higher cost; complex data analysis. | Verifying purity of morphologically distinct contaminants or analyzing intracellular markers. |
| STR Analysis | DNA profiling of microsatellite loci | Low to Medium | Gold standard for cell line authentication; detects interspecies cross-contamination [31]. | Does not assess phenotypic purity; requires reference sample. | Authenticating master cell banks and confirming genetic identity of stem cell lines. |
| PCR-based Methods | Amplification of lineage-specific genetic markers | Medium | Highly sensitive; can be multiplexed. | Typically requires cell lysis, losing single-cell and viability data. | Orthogonal confirmation, especially when high-sensitivity detection of minor populations is needed. |
Quantitative Data from Peer-Reviewed Studies
Empirical data underscores the necessity and performance of purity assessment. A comprehensive study on lineage-specific chimerism monitoring highlights the effectiveness of flow cytometry for this purpose.
Table 2: Representative quantitative data on sorted cell population purity from clinical samples [105].
| Cell Population Isolated | Number of Samples Tested | Samples with >90% Purity | Samples with >99% Purity | Comment |
|---|---|---|---|---|
| CD3+ T Cells | 303 | 290 (95.7%) | 215 (71.0%) | Demonstrates high efficacy of isolation methods, but also shows unpredictable variability, making individual sample assessment critical. |
This data confirms that while most isolation procedures are highly efficient, a significant number of samples (over 28% in this cohort) fell below the 99% purity threshold. Relying on assumed purity rather than measured purity for these samples could have led to substantial inaccuracies in downstream genetic analysis like chimerism testing.
The Scientist's Toolkit: Essential Reagents and Materials
Successful purity assessment relies on a foundation of high-quality reagents and standardized protocols. The following table details key components of the workflow.
Table 3: Essential research reagents and materials for flow cytometry-based purity assessment.
| Item | Function & Importance | Example(s) |
|---|---|---|
| Fluorochrome-conjugated Antibodies | Specifically bind to surface or intracellular markers (e.g., CD45, CD3, CD4, CD34, pluripotency markers) to identify target cells. Titration is critical for optimal signal-to-noise ratio [3]. | CD45-APC, CD3-PE, CD4-FITC, CD8-PerCP [107]; Antibodies against NANOG, OCT4 for pluripotency [3]. |
| Isotype Controls | Differentiate specific antibody binding from non-specific background fluorescence, essential for setting positive/negative gates. | Mouse IgG1, IgG2a, etc., conjugated to the same fluorochrome as the test antibody. |
| Viability Stains | Distinguish live cells from dead cells, allowing for their exclusion from analysis to prevent false positives from permeable dead cells. | Propidium Iodide (PI), 7-AAD [1]. |
| Cell Isolation Kits | Enable the positive or negative selection of target cell populations from a heterogeneous mixture prior to purity assessment. | EasySep, RoboSep kits for T cells, B cells, etc. [1]. |
| Flow Cytometer & Analysis Software | Instrument for acquiring light scatter and fluorescence data; software for data analysis, gating, and quantitation. | BD FACSCalibur with CellQuest software [107]; modern analyzers with 15-60 parameter capability [2]. |
Workflow and Data Interpretation
The following diagram illustrates the logical workflow for the quantitative verification of an isolated cell population, from initial isolation to final data interpretation, integrating the principles and methods discussed.
Diagram 1: Logical workflow for the quantitative verification of cell population purity. The process begins with the isolated population and proceeds through staining and data acquisition. The critical step is applying a consistent gating strategy to determine if the sample meets pre-defined quality control (QC) criteria, which dictates whether to proceed or troubleshoot.
A critical aspect of data interpretation is the gating strategy used during flow cytometry analysis. The correct approach ensures that the calculated purity is accurate and reflective of the viable, target cell population.
Diagram 2: Stepwise flow cytometry gating strategy for accurate purity assessment. Sequential gating first identifies the cellular population, then excludes dead cells, before finally quantifying the target marker-positive cells. This layered approach prevents overestimation of purity by non-cellular debris or dead cells.
Quantitative purity assessment is an indispensable component of rigorous stem cell research and clinical development. As the data and protocols outlined herein demonstrate, flow cytometry provides a versatile, high-throughput, and statistically robust platform for this critical verification. While orthogonal methods like STR profiling and advanced techniques like imaging flow cytometry play specific and important roles, conventional flow cytometry remains the most accessible and widely applicable tool for ensuring that isolated cell populations meet the stringent quality standards required for reproducible and reliable science. Integrating mandatory purity checks, as mandated by leading scientific bodies, into standard operating procedures is no longer optional but a fundamental pillar of responsible and translatable stem cell research.
In the field of stem cell research using flow cytometry, cross-laboratory reproducibility represents a significant challenge for scientific advancement and therapeutic development. The consistency of multiparametric flow cytometry data across different research sites is crucial for validating findings, particularly when characterizing stem cell lines for clinical applications. This guide examines the current obstacles to standardization and objectively compares emerging solutions designed to enhance reproducibility in global clinical trials and multi-center studies, with particular relevance to authentication of stem cell lines.
The Standardization Challenge in Flow Cytometry
Flow cytometry provides invaluable insights through its multiparametric analysis, single-cell resolution, and high-throughput evaluation capabilities. However, in multi-center or global clinical trials, the use of different instruments, reagents, and operators at each site introduces significant variability in flow cytometry readouts, making cross-site comparisons challenging [108]. This variability presents both logistical and scientific hurdles for drug developers. When results from different sites cannot be directly compared, it leads to delays, increased costs, and necessitates re-analysis or additional testing to achieve reliable data [108].
The problem extends beyond instrumentation to cellular materials themselves. Estimates indicate that between 18-36% of all established cell lines are affected by contamination or misidentification [109]. There have been documented cases where cell lines distributed as human stem cells were subsequently identified as originating from different species through mitochondrial DNA analysis, compromising years of research [109]. These issues underscore the critical need for robust standardization protocols in stem cell authentication.
Methodological Approaches to Standardization
Lyophilized Bead Technology for Instrument Alignment
A novel approach addressing instrumental variability utilizes pre-stained, lyophilized polystyrene microbeads (such as BD CompBeads) stained with specific CD4 antibodies and freeze-dried to maintain stability at room temperature for up to 18 months [108]. These standardized beads are shipped to multiple laboratories where each site calibrates their instruments to target values, creating a unified 'fleet' of instruments across locations [108].
Experimental Protocol:
- Stain polystyrene microbeads with CD4 antibodies
- Lyophilize beads to ensure 18-month stability at room temperature
- Distribute beads to participating laboratories
- Calibrate each harmonized instrument to the target values using the beads
- Validate performance consistency through mean fluorescence intensity (MFI) readings at multiple time points post-resuspension (15 mins, 30 mins, 1, 2, 4, 6, 8, 24, and 48 hours) [108]
Cell Line Authentication Methods
Robust cell authentication is equally critical for research reproducibility, with several methodological approaches available:
- Short Tandem Repeat (STR) Profiling: The comprehensive standard (ASN-0002) for human cell line authentication, comparing multiple STR loci to reference databases [110] [109]
- Species-Specific Mitochondrial DNA Analysis: A sensitive method detecting interspecies contamination by analyzing the mitochondrially encoded gene for cytochrome b or the hypervariable region of the control D-loop [109]
- Karyotyping: Traditional cytogenetic analysis identifying chromosomal alterations, though labor-intensive and expensive [109]
- Isoenzyme Analysis: Detects interspecies contamination of at least 10% [109]
Standardization Challenges and Approaches
Comparative Performance Data
Lyophilized Bead Stability and Performance
Table 1: Fluorochrome Stability Assessment in Lyophilized Beads
| Fluorochrome | Initial Stability | Stability at 1 Year | Post-Resuspension Stable Duration | Replacement Strategy |
|---|---|---|---|---|
| BB700 | Unstable | Not tested | <4 hours | Replaced with RB705 |
| APC | Unstable | Not tested | <4 hours | Replaced with Alexa-647 |
| APC-R700 | Unstable | Not tested | <4 hours | Replaced with Alexa Fluor-700 |
| RB705 | Stable | Stable | >8 hours | - |
| Alexa-647 | Stable | Stable | >8 hours | - |
| Alexa Fluor-700 | Stable | Stable | >8 hours | - |
The stability testing revealed that while most dyes remained stable after resuspension, certain fluorochromes (BB700, APC, and APC-R700) demonstrated instability, necessitating replacement with more robust alternatives (RB705, Alexa-647, and Alexa Fluor-700 respectively) to create an updated kit supporting stable signal acquisition for up to 8 hours post-resuspension [108].
Cross-Site Assay Performance Comparison
Following instrument harmonization using lyophilized beads, assay reproducibility was tested by comparing 14 inter- and intra-site readouts from a reference sample with samples from three healthy donors [108]. Results demonstrated successful assay alignment across all active sites, with readouts in receiving laboratories showing:
- Coefficient of variation below the official criteria of 25% compared to reference laboratory
- Majority of comparisons below 10% coefficient of variation
- Effective translation of instrument-level harmonization to assay-level consistency [108]
Table 2: Method Comparison for Standardization Approaches
| Method | Application Scope | Sensitivity | Implementation Complexity | Cost Considerations | Time Requirements |
|---|---|---|---|---|---|
| Lyophilized Bead Alignment | Instrument calibration | High (multiple parameters) | Moderate | Higher initial, lower long-term | Rapid implementation |
| STR Profiling | Cell line authentication | High (individual-specific) | Moderate | Moderate | 1-2 days |
| mtDNA Analysis | Species verification | High (multiple copies) | Low to moderate | Low to moderate | 1-2 days |
| Karyotyping | Chromosomal analysis | Very high | High | High | 1-2 weeks |
| Isoenzyme Analysis | Species detection | Low (≥10% contamination) | Low | Low | 1 day |
The Scientist's Toolkit: Essential Research Reagent Solutions
Table 3: Key Reagents for Flow Cytometry Standardization and Cell Authentication
| Reagent / Material | Function | Application Context |
|---|---|---|
| Lyophilized CompBeads | Instrument calibration and cross-site standardization | Multi-center flow cytometry studies |
| STR Profiling Kits | DNA fingerprinting for cell line authentication | Stem cell line validation |
| mtDNA Analysis Reagents | Species-specific verification of cell origins | Detection of interspecies contamination |
| Fluorescence-Minus-One (FMO) Controls | Assess labeling of dim and modulated markers in multicolor panels | Panel validation and gating strategy |
| Viability Markers | Exclusion of dead cells with non-specific antibody binding and autofluorescence | Sample quality control |
| Single-Color Compensation Controls | Spectral deconvolution for multicolor analysis | Instrument setup and panel optimization |
| Isotope-Matched Antibodies | Assessment of non-specific labeling (though use is declining) | Specificity validation |
Experimental Workflow for Comprehensive Standardization
Standardization Workflow for Cross-Lab Studies
Best Practices for Enhanced Reproducibility
Flow Cytometry Data Acquisition and Analysis
Successful implementation requires attention to multiple technical factors:
Instrument Quality Control: Perform daily quality control using fluorescent particles with known properties and practice detector "voltration" to establish optimal ranges [111]
Sample Preparation: Create single-cell suspensions with minimal debris and clumping, include viability markers, and filter samples immediately prior to acquisition [111]
Panel Design: Assign low-density markers to bright fluorochromes and mutually inclusive markers to probes with dissimilar spectral properties [111]
Data Acquisition: Save statistically valid event numbers based on gated regions, enter all experiment information into FCS data files, and ensure all controls are run and saved [111]
Data Analysis: Utilize probability state analysis packages for high-dimensional data but monitor software-driven operations and consider consulting specialists for complex analyses [111]
Cell Line Authentication Protocols
For research publications and therapeutic development:
- Regular Authentication: Implement STR profiling at regular intervals during long-term culture [110] [109]
- Mycoplasma Testing: Conduct frequent screening for microbial contamination [110]
- Documentation: Maintain records of authentication methods, outcomes, and dates for journal submissions [110]
- Reference Databases: Compare STR profiles against known databases such as DSMZ to identify cross-contaminated lines [109]
The harmonization of flow cytometry practices across laboratories through lyophilized bead technology and robust cell authentication methods represents a transformative approach to addressing reproducibility challenges in stem cell research. The experimental data presented demonstrates that standardized beads can maintain stability for extended periods, facilitate consistent instrument performance, and enable reliable cross-site data comparison with coefficients of variation below 10-25%. When combined with rigorous cell line authentication through STR profiling and mitochondrial DNA analysis, these approaches provide a comprehensive framework for enhancing the reliability of flow cytometry data in characterizing stem cell lines. As the field advances toward increased parameter analysis and clinical applications, such standardization methodologies will be crucial for ensuring that research findings are reproducible, reliable, and translatable to therapeutic development.
In stem cell research, flow cytometry serves as a powerful tool for phenotypically characterizing cell populations based on surface and intracellular marker expression. However, phenotypic characterization alone provides limited information about the functional capacity and true biological state of stem cells. Correlative analysis, which integrates flow cytometric data with functional assay outcomes, establishes a comprehensive validation framework that bridges marker expression with biological function. This approach is particularly critical for authenticating stem cell lines, where functional potency determines their utility in regenerative medicine, disease modeling, and drug discovery [2] [3].
The growing emphasis on standardization within the field, exemplified by initiatives like the "ISSCR Standards for Human Stem Cell Use in Research," underscores the importance of rigorous validation methodologies that combine multiple assessment modalities [112]. This guide examines current approaches for correlating flow cytometry data with functional assessments, comparing their applications, experimental requirements, and contributions to stem cell authentication.
Flow Cytometry Assays for Stem Cell Characterization
Marker-Based Phenotypic Identification
Flow cytometry enables multiparameter analysis of stem cells at single-cell resolution, providing quantitative assessment of specific marker expression crucial for defining cell identity. For induced pluripotent stem cells (iPSCs), key undifferentiated markers include surface proteins (e.g., TRA-1-60, TRA-1-81, SSEA-4) and intracellular transcription factors (e.g., Nanog, Oct4) [3]. The accuracy of these measurements depends heavily on optimized protocols for sample preparation, staining, and instrument acquisition.
Recent methodological advances have established cost-effective platforms for evaluating pluripotency status in iPSCs through simultaneous measurement of surface and intracellular markers. These protocols require careful experimental optimization, including:
- Antibody titration to determine optimal staining concentrations
- Fixation and permeabilization buffer selection to preserve epitopes and cellular morphology
- Fluorochrome selection to minimize spectral overlap while maximizing signal detection [3]
The table below summarizes key research reagents essential for successful flow cytometric analysis of stem cells:
Table 1: Research Reagent Solutions for Stem Cell Flow Cytometry
| Reagent Category | Specific Examples | Function & Importance |
|---|---|---|
| Fixation/Permeabilization Buffers | BD Pharmingen FoxP3 Buffer Set, Transcription Factor Buffer Set [40] | Preserves cell structure while allowing intracellular antibody access; critical for transcription factor staining |
| Fluorochrome-Conjugated Antibodies | Anti-TRA-1-60, Anti-SSEA-4, Anti-Nanog [3] | Enables detection of specific surface and intracellular markers |
| Viability Dyes | Propidium Iodide, DAPI [2] | Distinguishes live from dead cells during analysis |
| Cell Sorting Media | Specialized FACS buffers with serum alternatives [2] | Maintains cell viability during sorting procedures |
Technical Considerations for Intracellular Staining
The critical importance of fixation and permeabilization methods cannot be overstated when assessing intracellular markers. Buffer selection significantly impacts fluorescence signal intensity and background levels. Comparative studies demonstrate that different commercial buffer systems yield substantially different resolution of critical populations. For example, when assessing T regulatory cells (CD45+CD3+CD4+FoxP3+), the BD Pharmingen FoxP3 Buffer Set provided superior resolution of the CD25+FoxP3+ population compared to other commercial systems, which showed decreased marker resolution and population distinction [40].
Additionally, alcohol-based fixation methods can dramatically alter light scatter properties and surface epitope detection, potentially compromising data quality. Consistent staining methodologies are therefore essential throughout a research project, particularly when evaluating inter-donor variation over time [40].
Functional Assays for Stem Cell Validation
Engraftment and Differentiation Capacity
For hematopoietic stem cells (HSCs) and their derivatives, functional engraftment represents the definitive assessment of cellular potency. The Dihydrorhodamine-123 (DHR-123) flow cytometry assay provides a rapid, inexpensive method for measuring functional donor neutrophil engraftment in chronic granulomatous disease patients post-transplant. This assay demonstrates exceptional correlation (R² = 0.9965) with traditional molecular chimerism methods like quantitative PCR and next-generation sequencing, validating its use as a precise functional assessment tool [113].
Signaling Pathway Functionality
Reporter assays represent another powerful approach for functional validation. Flow cytometric reporter systems that combine fluorescent protein tagging with signaling pathway activation readouts enable simultaneous assessment of protein expression and function at single-cell resolution. This methodology offers significant advantages over conventional bulk population luciferase assays by:
- Excluding nontransfected cells from analysis
- Identifying overexpressing cells that signal spontaneously
- Detecting protein variants that fail to express properly
- Revealing protein concentration-dependent effects of mutations [114]
This approach was successfully applied to analyze Toll-like receptor 4 (TLR4) and its adapter protein MyD88, using an NF-κB–responsive promoter driving mScarlet-I expression. The dual-fluorophore system enabled highly sensitive measurements, with cells expressing appropriate GFP-MyD88 levels showing approximately 200-fold induction of mScarlet-I upon lipopolysaccharide stimulation [114].
Diagram 1: TLR4 Signaling Pathway in Reporter Assay
Multi-Parameter Functional Secretion Profiling
For comprehensive functional characterization, multiplex cytokine profiling provides systems-level insights into secretory function. Recent advances have simplified these assays through lyophilized reagent systems that eliminate cold storage requirements and reduce procedural steps. When applied to disease modeling contexts like COVID-19 or HBV infection, these multiparameter functional data can be integrated with machine learning approaches to predict disease severity and therapeutic outcomes [115].
Table 2: Comparison of Functional Validation Approaches
| Functional Assay Type | Measured Parameters | Stem Cell Application | Correlation Method |
|---|---|---|---|
| DHR-123 Assay [113] | Neutrophil oxidative burst, engraftment potential | Hematopoietic stem cell transplantation | Compares flow cytometry results with molecular chimerism data |
| Dual Fluorophore Reporter [114] | Signaling pathway activation, protein expression | iPSC-derived immune cells, pathway analysis | Correlates protein expression levels with signaling output |
| Multiplex Cytokine Profiling [115] | Secretory profile, immune modulation | MSC immunomodulatory function | Links secretory profile to functional potency |
| Pluripotency Differentiation [3] | Trilineage differentiation capacity | iPSC pluripotency verification | Correlates marker expression with differentiation potential |
Experimental Protocols for Correlative Analysis
Protocol 1: Pluripotency Status Assessment via Flow Cytometry
This protocol enables cost-effective verification of iPSC pluripotency status through coordinated measurement of surface and intracellular undifferentiated stem cell markers [3].
Basic Protocol 1: iPSC Culture and Collection
- Culture iPSCs under standard conditions on feeder layers or feeder-free systems
- Harvest cells using gentle dissociation reagents to maintain viability
- Prepare single-cell suspensions using enzymatic or mechanical methods
- Aliquot cells for parallel functional assays (e.g., embryoid body formation)
Basic Protocol 2: Staining for Extracellular and Intracellular Markers
- Divide cell aliquots for surface-only and intracellular staining panels
- For surface staining: Incubate with fluorochrome-conjugated antibodies against TRA-1-60, TRA-1-81, SSEA-4 for 30 minutes at 4°C
- For intracellular staining: Fix and permeabilize cells using optimized buffer systems
- Incubate fixed cells with antibodies against Nanog, Oct4 transcription factors
- Include viability dye in final resuspension buffer to exclude dead cells
Basic Protocol 3: Flow Cytometry Acquisition and Analysis
- Acquire data using standardized instrument settings across experiments
- Include appropriate controls: unstained, fluorescence minus one (FMO), and isotype controls
- Analyze data using sequential gating strategy: single cells → viable cells → marker-positive populations
- Correlate marker expression patterns with parallel functional assay outcomes
Protocol 2: Signaling Pathway Function Assay
This protocol adapts fluorescent reporter systems for assessing signaling protein function in stem cell derivatives, using TLR4/MyD88 signaling as an exemplar [114].
Cell Line Preparation
- Utilize HEK293 cells with stably integrated NF-κB–driven mScarlet-I reporter
- Knock out endogenous MyD88 using CRISPR/Cas9 system
- Validate knockout through Western blot and functional testing
Transient Transfection and Stimulation
- Transfect cells with mEGFP-tagged MyD88 constructs (25ng plasmid per well)
- Include non-fluorescently tagged MyD88-V5 as control
- Stimulate with LPS (16 hours) to activate TLR4 signaling pathway
- Include unstimulated controls for baseline measurement
Flow Cytometric Analysis
- Gate on transfected population based on mEGFP expression
- Exclude overexpressing cells that signal spontaneously
- Analyze mScarlet-I induction in response to LPS stimulation
- Compare signaling efficiency across expression levels
- Correlate protein expression levels (GFP intensity) with signaling output (mScarlet-I)
Diagram 2: Signaling Assay Workflow
Comparative Analysis of Correlation Approaches
Methodological Strengths and Limitations
Each correlative approach offers distinct advantages for specific applications in stem cell authentication:
Flow Cytometry with Functional Engraftment Assays
- Strength: Provides direct assessment of in vivo functionality and therapeutic potential
- Strength: High correlation with molecular methods validates biological relevance
- Limitation: Primarily applicable to hematopoietic lineages
- Best for: Transplantation studies and therapeutic product validation [113]
Flow Cytometry with Signaling Reporter Assays
- Strength: Enables single-cell resolution of protein expression and function
- Strength: Identifies expression thresholds for spontaneous signaling
- Limitation: Requires specialized reporter cell lines
- Best for: Pathway analysis in genetically modified stem cells [114]
Surface/Intracellular Marker with Differentiation Capacity
- Strength: Directly links phenotypic markers with functional potential
- Strength: Applicable to diverse stem cell types
- Limitation: Differentiation assays are time-intensive
- Best for: Pluripotency verification and lineage commitment studies [3]
Emerging Technologies Enhancing Correlation
Spectral flow cytometry represents a significant technological advancement that expands correlation capabilities. By reading the full fluorescence spectrum of fluorophores, spectral cytometry dramatically increases the number of analyzable parameters in a single panel. This enables more comprehensive phenotypic characterization that can be correlated with functional outcomes, particularly valuable for deep immunophenotyping of complex stem cell populations and their derivatives [116].
The development of lyophilized reagent systems for multiplex assays simplifies complex functional measurements while improving reproducibility. These advances facilitate the integration of functional data with phenotypic characterization by reducing technical variability across experiments and sites [115].
Correlative analysis that integrates flow cytometric phenotyping with functional assessments provides a robust validation framework for stem cell authentication. The specific approach should be selected based on stem cell type, intended application, and available resources. For clinical applications and therapeutic development, correlation with functional outcomes like engraftment capacity or secretory profile provides critical validation of phenotypic data. For basic research applications, signaling reporter systems offer unprecedented resolution of pathway activity at single-cell level.
As the field advances toward standardized characterization frameworks, these correlative approaches will play an increasingly important role in ensuring rigor and reproducibility in stem cell research. The integration of multiple validation modalities provides the comprehensive assessment necessary to confidently authenticate stem cell lines for research and therapeutic applications [112].
Within flow cytometry authentication of stem cell lines, the identification of unique surface markers is paramount for ensuring lineage purity, functional characterization, and translational safety [104]. Aptamers, single-stranded DNA or RNA oligonucleotides that bind specific targets with high affinity, have emerged as promising alternatives to antibodies for cell surface profiling due to their superior stability, easier modification, and lower production costs [117] [118] [119]. However, their path to reliable application is fraught with validation challenges. This case study examines a landmark comparative analysis that systematically evaluated cell-targeting aptamers, extracting critical lessons for their use in authenticating stem cell populations and other advanced cell models [118] [120]. The findings underscore the necessity of rigorous, standardized validation to ensure that these reagents deliver precise and reproducible data for critical research and development decisions.
Aptamer Performance: A Comparative Analysis
A pivotal 2021 study in Nature Communications provided a sobering assessment of the field by evaluating 15 reported aptamers under standardized conditions [118] [120]. The investigators chemically synthesized aptamers reported to target therapeutically relevant cancer surface markers, including PSMA, EGFR, hTfR, HER2, AXL, EpCAM, and PTK7 [120]. The validation workflow was comprehensive, employing flow cytometry to assess binding on a panel of 11 cancer cell lines, correlating results with antibody controls, and using siRNA transfection to confirm target specificity [118] [120]. Finally, a subset of candidates was tested for in vivo tumor localization via near-infrared imaging [118] [120].
Key Experimental Findings and Data
The study revealed significant discrepancies between reported and observed aptamer performance. Of the 15 aptamers tested, only five demonstrated specific binding to their reported targets in the standardized in vitro assays [118] [120].
Table 1: Validated Aptamers from Comparative Study
| Aptamer Name | Reported Target | SELEX Method | Performance Outcome |
|---|---|---|---|
| E07.min | EGFR | Protein | Confirmed receptor-specific activity |
| A9.min | PSMA | Protein | Confirmed receptor-specific activity |
| C2.min | hTfR | Protein/Cells | Confirmed receptor-specific activity |
| Waz | hTfR | Protein/Cells | Confirmed receptor-specific activity; capable of in vivo tumor localization |
| Sgc8c (DNA) | PTK7 | Cells | Confirmed receptor-specific activity |
A critical finding was the disconnect between in vitro binding and in vivo efficacy. While several aptamers bound their targets in cell culture, only the anti-hTfR aptamer Waz proved capable of localizing to prostate tumors following systemic administration in mouse models [118] [120]. This highlights that target binding alone is insufficient for therapeutic delivery applications. The study also identified a pervasive issue of non-specific binding, particularly with prolonged incubation times, which could be mitigated—though not eliminated—by including non-specific competitor DNA (e.g., 1 mg/mL ssDNA) in the assay buffer [118] [120].
Experimental Protocols for Aptamer Validation
The comparative study established a robust, standardized methodology for evaluating aptamer function, which serves as a model for researchers validating these reagents for stem cell surface marker analysis [118] [120].
Flow Cytometry Binding Assay Protocol
- Aptamer Preparation: Aptamers are chemically synthesized with site-specific modifications (e.g., a 5' thiol) for consistent, site-specific conjugation to fluorescent dyes [118] [120].
- Cell Preparation: Culture adherent cells to 70-80% confluence and harvest them using enzyme-free dissociation buffers to preserve cell surface epitopes. Use a panel of cell lines with known positive and negative expression of the target antigen [118] [121].
- Staining Procedure: Resuspend ~1x10⁵ cells in cold culture media or binding buffer containing 10% FBS and a non-specific competitor (e.g., 1 mg/mL yeast tRNA or single-stranded DNA). Incubate with a range of fluorescently-labeled aptamer concentrations (e.g., 0.1-500 nM) for 30-60 minutes on ice. Include a non-targeting control aptamer sequence to assess background binding [118] [120].
- Data Acquisition and Analysis: Wash cells to remove unbound aptamer and analyze by flow cytometry. Specific binding is confirmed by correlating aptamer signal with antibody staining for the same target and demonstrating a significant signal reduction in target protein knockdown cells (via siRNA) [118] [120].
Critical Experimental Considerations
- Control Experiments: Always include a non-targeting control aptamer and competitor DNA to distinguish specific from non-specific binding [118].
- Incubation Time: Keep incubation times relatively short (e.g., <1 hour) to minimize non-specific, charge-based uptake common with prolonged exposure [118].
- Target Confirmation: Use orthogonal methods, such as siRNA knockdown or genetic knockout cells, to provide definitive evidence of target-specific binding [118] [120].
The Scientist's Toolkit: Essential Reagents and Solutions
Successful aptamer validation and application rely on a suite of specialized reagents and tools. The table below details key components for experiments aimed at stem cell surface profiling.
Table 2: Research Reagent Solutions for Aptamer-Based Cell Surface Profiling
| Reagent / Solution | Function / Application | Key Considerations |
|---|---|---|
| Modified Aptamer Library | Source for discovering new binders via cell-SELEX. | Incorporation of modified bases (e.g., tryptamino-dU) enhances functionality and binding affinity [117]. |
| Fluorochrome-conjugated Antibodies | Benchmarking and correlating aptamer binding to known surface markers. | Essential for validating target specificity; choose conjugates with minimal spectral overlap [122] [123]. |
| Non-specific Competitor (ssDNA/tRNA) | Reduces charge-based non-specific binding of aptamers to cells. | Critical for clean signal-to-noise; typically used at 1 mg/mL in staining buffer [118]. |
| Cell Line Panel | Models with known positive/negative target expression for specificity testing. | Should include relevant stem cell lines and isogenic controls for authentication studies [118] [121]. |
| High-Throughput Flow Cytometry | Simultaneous analysis of hundreds of cell surface antigens. | Enables broad surfaceome profiling and biomarker discovery on heterogeneous samples [121]. |
Implications for Stem Cell Line Authentication
The lessons from aptamer validation have direct and profound implications for stem cell research and authentication. Flow cytometry is a versatile tool for stem cell characterization, relying on specific markers to identify and isolate pure populations from a heterogeneous mix [104] [123]. The use of inadequately validated aptamers (or antibodies) risks misidentifying cell populations, leading to irreproducible results and flawed scientific conclusions.
The standardized protocols and rigorous controls outlined here provide a framework for developing and applying aptamer-based reagents to identify stem cell-specific surface markers. For instance, the comparative aptamer profiling methodology, which uses side-by-side analysis of different cell states, could be powerfully employed to identify novel surface markers specific to pluripotent stem cells, specific differentiated lineages, or stem cells with oncogenic mutations [117]. Furthermore, ensuring that aptamers used for fluorescence-activated cell sorting (FACS) are thoroughly validated is critical for obtaining high-purity stem cell populations for downstream experimentation and therapy [104].
Aptamer profiling has demonstrated that oncogenic signaling, such as mutant K-Ras expression, can dynamically alter a cell's surface composition [117]. This phenomenon is highly relevant for cancer stem cell research. These surface changes are not merely quantitative but can be qualitative; one study discovered the abnormal translocation of a mitochondrial matrix protein to the cell surface of cancer cells without detectable changes in its mRNA or total protein levels [117]. This underscores the unique capability of aptamers to uncover previously unrecognized, signaling-dependent surface markers that might be missed by genomic or transcriptomic approaches.
The comparative analysis of cell-surface targeting aptamers delivers a clear message: rigor and standardization are non-negotiable. For the field of stem cell authentication, the strategic integration of robustly validated aptamers presents a significant opportunity. By adopting the stringent validation frameworks demonstrated in recent studies—including standardized binding assays, comprehensive controls, and orthogonal verification—researchers can leverage the considerable advantages of aptamers with greater confidence. This approach will ultimately enhance the reliability of stem cell surface marker identification, improve the purity of sorted populations, and strengthen the overall integrity of research leading to future cell-based therapies.
The reproducibility of stem cell research and the safety of subsequent cell-based therapies hinge upon one critical prerequisite: the accurate authentication of cell lines. Misidentification or contamination of cell lines, such as the confusion of mesenchymal stem cells (MSCs) with fibroblasts, can compromise experimental integrity, lead to erroneous conclusions, and pose significant risks in clinical applications [124] [125]. Flow cytometry has emerged as a powerful, high-throughput technology for addressing this challenge, enabling the multiparametric analysis of cell surface markers on single cells within a heterogeneous population [126] [127]. This guide provides a objective comparison of flow cytometry-based authentication strategies for stem cell lines, framed within the broader thesis that standardized documentation and rigorous reporting are fundamental to meeting journal and regulatory standards. It is designed to equip researchers, scientists, and drug development professionals with the experimental protocols and data presentation frameworks necessary to validate their work for both scientific review and regulatory compliance.
Comparative Marker Analysis for Cell Line Authentication
A primary application of flow cytometry in stem cell research is immunophenotyping—the identification of cells based on their expression of a panel of surface and intracellular markers. The International Society for Cellular Therapy (ISCT) has proposed minimum criteria for defining MSCs, including positive expression of CD105, CD73, and CD90, and lack of expression of hematopoietic markers such as CD45, CD34, CD14/CD11b, CD79α/CD19, and HLA-DR [124] [125]. However, these markers alone are often insufficient to distinguish MSCs from fibroblasts, a common contaminant in cultures. Contaminated MSC cultures can affect cell yield and potentially lead to complications, including tumour formation after transplantation [125]. The table below synthesizes data from recent studies to provide a detailed comparison of marker expression across MSCs from different tissues and fibroblasts.
Table 1: Comparative Flow Cytometric Analysis of Marker Expression in MSCs and Fibroblasts
| Cell Surface Marker | Adipose-Derived MSCs | Bone Marrow-Derived MSCs | Wharton's Jelly-Derived MSCs | Placental MSCs | Fibroblasts (Foreskin) |
|---|---|---|---|---|---|
| CD105 | Positive [125] | Positive [125] | Positive [125] | Positive [125] | Negative/Low [125] |
| CD73 | Positive [124] | Positive [124] | Positive [124] | Positive [124] | Positive [124] |
| CD90 | Positive [124] | Positive [124] | Positive [124] | Positive [124] | Positive [124] |
| CD14 | Negative [124] | Negative [124] | Negative [125] | Negative [125] | Negative [125] |
| CD34 | Variable [124] | Negative [124] | Negative [124] | Negative [124] | Negative [124] |
| CD45 | Negative [124] | Negative [124] | Negative [124] | Negative [124] | Negative [124] |
| CD106 (VCAM-1) | Positive [125] | Positive [125] | Information Missing | Information Missing | Negative [125] |
| CD146 | Positive [125] | Positive [125] | Information Missing | Positive [125] | Negative [125] |
| CD271 | Positive [125] | Positive [125] | Information Missing | Information Missing | Negative [125] |
| CD79a | Positive [125] | Information Missing | Information Missing | Information Missing | Negative [125] |
Key Interpretations of Comparative Data
- Tissue-Specific Authentication Panels: The data indicates that no single marker universally distinguishes all MSCs from fibroblasts. Instead, authentication requires tissue-specific panels. For example, CD79a and CD271 show promise for authenticating adipose-derived MSCs, while CD106 and CD146 are more useful for bone marrow-derived MSCs [125].
- Limitations of ISCT Markers: Commonly used positive markers like CD73 and CD90 are expressed by both MSCs and fibroblasts, confirming they cannot be used for discrimination [124] [125]. This underscores the necessity of incorporating additional discriminatory markers like CD106 and CD146 into authentication protocols.
- Context of Pluripotency: For induced pluripotent stem cell (iPSC) lines, authentication includes characterizing pluripotency. Proteomic arrays targeting markers like NANOG and POU5F1 (OCT4) are used to confirm the undifferentiated state, providing a foundation for subsequent differentiation into target cells like neural or cardiac lineages [128] [129].
Experimental Protocol: A Standardized Workflow for Authentication
To ensure data meets regulatory standards, a detailed and standardized experimental protocol must be followed. The following methodology, adaptable for various cell types, ensures the generation of reliable, reproducible data suitable for documentation.
Sample Preparation and Staining
- Cell Culture and Harvesting: Culture cells under standard conditions until they reach subconfluency (≤80%). Harvest cells using a gentle dissociation enzyme like TrypLE or 0.25% trypsin-EDTA [124] [125].
- Single-Cell Suspension: Create a single-cell suspension by passing cells through a 70 µm cell strainer to remove clumps and debris. Perform a cell count and assess viability [126].
- Staining: Aliquot ~1x10^5 cells per staining tube. Centrifuge and resuspend the cell pellet in a FACS buffer (e.g., PBS with 1 mM EDTA and 5% serum). Incubate with fluorescently conjugated antibodies for 20-30 minutes at 4°C in the dark, using manufacturer-recommended quantities [124] [125].
- Washing and Fixation: Wash cells twice with FACS buffer to remove unbound antibody. Centrifuge and resuspend the final pellet in a stabilizing fixative buffer for immediate acquisition or in a buffer for intracellular staining if required [126].
Data Acquisition and Analysis
- Instrument Calibration: Prior to acquisition, perform calibration and compensation on the flow cytometer using appropriate controls (unstained cells, single-stained controls) to correct for spectral overlap [126] [127].
- Acquisition: Acquire a minimum of 10,000 events per sample on a flow cytometer such as a BD FACS Lyric or BD FACS Aria II. This ensures robust statistical analysis [130] [124].
- Gating and Analysis: Use software like BD FACSDiva or computational analysis tools for the following steps:
- Viability and Singlets Gate: Exclude dead cells and debris based on scatter properties (FSC vs. SSC). Then, gate on single cells using FSC-H vs. FSC-A to exclude doublets [126].
- Phenotypic Analysis: Analyze the fluorescence intensity of the gated single, live cells for each marker. Compare the expression profile to the established criteria for the target cell line.
- Validation: For clinical applications, validate the assay by determining its limit of detection (LOD), intra-assay, and inter-assay reproducibility [130].
The following workflow diagram visualizes this multi-stage process.
Figure 1: Flow cytometry authentication workflow.
The Scientist's Toolkit: Essential Research Reagent Solutions
Successful authentication relies on a suite of reliable reagents and instruments. The table below lists key solutions for flow cytometry-based stem cell authentication.
Table 2: Essential Reagents and Tools for Flow Cytometry Authentication
| Item Category | Specific Examples | Function in Authentication |
|---|---|---|
| Core Antibodies | Anti-CD105, Anti-CD73, Anti-CD90 [124] | Confirmation of standard MSC markers per ISCT criteria. |
| Discriminatory Antibodies | Anti-CD106, Anti-CD146, Anti-CD271 [125] | Differentiation of MSCs from fibroblasts and tissue-specific authentication. |
| Pluripotency Markers | Anti-NANOG, Anti-POU5F1 (OCT4) [129] | Characterization of induced pluripotent stem cell (iPSC) lines. |
| Viability Stain | Propidium Iodide, 7-AAD | Exclusion of dead cells from analysis to improve accuracy. |
| Flow Cytometer | BD FACSLyric, BD FACS Aria II [124] | Instrument for high-throughput, multiparametric single-cell analysis. |
| Analysis Software | BD FACSDiva, FlowJo, Cytobank [126] [127] | Software for instrument control, data acquisition, and complex data analysis. |
Data Presentation and Reporting for Regulatory Compliance
Meeting journal and regulatory standards requires transparent and comprehensive data presentation. The following practices are essential:
- Standardized Gating Strategies: Clearly document the gating hierarchy used for analysis, starting from debris exclusion, through singlet and viability gates, to the final phenotypic gates. This is crucial for reproducibility and peer review [126].
- Inclusion of Key Controls: All experimental data must include relevant controls, such as:
- Adoption of Computational Analysis: For high-parameter panels, leverage computational algorithms like t-SNE, UMAP, or FlowSOM. These tools provide an unbiased, reproducible analysis that reduces subjective manual gating and is highly valued for complex studies and multi-center trials [127].
The logical pathway for data interpretation, from raw data to final authentication call, can be summarized as follows.
Figure 2: Data interpretation logic for authentication.
Conclusion
Flow cytometry is an indispensable tool for authenticating stem cell lines, directly supporting research integrity and the translational pathway from bench to bedside. By adhering to foundational ethical principles, implementing rigorous and standardized methodologies, proactively troubleshooting technical issues, and employing robust validation strategies, researchers can generate reliable and reproducible data. Future directions will involve the continued evolution of international guidelines, the integration of advanced technologies like imaging flow cytometry, and a heightened focus on using authentication to ensure the safety and efficacy of stem cell-based therapies in clinical applications.
References
- 1. Purity Assessment by Flow Cytometry for Lineage-Specific ... [https://www.stemcell.com/purity-assessment-by-flow-cytometry-lineage-specific-chimerism-analysis-lp.html]
- 2. Flow Cytometry: a versatile tool for stem cell research [https://www.sciencedirect.com/science/article/abs/pii/S0006291X25017498]
- 3. Optimized, Efficient Measurement of the Expression ... [https://pubmed.ncbi.nlm.nih.gov/40028708/]
- 4. Single-Cell Analysis of the Muscle Stem Cell Hierarchy ... [https://www.sciencedirect.com/science/article/pii/S2211124720302357]
- 5. Chromatin and Single-Cell RNA-Seq Profiling Reveal ... [https://pmc.ncbi.nlm.nih.gov/articles/PMC5832720/]
- 6. Enhancing human pluripotent stem cell differentiation to ... [https://pmc.ncbi.nlm.nih.gov/articles/PMC12124670/]
- 7. Organoid Culture Plates [https://www.stemcell.com/products/organoid-culture-plates.html]
- 8. Corning® 96-Well Round-Bottom Microplate [https://www.stemcell.com/products/corning-96-well-round-bottom-microplate.html]
- 9. Principles of Advanced Flow Cytometry: A Practical Guide [https://pmc.ncbi.nlm.nih.gov/articles/PMC10802916/]
- 10. Direct comparison of mass cytometry and single-cell RNA ... [https://www.nature.com/articles/s41597-024-03399-6]
- 11. Flow cytometric characterization of cell surface markers to ... [https://pmc.ncbi.nlm.nih.gov/articles/PMC10507789/]
- 12. Flow Cytometry Experimental Process—Spectral versus ... [https://www.thermofisher.com/us/en/home/life-science/cell-analysis/flow-cytometry/flow-cytometry-learning-center/flow-cytometry-resource-library/flow-cytometry-methods/spectral-flow-cytometry-experimental-process.html]
- 13. Basic Stem Cell Research Standards [https://www.isscr.org/basic-research-standards]
- 14. ISSCR Standards for Human Stem Cell Use in Research [https://www.stemcell.com/psc-cell-quality/isscr-standards]
- 15. Reliable Protocols for Flow Cytometry Analysis of ... [https://pmc.ncbi.nlm.nih.gov/articles/PMC6727984/]
- 16. Flow Cytometry Protocol for Cell Surface Markers [https://www.rndsystems.com/resources/protocols/flow-cytometry-protocol-staining-membrane-associated-proteins-suspended-cells]
- 17. Recent Developments (After 2020) in Flow Cytometry ... [https://pmc.ncbi.nlm.nih.gov/articles/PMC11940362/]
- 18. Beckman Coulter CytoFLEX SRT, Flow Cytometer [https://www.fishersci.com/shop/products/cytoflex-srt-nozzle-mod-100um/NC2332501]
- 19. Flow cytometer [https://www.hamamatsu.com/jp/en/applications/life-sciences/flow-cytometry.html]
- 20. The quest of cell surface markers for stem cell therapy - PMC [https://pmc.ncbi.nlm.nih.gov/articles/PMC11073434/]
- 21. PSC Gene and Cell Surface Marker Expression | Cell Quality [https://www.stemcell.com/psc-cell-quality/gene-marker-expression]
- 22. Validated methods for isolation and qualification of ... [https://translational-medicine.biomedcentral.com/articles/10.1186/s12967-025-06972-8]
- 23. Mesenchymal Stem Cell (MSC) Markers [https://www.novusbio.com/research-areas/stem-cells/mesenchymal-stem-cell-markers?srsltid=AfmBOopPvuPPceQmm80lcjd-uJ-zlThrNGpp7BNMGeVHYB3ZlDpIGXic]
- 24. Mesenchymal Stem Cell Markers [https://www.rndsystems.com/resources/cell-markers/stem-cells/mesenchymal-stem-cell/mesenchymal-stem-cell-markers]
- 25. A user's guide to multicolor flow cytometry panels for ... [https://www.sciencedirect.com/science/article/pii/S0003269721001111]
- 26. Single-cell analysis at the protein level delineates intracellular ... [https://bmcbiol.biomedcentral.com/articles/10.1186/s12915-021-01138-6]
- 27. Pluripotent Stem Cell-Derived Mesenchymal ... [https://pmc.ncbi.nlm.nih.gov/articles/PMC7823915/]
- 28. A call to adopt a “fit for purpose” approach to antibody ... [https://pmc.ncbi.nlm.nih.gov/articles/PMC6879911/]
- 29. Guidelines for managing and using the digital phenotypes of ... [https://pmc.ncbi.nlm.nih.gov/articles/PMC11561460/]
- 30. Reliable Protocols for Flow Cytometry Analysis of Intracellular ... [https://pubmed.ncbi.nlm.nih.gov/31479597/]
- 31. Section 1: Basic Characterization [https://www.isscr.org/basic-research-standards/basic-characterization]
- 32. Generalized linear modeling of flow cytometry data to ... [https://www.nature.com/articles/s41540-025-00572-4]
- 33. Clinical validation of a real-time machine learning-based ... [https://pubmed.ncbi.nlm.nih.gov/40016870/]
- 34. Cell Dissociation Methods for Disaggregation of Tissue [https://www.akadeum.com/blog/cell-dissociation/?srsltid=AfmBOoqTgARa10A7900beZMuIs-LwieWXsu3ejUNnF0BXN4JpIQtBVbn]
- 35. Recent advancements in tissue dissociation techniques for ... [https://pmc.ncbi.nlm.nih.gov/articles/PMC12622302/]
- 36. Fixation Strategies and Formulations Used in IHC Staining [https://www.thermofisher.com/us/en/home/life-science/protein-biology/protein-biology-learning-center/protein-biology-resource-library/pierce-protein-methods/fixation-strategies-formulations.html]
- 37. Comparison of Fixation Methods for Preservation Cytology ... [https://pmc.ncbi.nlm.nih.gov/articles/PMC6953932/]
- 38. Comparative analysis of fixation techniques for signal ... [https://www.sciencedirect.com/science/article/pii/S0012160624002276]
- 39. Successful Immunofluorescence: Fixation & Permeabilization [https://blog.cellsignal.com/successful-immunofluorescence-fixation-and-permeabilization]
- 40. Comparison of Different Fix/Permeabilization Buffers for use in ... [https://blog.td2inc.com/comparison-of-different-fix-permeabilization-buffers]
- 41. Assessment of Different Permeabilization Methods ... [https://pmc.ncbi.nlm.nih.gov/articles/PMC3895578/]
- 42. Panel Design [https://www.bdbiosciences.com/en-us/resources/panel-design]
- 43. Tools to Improve Your Panel Design – Determining Antigen ... [https://expertcytometry.com/tools-to-improve-your-panel-design-determining-antigen-density/]
- 44. Are These Cardiomyocytes? Protocol Development ... [https://pmc.ncbi.nlm.nih.gov/articles/PMC6373208/]
- 45. Are These Cardiomyocytes? Protocol Development ... [https://www.sciencedirect.com/science/article/pii/S2213671118305356]
- 46. Harnessing 3D cell models and high-resolution imaging to ... [https://pmc.ncbi.nlm.nih.gov/articles/PMC12277333/]
- 47. Modeling methods of different tumor organoids and their ... [https://www.oaepublish.com/articles/cdr.2025.34]
- 48. Flow cytometry protocol for cell death analysis in glioblastoma ... [https://journals.plos.org/plosone/article?id=10.1371/journal.pone.0327660]
- 49. A Beginner's Guide To Analyzing and Visualizing Mass ... [https://pmc.ncbi.nlm.nih.gov/articles/PMC5765874/]
- 50. Designing a multicolor flow cytometry panel [https://www.abcam.co.jp/primary-antibodies/multicolor-flow-cytometry-panel-design]
- 51. Flow cytometry and cell sorting - PMC - PubMed Central - NIH [https://pmc.ncbi.nlm.nih.gov/articles/PMC10703423/]
- 52. MACS vs. FACS vs. BACS™: The Advantages of BACS™ [https://www.akadeum.com/blog/macs-vs-facs-vs-bacs/?srsltid=AfmBOorY-l-IljLTXtoz1K9SK8Sp9cV2IVlBwrw6WCCVUUp8nCWtypxK]
- 53. Magnetic-activated cell sorting vs. FACS [https://biology.stackexchange.com/questions/31482/magnetic-activated-cell-sorting-vs-facs]
- 54. Cell Sorting Market Size & Outlook, 2025-2033 [https://straitsresearch.com/report/cell-sorting-market]
- 55. Cell Sorting Market | Global Market Analysis Report - 2035 [https://www.factmr.com/report/cell-sorting-market]
- 56. Cell Sorting Market Size to Hit USD 601.89 Million by 2034 [https://www.biospace.com/press-releases/cell-sorting-market-size-to-hit-usd-601-89-million-by-2034]
- 57. iPSC Characterization and Downstream Applications [https://www.sartorius.com/en/applications/life-science-research/high-throughput-screening-by-cytometry/ipsc-characterization-and-downstream-applications]
- 58. Flow Cytometry Troubleshooting Guide [https://www.bio-techne.com/applications/flow-cytometry/flow-cytometry-troubleshooting-guide]
- 59. No or weak signal in Flow cytometry [https://www.abcam.cn/technical-resources/troubleshooting/no-or-weak-signal-flow-cytometry]
- 60. The Power of Reagent Titration in Flow Cytometry - PMC [https://pmc.ncbi.nlm.nih.gov/articles/PMC11506663/]
- 61. Flow Cytometry Troubleshooting Guide [https://www.cellsignal.com/learn-and-support/troubleshooting/flow-cytometry-troubleshooting-guide?srsltid=AfmBOoopOZk4x4THueLf3SNnaWaygC2wgA-ehdj19Y_vIFnu8tqnp0Ze]
- 62. Troubleshooting Flow Cytometry Issues [https://www.bosterbio.com/protocol-and-troubleshooting/flow-cytometry-troubleshooting?srsltid=AfmBOoo-I_mbWPjwTbZQHKww4uhyqZ_q-3ZvX-BvjsAwtxks6VyP6G-R]
- 63. Optimization of the Blocking and Signal Preservation ... [https://pmc.ncbi.nlm.nih.gov/articles/PMC12462741/]
- 64. Blocking: Fc block and related reagents [https://www.colibri-cytometry.com/post/blocking-fc-block-and-related-reagents]
- 65. Viability Dyes for Flow Cytometry: It's Not Just a Matter of ... [https://bitesizebio.com/22353/viability-dyes-for-flow-cytometry-its-not-just-a-matter-of-life-and-death/]
- 66. An Overview of the Current State of Cell Viability ... [https://pmc.ncbi.nlm.nih.gov/articles/PMC11719996/]
- 67. Staining Intracellular Antigens for Flow Cytometry [https://www.thermofisher.com/us/en/home/references/protocols/cell-and-tissue-analysis/protocols/staining-intracellular-antigens-flow-cytometry.html]
- 68. Overcoming fixation and permeabilization challenges in ... [https://pmc.ncbi.nlm.nih.gov/articles/PMC11343140/]
- 69. to Guide and Fixation - FluoroFinder Permeabilization [https://fluorofinder.com/guide-to-fixation-and-permeabilization/]
- 70. Overcoming fixation and permeabilization challenges in flow ... [https://pubmed.ncbi.nlm.nih.gov/39467031/]
- 71. Protocol | Abcam Flow Cytometry [https://www.abcam.com/en-us/technical-resources/protocols/flow-cytometry-for-intracellular-and-extracellular-targets]
- 72. Perm Flow Method: Intracellular Staining Cytometry Fixation Guide [https://www.bosterbio.com/protocol-and-troubleshooting/flow-cytometry-optimization/perm-fixation-method]
- 73. Quantifying human pluripotent stem cell attributes with ... [https://pmc.ncbi.nlm.nih.gov/articles/PMC12522491/]
- 74. How to Reduce Cell Clumping in Cell Cultures [https://www.akadeum.com/blog/cell-clumping/?srsltid=AfmBOoqTEX-OqTmo_7T8Ccc9VQdCn18QFWqea8AfBrTBF3PTfsi5jVwE]
- 75. Cell Clumping Troubleshooting [https://www.sigmaaldrich.com/US/en/technical-documents/technical-article/cell-culture-and-cell-culture-analysis/mammalian-cell-culture/cell-clumping-troubleshooting?srsltid=AfmBOop1xXV1Wn9ED-dvqOn4iV8l7yW46L4EiZBbtWQA5XK7O55HR136]
- 76. 10 Tips for High-Throughput Flow Cytometry [https://www.bioradiations.com/10-tips-for-optimizing-high-throughput-flow-cytometry-assays1125/]
- 77. Sample Preparation Tips for Accurate Flow Cytometry ... [https://www.labx.com/resources/sample-preparation-tips-for-accurate-flow-cytometry-results/5521]
- 78. Flow Cytometry Protocols To Prevent Sample Clumping [https://expertcytometry.com/flow-cytometry-protocols-prevent-clumping/]
- 79. Ten Top Tips for Flow Cytometry [https://www.jacksonimmuno.com/secondary-antibody-resource/technical-tips/ten_top-tips-flow-cytometry/]
- 80. Flow Cytometry Troubleshooting Guide [https://www.cellsignal.com/learn-and-support/troubleshooting/flow-cytometry-troubleshooting-guide?srsltid=AfmBOorlSX4DOGsIaeugVi29oGPlZbbiEWvO07b6Gq57laQrTzzEoTjb]
- 81. Autofluorescence can interfere with flow cytometry imaging [https://www.bdbiosciences.com/en-us/learn/science-thought-leadership/blogs/Autofluorescence-imaging]
- 82. How does AutoSpill work and why does this produce better ... [https://www.colibri-cytometry.com/post/how-does-autospill-work-and-why-does-this-produce-better-compensation]
- 83. Guide to AutoSpill in OMIQ [https://www.omiq.ai/guides/autospill-compensation]
- 84. AutoSpill Compensation - FlowJo Documentation [https://docs.flowjo.com/flowjo/experiment-based-platforms/plat-comp-overview/autospill-compensation/]
- 85. Guidelines for the use of flow cytometry and cell sorting in ... [https://pmc.ncbi.nlm.nih.gov/articles/PMC9165548/]
- 86. Assessment and Comparison of Viability Assays for ... [https://pmc.ncbi.nlm.nih.gov/articles/PMC10872314/]
- 87. Recommended controls for flow cytometry [https://www.abcam.com/en-us/technical-resources/guides/flow-cytometry-guide/recommended-controls-for-flow-cytometry]
- 88. Propidium Iodide Cell Viability Flow Cytometry Protocol [https://www.rndsystems.com/resources/protocols/flow-cytometry-protocol-analysis-cell-viability-using-propidium-iodide]
- 89. Considerations for Flow Cytometry Gating | FACS Analysis [https://www.stemcell.com/considerations-for-facs-gating.html]
- 90. Isotype Control in Flow Cytometry [https://nanocellect.com/blog/isotype-control-in-flow-cytometry/]
- 91. Strengths And Weaknesses Of Isotype Controls In Flow ... [https://expertcytometry.com/strengths-and-weaknesses-of-isotype-controls-in-flow-cytometry/]
- 92. Stem Cell Kit for Flow Cytometry [https://immunostep.com/immunology/stem-cell-kit/]
- 93. Biological Controls | McGovern Medical School [https://med.uth.edu/imm/flow-cytometry-services/protocols-and-guidelines/biological-controls/]
- 94. NovoCyte Flow Cytometer | Your Partner in Cell Research [https://www.ols-bio.com/flow-cytometry-cell-controls]
- 95. The ABCs of finding a good antibody - PubMed Central [https://pmc.ncbi.nlm.nih.gov/articles/PMC5499787/]
- 96. Antibody Validation Strategies - Introductory Guide [https://blog.citeab.com/antibody-validation-strategies/]
- 97. Best practices for the development and fit-for-purpose ... [https://aapsopen.springeropen.com/articles/10.1186/s41120-021-00050-1]
- 98. A call to adopt a "fit for purpose" approach to antibody ... [https://pubmed.ncbi.nlm.nih.gov/31559827/]
- 99. Guide to Antibody Validation Techniques [https://www.neobiotechnologies.com/resources/antibody-validation-methods/?srsltid=AfmBOorqb8QFbGEV6BjN3bc-HFyOHsxkD5Hiv-BfcUA2w9P_Q9aRtsO5]
- 100. Antibody Validation for Flow Cytometry [https://blog.addgene.org/antibody-validation-for-flow-cytometry]
- 101. Antibody Validation Protocols - How To Choose The Most ... [https://bitesizebio.com/35190/antibody-validation-protocol-and-research/]
- 102. Imaging flow cytometry: from high - resolution ... [https://www.frontiersin.org/journals/bioengineering-and-biotechnology/articles/10.3389/fbioe.2025.1580749/full]
- 103. General requirements for stem cells - PMC [https://pmc.ncbi.nlm.nih.gov/articles/PMC7705904/]
- 104. Flow Cytometry: a versatile tool for stem cell research [https://pubmed.ncbi.nlm.nih.gov/41289730/]
- 105. Assessment of the purity of isolated cell populations for ... [https://pubmed.ncbi.nlm.nih.gov/24461006/]
- 106. Imaging flow cytometry with a real-time throughput beyond ... [https://www.nature.com/articles/s41377-025-01754-9]
- 107. A Paired Flow Cytometry–Pathology Assessment for Immune ... [https://pmc.ncbi.nlm.nih.gov/articles/PMC12566358/]
- 108. Achieving Reliable Cross-Laboratory Flow Cytometry ... [https://www.genengnews.com/topics/translational-medicine/achieving-reliable-cross-laboratory-flow-cytometry-instrument-standardization/]
- 109. Quality of Cell Products: Authenticity, Identity, Genomic ... [https://pmc.ncbi.nlm.nih.gov/articles/PMC2914413/]
- 110. Antibody & Cell Line Validation - Resources for Research ... [https://libguides.brown.edu/reproducibility/validation]
- 111. Ten Tips for Successful Flow Cytometry [https://www.biotechniques.com/cell-and-tissue-biology/how-to-10-tips-for-successful-flow-cytometry/]
- 112. Celebrating 25 Years of Advancing Stem Cell Research [https://www.wicell.org/blog/celebrating-25-years-of-advancing-stem-cell-research/]
- 113. Evaluation of a rapid flow cytometry assay to assess ... [https://pubmed.ncbi.nlm.nih.gov/41285273/?utm_source=FeedFetcher&utm_medium=rss&utm_campaign=None&utm_content=10MSL6XygFtCE0XpaQpog-pEt8342fXkY9lzrR7q6H0wVRyEa2&fc=None&ff=20251126082436&v=2.18.0.post22+67771e2]
- 114. Flow cytometric reporter assays provide robust functional ... [https://pmc.ncbi.nlm.nih.gov/articles/PMC9747584/]
- 115. Simplified flow cytometry-based assay for rapid multi- ... [https://www.frontiersin.org/journals/pharmacology/articles/10.3389/fphar.2025.1594141/full]
- 116. Spectral Flow Cytometry: The Current State and Future of ... [https://www.mdpi.com/1422-0067/26/12/5911]
- 117. Comparative aptamer profiling reveals cell surface ... [https://pmc.ncbi.nlm.nih.gov/articles/PMC12541808/]
- 118. A comparative analysis of cell surface targeting aptamers [https://www.nature.com/articles/s41467-021-26463-w]
- 119. Selection and characterization of DNA aptamers targeting ... [https://www.nature.com/articles/s42003-025-08034-7]
- 120. A comparative analysis of cell surface targeting aptamers [https://pmc.ncbi.nlm.nih.gov/articles/PMC8560833/]
- 121. Cell Surface Profiling Using High-Throughput Flow Cytometry [https://journals.plos.org/plosone/article?id=10.1371/journal.pone.0105602]
- 122. Flow Cytometry: An Overview - PMC [https://pmc.ncbi.nlm.nih.gov/articles/PMC5939936/]
- 123. Flow cytometry markers guide [https://www.abcam.com/en-us/knowledge-center/flow-cytometry/flow-cytometry-markers]
- 124. Proteomic Study Revealed a Distinction Between Human ... [https://pmc.ncbi.nlm.nih.gov/articles/PMC12408728/]
- 125. Flow cytometric characterization of cell surface markers to ... [https://www.archivesofmedicalscience.com/Flow-cytometric-characterization-of-cell-surface-markers-to-differentiate-between,131088,0,2.html]
- 126. An Update on Flow Cytometry Analysis of Hematological ... [https://pmc.ncbi.nlm.nih.gov/articles/PMC12190783/]
- 127. Advances in Multiparametric Flow Cytometry and Data ... [https://www.labx.com/resources/advances-in-multiparametric-flow-cytometry-and-data-analysis-software/5522]
- 128. Generation and characterization of three human induced ... [https://www.sciencedirect.com/science/article/pii/S1873506125001734]
- 129. Comparative CRISPRi screens reveal a human stem cell ... [https://www.nature.com/articles/s41594-025-01616-3]
- 130. Flow cytometry-based validation of soluble biomarker ... [https://www.sciencedirect.com/science/article/pii/S2352551725000630]