Choosing the Best NGS Platform for Gut Microbiome Studies: A 2025 Guide for Researchers
Selecting the optimal Next-Generation Sequencing (NGS) platform is a critical first step in gut microbiome research, influencing everything from taxonomic resolution to clinical applicability.
Choosing the Best NGS Platform for Gut Microbiome Studies: A 2025 Guide for Researchers
Abstract
Selecting the optimal Next-Generation Sequencing (NGS) platform is a critical first step in gut microbiome research, influencing everything from taxonomic resolution to clinical applicability. This article provides a comprehensive guide for researchers and drug development professionals, detailing the fundamental principles of 16S rRNA and shotgun metagenomic sequencing. It delivers a practical comparison of leading platforms like Illumina and Oxford Nanopore, explores advanced bioinformatic workflows for data analysis, and offers troubleshooting strategies for common experimental challenges. The goal is to empower scientists with the knowledge to make an informed platform choice that aligns with their specific research objectives, whether for broad microbial surveys or high-resolution, species-level characterization in the rapidly advancing field of microbiome science.
Understanding NGS Fundamentals for Gut Microbiome Analysis
The selection of an appropriate next-generation sequencing (NGS) methodology is a critical first step in gut microbiome research, directly influencing the depth, breadth, and validity of the findings. The two predominant approaches—16S rRNA gene amplicon sequencing (16S) and whole-genome shotgun metagenomic sequencing (shotgun)—offer distinct advantages and limitations [1]. While 16S sequencing targets a specific, conserved gene to profile bacterial and archaeal communities, shotgun sequencing randomly fragments and sequences all DNA in a sample, enabling comprehensive taxonomic and functional analysis of all microbial domains [2] [3]. Within the context of identifying the best NGS platform for gut microbiome studies, this guide provides an in-depth technical comparison of these core methodologies, detailing their experimental workflows, analytical outputs, and respective suitability for specific research objectives.
Methodology and Workflow Comparison
The fundamental difference between these methodologies lies in their scope: 16S sequencing is a targeted approach, while shotgun sequencing is an untargeted, holistic method.
16S rRNA Gene Amplicon Sequencing
This technique involves amplifying and sequencing specific hypervariable regions (e.g., V3-V4, V4) of the bacterial and archaeal 16S rRNA gene [4] [3] [5]. The workflow is as follows:
- DNA Extraction: Microbial DNA is isolated from gut samples (e.g., stool).
- PCR Amplification: Primers specific to conserved regions flanking the target hypervariable region(s) are used to amplify the 16S rRNA gene fragment.
- Library Preparation: The amplicons are purified, and sequencing adapters and barcodes are added to create libraries.
- Sequencing: Libraries are pooled and sequenced on platforms such as Illumina MiSeq.
- Bioinformatic Analysis: Sequences are quality-filtered, clustered into Operational Taxonomic Units (OTUs) or denoised into Amplicon Sequence Variants (ASVs), and then taxonomically classified by comparing them to reference databases like SILVA or Greengenes [3] [5].
Shotgun Metagenomic Sequencing
This technique sequences all DNA fragments in a sample without prior amplification of a specific gene [6] [1]. The workflow is as follows:
- DNA Extraction: Total genomic DNA is isolated, striving to represent all microorganisms.
- Fragmentation and Library Preparation: DNA is randomly sheared into small fragments. Adapters are ligated to these fragments to create a library, a process known as tagmentation [1].
- Sequencing: Libraries are sequenced using high-output platforms like Illumina HiSeq or NovaSeq, generating tens of millions of short reads.
- Bioinformatic Analysis: Quality-controlled reads can be:
- Directly aligned to reference genome databases (e.g., NCBI RefSeq, GTDB) for taxonomic profiling [5].
- Assembled into longer contigs to reconstruct partial or complete microbial genomes, known as Metagenome-Assembled Genomes (MAGs) [3].
- Functionally annotated by aligning them to databases of functional genes (e.g., KEGG, eggNOG) to determine the metabolic potential of the community [1].
The following diagram illustrates the core logical and procedural differences between the two workflows:
Technical Comparison and Data Output
The choice between 16S and shotgun sequencing involves trade-offs between cost, taxonomic resolution, and functional insight, as summarized in the table below.
Table 1: Head-to-Head Comparison of 16S rRNA and Shotgun Metagenomic Sequencing
| Factor | 16S rRNA Sequencing | Shotgun Metagenomic Sequencing |
|---|---|---|
| Cost per Sample | ~$50 USD [1] | Starting at ~$150 USD (varies with depth) [1] |
| Target | Specific 16S rRNA gene regions [3] | All genomic DNA in sample [3] |
| Taxonomic Coverage | Bacteria and Archaea only [1] | All domains: Bacteria, Archaea, Viruses, Fungi, Eukaryotes [1] |
| Taxonomic Resolution | Genus-level, sometimes species [1] | Species-level, often strain-level and single nucleotide variants [1] |
| Functional Profiling | No (only predicted via tools like PICRUSt) [1] | Yes (direct identification of metabolic and AR genes) [3] [1] |
| Sensitivity to Host DNA | Low (due to targeted PCR) [1] | High (requires mitigation in high-host biomass samples) [1] |
| Bioinformatics Complexity | Beginner to Intermediate [1] | Intermediate to Advanced [1] |
| Reference Databases | Well-curated (e.g., SILVA, Greengenes) [5] [1] | Larger but less complete (e.g., NCBI RefSeq, GTDB) [5] |
Quantitative Performance in Gut Microbiome Studies
Comparative studies on human gut microbiota highlight significant differences in output. Research on human stool samples demonstrated that shotgun sequencing identifies 1.5 times as many phyla and ~10 times as many genera as 16S sequencing [7]. Another study on colorectal cancer found that 16S data was sparser and exhibited lower alpha diversity, capturing only part of the community revealed by shotgun sequencing [5].
Regarding differential abundance analysis, shotgun sequencing proves significantly more powerful. In a comparison of gut compartments in chickens, shotgun sequencing identified 256 statistically significant changes in genera abundance between caeca and crop, whereas 16S sequencing detected only 108 [7]. This enhanced sensitivity allows for the detection of less abundant but potentially biologically meaningful taxa.
The Scientist's Toolkit: Essential Reagents and Materials
Successful execution of either NGS methodology requires specific laboratory and bioinformatic resources. The following table lists key solutions and their applications.
Table 2: Key Research Reagent Solutions for NGS Methodologies
| Item | Function | Example Use Cases |
|---|---|---|
| Nucleic Acid Extraction Kits | Isolation of high-quality DNA from complex gut samples. | NucleoSpin Soil Kit (Macherey-Nagel), Dneasy PowerLyzer Powersoil kit (Qiagen) [5]. |
| PCR Enzymes & Primers | Amplification of target 16S rRNA gene regions (e.g., V3-V4). | MolTaq 16S polymerase (Molzym); primers specific to hypervariable regions [6] [4]. |
| Library Prep Kits | Fragmentation, adapter ligation, and index tagging for sequencing. | Nextera XT DNA Library Prep Kit (Illumina) for shotgun sequencing [6]. |
| rRNA Depletion Kits | Removal of host and microbial rRNA to improve functional resolution in RNA-seq. | Ribo-Zero Plus rRNA Depletion Kit (Illumina) [2]. |
| Sequencing Platforms | High-throughput sequencing of prepared libraries. | Illumina MiSeq (16S), Illumina HiSeq/NovaSeq (shotgun) [4] [3]. |
| Bioinformatics Pipelines | Processing raw sequences for taxonomic and functional analysis. | QIIME2, MOTHUR (16S) [1]; MetaPhlAn, HUMAnN (shotgun) [1]; DADA2 (16S ASVs) [5]. |
| Reference Databases | Taxonomic classification and functional annotation of sequences. | SILVA, Greengenes (16S) [5]; NCBI RefSeq, GTDB, KEGG (shotgun) [5]. |
Experimental Protocols for Gut Microbiome Studies
Detailed Protocol: 16S rRNA Gene Amplicon Sequencing
This protocol is adapted from procedures used in recent clinical microbiome studies [6] [5].
Sample Collection and DNA Extraction:
- Collect fecal samples and store immediately at -80°C.
- Extract genomic DNA using a kit such as the Dneasy PowerLyzer Powersoil kit (Qiagen), designed to lyse tough microbial cell walls.
- Quantify DNA using fluorometry (e.g., Qubit).
PCR Amplification and Library Preparation:
- Amplify the V3-V4 hypervariable region of the 16S rRNA gene using primers (e.g., 341F and 805R) with overhang adapter sequences.
- PCR Reaction: Use ~50 ng genomic DNA, high-fidelity polymerase, 25-30 cycles.
- Purify PCR amplicons with magnetic beads.
- Index the amplicons in a second, limited-cycle PCR step to attach dual indices and sequencing adapters.
- Normalize and pool the final libraries.
Sequencing:
- Load the pooled library onto an Illumina MiSeq sequencer.
- Use a v3 (600-cycle) reagent kit for 2x300 bp paired-end sequencing, aiming for at least 50,000 reads per sample.
Detailed Protocol: Shotgun Metagenomic Sequencing
This protocol is based on the ISO 15189-certified MetaMIC method and other described workflows [6] [1].
Sample Collection and DNA Extraction:
- Follow steps as in 5.1, but ensure extraction method is optimized for unbiased lysis of all cell types. The NucleoSpin Soil Kit is cited for shotgun analysis [5].
- Obtain a higher DNA yield (≥100 ng) for optimal library preparation.
Library Preparation:
- Use 1-100 ng of input DNA.
- Perform tagmentation using the Nextera XT DNA Library Prep Kit (Illumina), which simultaneously fragments DNA and adds adapter sequences.
- Amplify the tagmented DNA via PCR (12 cycles) to incorporate full adapter sequences and unique dual indices.
- Clean up the libraries using magnetic beads and perform size selection to remove very short fragments.
- Quantify libraries by qPCR and pool in equimolar ratios.
Sequencing:
- Sequence the pooled library on a high-output Illumina platform (e.g., HiSeq 4000, NovaSeq 6000).
- Aim for a minimum of 10-20 million 2x150 bp paired-end reads per sample for robust taxonomic and functional profiling [7].
The decision between 16S and shotgun metagenomic sequencing for gut microbiome research is not one of superiority, but of appropriateness to the study's goals, budget, and analytical capacity. 16S rRNA sequencing remains a powerful, cost-effective tool for large-scale epidemiological studies that require high-level taxonomic profiling of bacteria and archaea across thousands of samples [5] [1]. In contrast, shotgun metagenomic sequencing is the unequivocal choice for studies demanding high-resolution taxonomic data (species- and strain-level), comprehensive coverage of all microbial domains, and direct insight into the functional potential of the microbiome [7] [5] [1].
For a research program focused on the "best NGS platform," the trajectory is clear: while 16S sequencing offers an accessible entry point, the future of mechanistic gut microbiome research lies in shotgun metagenomics. Its ability to simultaneously answer "who is there?" and "what are they doing?" provides an unparalleled, systems-level view that is essential for linking the microbiome to host health and disease, thereby empowering targeted therapeutic development.
Next-generation sequencing (NGS) has fundamentally revolutionized our ability to study the complex ecosystem of the human gut microbiome. By enabling detailed, culture-independent analysis of microbial communities, NGS provides the depth, resolution, and throughput needed to uncover the structure and function of these intricate systems [8]. As sequencing costs have decreased and bioinformatics tools have advanced, NGS has become central to explorations of how gut microbial communities contribute to human health, disease, nutrition, and therapeutic development [8] [9].
The choice of sequencing platform represents one of the most critical methodological decisions in designing a gut microbiome study. This technical guide examines the core NGS platforms and methodologies, providing a structured framework for researchers to select the optimal technology based on their specific research objectives, analytical requirements, and resource constraints. Within the context of selecting the best NGS platform for gut microbiome research, understanding the fundamental trade-offs between different sequencing approaches is paramount for generating reliable, reproducible, and biologically meaningful data.
Core NGS Methodologies: 16S rRNA vs. Shotgun Metagenomic Sequencing
Two principal NGS methodologies are commonly employed in gut microbiome research, each with distinct advantages and limitations that must be carefully considered.
16S Ribosomal RNA (16S rRNA) Gene Sequencing
16S rRNA gene sequencing, an amplicon-based approach, targets the bacterial 16S ribosomal RNA gene, which contains both highly conserved regions (serving as universal primer-binding sites) and nine hypervariable regions (V1–V9) that provide taxonomic specificity [9]. This method involves PCR amplification of selected hypervariable regions (e.g., V3-V4, V4-V5) followed by sequencing of the resulting amplicons [9]. After sequencing, data processing involves quality filtering, chimera removal, and clustering of sequences into operational taxonomic units (OTUs) or amplicon sequence variants (ASVs) based on sequence similarity, followed by taxonomic classification using reference databases such as SILVA, Greengenes, or the Ribosomal Database Project (RDP) [9].
A key advantage of 16S rRNA sequencing is its cost-effectiveness, allowing for extensive sample replication and longitudinal sampling within fixed research budgets. Furthermore, its targeted nature reduces sequencing depth requirements compared to shotgun methods. However, its primary limitation is constrained taxonomic resolution, typically reaching only to the genus level for many taxa, with limited ability to resolve species and strains [9]. It also cannot directly assess the functional potential of the microbial community, as it sequences only a single marker gene rather than the entire metagenome.
Shotgun Metagenomic Sequencing
In contrast to the targeted approach of 16S rRNA sequencing, shotgun metagenomic sequencing fragments and sequences all genomic DNA present in a sample, enabling comprehensive sampling of all genes from all organisms [8] [9] [2]. This untargeted approach allows for simultaneous taxonomic profiling at a much higher resolution (potentially to the species or strain level) and characterization of the functional potential of the microbiome by identifying protein-coding genes, metabolic pathways, and antimicrobial resistance genes [9] [2].
The main advantages of shotgun metagenomics include its comprehensive scope and functional insights. Unlike 16S rRNA sequencing, it can detect members of all domains (bacteria, archaea, viruses, eukaryotes) in a single assay [9]. The primary disadvantages are higher cost due to greater sequencing depth requirements, computational intensiveness, and increased sensitivity to host DNA contamination, particularly in gut biopsies where human cells may dominate the sample [9] [2].
Table 1: Comparison of Core NGS Methodologies for Gut Microbiome Research
| Feature | 16S rRNA Sequencing | Shotgun Metagenomics |
|---|---|---|
| Target | Specific hypervariable regions of the 16S rRNA gene [9] | All genomic DNA in sample [9] [2] |
| Taxonomic Resolution | Genus-level (limited species/strain) [9] | Species-level and strain-level possible [9] |
| Functional Insights | Indirect inference only | Direct assessment of genes and pathways [9] [2] |
| Organisms Detected | Primarily bacteria and archaea [9] | All domains (bacteria, archaea, viruses, eukaryotes) [9] |
| Cost per Sample | Lower | Higher |
| Bioinformatics Complexity | Moderate | High |
| Host DNA Contamination Sensitivity | Lower (targeted amplification) | Higher (sequences all DNA) [2] |
Comparative Analysis of Sequencing Platforms
Multiple sequencing platforms are available for gut microbiome studies, each with distinct technical characteristics that influence data output and quality. These can be broadly categorized into short-read (second-generation) and long-read (third-generation) technologies.
Short-Read Sequencing Platforms
Illumina platforms (including MiSeq, NextSeq, and NovaSeq systems) are currently the most widely used for both 16S rRNA and shotgun metagenomic sequencing. They generate high volumes of short reads (75-300 bp) with very low error rates (<0.1%), making them ideal for high-throughput, high-accuracy applications [8] [10]. Their high throughput and accuracy have established them as a benchmark for microbial community profiling [10] [2]. Ion Torrent (Thermo Fisher Scientific) technology differs by detecting pH changes during nucleotide incorporation rather than using optical methods. It offers faster turnaround times and is cost-effective for targeted panels, but has historically been associated with higher error rates in homopolymer regions [8] [11]. MGI sequencing platforms provide a cost-efficient alternative with growing global adoption, offering competitive performance for standard microbiome applications [8].
Long-Read Sequencing Platforms
Oxford Nanopore Technologies (ONT) platforms, such as the portable MinION and larger GridION and PromethION systems, utilize nanopore technology to generate long reads that can span entire genes or genomes. Key advantages include real-time sequencing, portability, and the ability to produce ultra-long reads (exceeding 1 kb) [8] [10]. This enables full-length 16S rRNA gene sequencing (~1,500 bp), which significantly improves species-level resolution [10] [12]. Historically, ONT had higher error rates (5-15%), but recent improvements in chemistry (R10.4.1 flow cells) and base-calling algorithms have substantially enhanced accuracy [10] [12]. Pacific Biosciences (PacBio) employs Single Molecule, Real-Time (SMRT) sequencing to generate long, accurate reads using its HiFi circular consensus sequencing (CCS) mode, which can achieve accuracy exceeding 99.9% by making multiple passes of the same DNA molecule [8] [12]. This technology is particularly well-suited for full-length 16S rRNA sequencing and resolving complex genomic regions [12].
Table 2: Technical Specifications of Major Sequencing Platforms for Microbiome Research
| Platform | Technology Type | Typical Read Length | Key Strengths | Key Limitations |
|---|---|---|---|---|
| Illumina | Short-read (2nd gen) [8] | 75-300 bp [8] | High accuracy, high throughput, broad application scope [8] | Limited species resolution due to short reads [10] |
| Ion Torrent | Short-read (2nd gen) [8] | 200-400 bp [8] | Fast turnaround, cost-effective for panels [8] | Homopolymer errors, lower throughput [11] |
| MGI | Short-read (2nd gen) [8] | 100-150 bp [8] | Cost-efficient alternative [8] | Growing but less established ecosystem |
| Oxford Nanopore | Long-read (3rd gen) [8] | Up to >1 Mb [8] | Real-time, portable, ultra-long reads, full-length 16S [8] [10] | Historically higher error rates (improving) [10] |
| PacBio | Long-read (3rd gen) [8] | 10-25 kb (HiFi) [8] | High accuracy long reads, ideal for genome assembly [8] [12] | Higher DNA input requirements, cost |
Performance Comparison in Gut Microbiome Studies
Comparative studies reveal that different sequencing platforms can lead to varying biological interpretations despite using the same starting material. A comprehensive 2017 study comparing Illumina MiSeq, Ion Torrent PGM, and Roche 454 GS FLX+ for 16S rRNA amplicon sequencing found that while all platforms could discriminate samples by treatment group, the relative abundance of specific taxa varied depending on the platform, library preparation method, and bioinformatics pipeline [11]. Illumina platforms generally produced the highest number of quality-filtered reads, while the choice of bioinformatics pipeline (e.g., QIIME, UPARSE, DADA2) significantly impacted alpha diversity metrics [11].
A 2025 comparative analysis of Illumina and Oxford Nanopore for respiratory microbiome profiling provided insights relevant to gut microbiome studies. The study found that Illumina captured greater species richness, while ONT's full-length 16S rRNA sequencing enabled higher taxonomic resolution for dominant species [10]. Differential abundance analysis revealed platform-specific biases: ONT overrepresented certain taxa (e.g., Enterococcus, Klebsiella) while underrepresenting others (e.g., Prevotella, Bacteroides) compared to Illumina [10]. These findings underscore that platform selection can influence the detection and quantification of specific bacterial taxa.
Another 2025 study comparing Illumina, PacBio, and ONT for soil microbiome analysis demonstrated that despite differences in sequencing accuracy, all three platforms produced consistent sample clustering based on environmental origin when using standardized bioinformatics pipelines [12]. PacBio showed slightly higher efficiency in detecting low-abundance taxa, while ONT results closely matched PacBio despite its inherent sequencing errors, suggesting that error profiles may not significantly impact the interpretation of well-represented community structures [12].
Experimental Design and Protocols
Sample Collection and Preservation
The foundation of any robust gut microbiome study begins with proper sample collection and preservation. Immediate stabilization of microbial community composition and nucleic acid integrity is crucial, particularly for multi-omics studies. Recommended practices include:
- Stool Sample Collection: Use collection tubes with DNA stabilizer that preserve microbial community composition at room temperature for extended periods (up to 3 months), maintaining both microbial titer and DNA integrity. Some stabilizers also preserve key metabolic products like short-chain fatty acids (SCFAs), facilitating integrated metagenomic and metabolomic analyses [8].
- Rapid Processing or Stabilization: If immediate freezing at -80°C is not possible, utilize stabilization solutions that halt microbial activity and preserve the in vivo community structure [8].
- Standardized Protocols: Implement consistent collection procedures across all study participants and timepoints to minimize technical variability [13].
DNA Extraction and Library Preparation
DNA extraction methodology significantly impacts downstream sequencing results. The complex matrix of stool samples presents challenges for efficient lysis, inhibitor removal, and consistent yield:
- Optimized Kits: Use DNA extraction kits specifically validated for stool samples, such as the PSP Spin Stool DNA Basic Kit or similar products, which deliver high purity, inhibitor-free nucleic acids compatible with NGS requirements [8].
- Mechanical Lysis: Incorporate bead-beating steps to ensure efficient lysis of tough bacterial cell walls, particularly for Gram-positive organisms [11].
- Library Preparation: For 16S rRNA sequencing, target appropriate hypervariable regions based on the required taxonomic resolution. The V3-V4 region is commonly used for Illumina platforms, while full-length 16S rRNA amplification is preferred for long-read platforms [10] [12]. For shotgun metagenomics, fragment DNA to appropriate sizes and use platform-specific adapter ligation protocols [9].
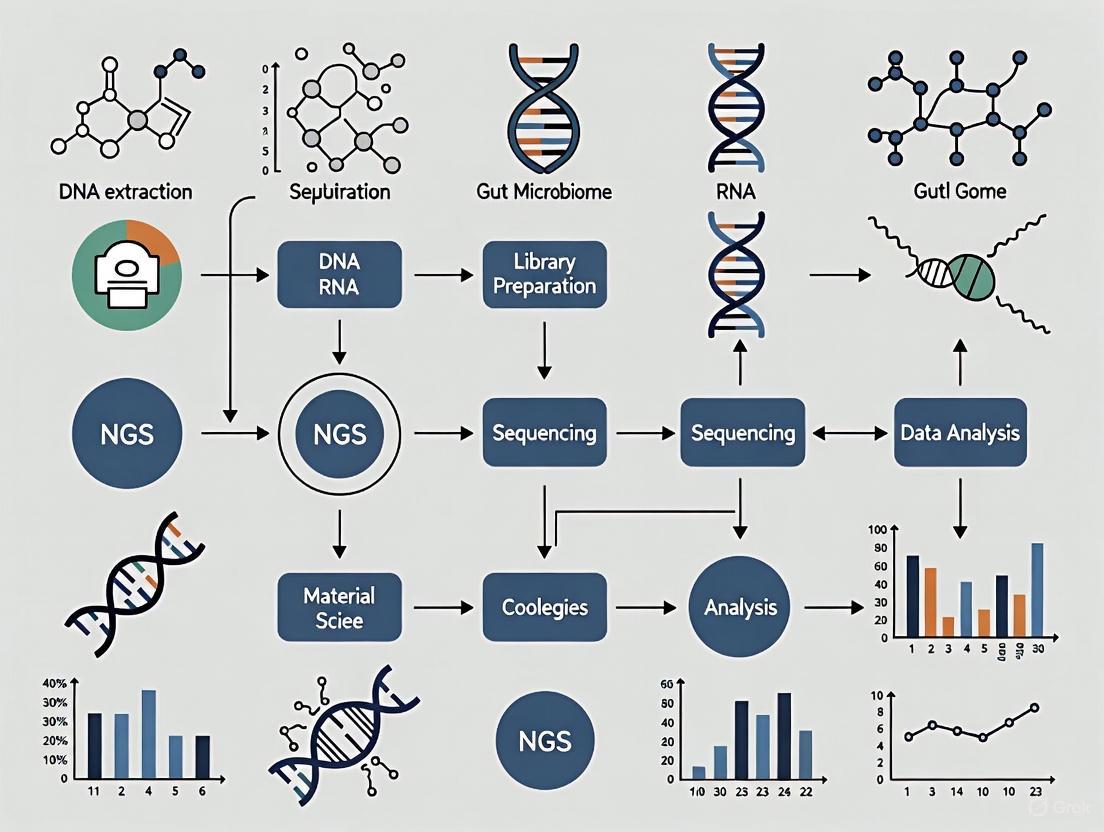
Diagram 1: NGS Workflow for Gut Microbiome Analysis. This diagram illustrates the key steps in a standardized NGS workflow for gut microbiome studies, from sample collection through to data analysis.
Bioinformatics Analysis Pipelines
The choice of bioinformatics pipeline significantly impacts the interpretation of sequencing data. Key considerations include:
- Quality Control and Preprocessing: Implement rigorous quality filtering using tools like FastQC and MultiQC, followed by adapter trimming and removal of low-quality bases [10].
- 16S rRNA-Specific Processing: For 16S rRNA data, use pipelines such as QIIME 2, mothur, or DADA2 for denoising, chimera removal, and OTU/ASV clustering [9] [11]. DADA2 and Deblur typically provide higher resolution through amplicon sequence variants (ASVs) compared to traditional OTU clustering methods [11].
- Shotgun Metagenomic Analysis: For shotgun data, perform host read removal (crucial for low-biomass samples), followed by taxonomic profiling using tools like Kraken2 or MetaPhlAn, and functional analysis using HUMAnN2 or similar pipelines [9] [2].
- Statistical Analysis and Visualization: Conduct diversity analyses (alpha and beta diversity) using appropriate metrics, and perform differential abundance testing with tools such as ANCOM-BC, DESeq2, or LEfSe [10].
Essential Research Reagent Solutions
Successful gut microbiome sequencing requires carefully selected reagents and kits at each stage of the workflow. The following table outlines key solutions validated in microbiome research.
Table 3: Essential Research Reagent Solutions for Gut Microbiome Sequencing
| Product Category | Specific Examples | Key Functions | Application Notes |
|---|---|---|---|
| Sample Collection & Stabilization | Stool Collection Tube with DNA Stabilizer [8] | Preserves microbial community DNA at room temperature; stabilizes metabolites for multi-omics | Enables room-temperature storage for up to 3 months; compatible with metabolomics [8] |
| DNA Extraction Kits | PSP Spin Stool DNA Basic Kit [8]; InviMag Stool DNA Kit [8]; E.Z.N.A. Stool DNA Kit [11] | Efficient cell lysis; inhibitor removal; high-yield DNA extraction | Bead-beating step enhances lysis of tough cells; manual and automated options available [8] [11] |
| 16S rRNA Amplification | QIAseq 16S/ITS Region Panel [10]; Ion AmpliSeq Microbiome Health Research Kit [14] | Targets hypervariable regions (V3-V4) or multiple regions for improved resolution | Ion AmpliSeq targets 8/9 hypervariable regions for enhanced species-level detection [14] |
| Library Preparation | MSB Spin PCRapace Kit [8]; SMRTbell Prep Kit 3.0 [12]; ONT 16S Barcoding Kit [10] | Fast clean-up; adapter ligation; barcoding for multiplexing | MSB Spin PCRapace completes purification in 7 minutes [8] |
| Positive Controls | ZymoBIOMICS Gut Microbiome Standard [12]; QIAseq 16S/ITS Smart Control [10] | Verification of library preparation and sequencing performance | Synthetic DNA controls monitor technical variability [10] [12] |
Platform Selection Framework for Research Objectives
Choosing the optimal sequencing platform depends on specific research questions, sample types, and resource constraints. The following decision framework guides platform selection based on common research scenarios:
Diagram 2: Sequencing Platform Selection Framework. This decision diagram guides researchers in selecting the most appropriate sequencing platform based on their specific research objectives and constraints.
Application-Specific Recommendations
- Large-Scale Epidemiological Studies: For population-scale studies involving thousands of samples where cost-effectiveness and high throughput are priorities, 16S rRNA sequencing on Illumina platforms provides the best balance of cost, throughput, and data quality [13].
- Therapeutic Target Discovery: For studies aiming to identify specific microbial strains or functional pathways for therapeutic intervention, shotgun metagenomic sequencing on Illumina platforms offers the comprehensive functional profiling needed for hypothesis generation [9] [15].
- Strain-Level Resolution Studies: When investigating strain-level variations, microbial evolution, or resolving closely related taxa, full-length 16S rRNA sequencing using PacBio HiFi or Oxford Nanopore provides the necessary taxonomic resolution [10] [12].
- Rapid Diagnostic Applications: For clinical applications requiring quick turnaround or point-of-care testing, Oxford Nanopore technologies offer real-time sequencing capabilities and portability [10] [15].
- Low-Biomass Samples: For samples with low microbial biomass or high host contamination (e.g., gut biopsies), targeted 16S rRNA sequencing is more sensitive due to PCR amplification, though careful controls for contamination are essential [2].
The landscape of gut microbiome sequencing continues to evolve rapidly, with several emerging trends shaping future research directions. Multi-omics integration represents a growing frontier, where metagenomic data is combined with metabolomic, transcriptomic, and proteomic analyses to build comprehensive models of microbiome function and host interaction [8]. Long-read technologies are progressively addressing their historical accuracy limitations, with both PacBio and Oxford Nanopore showing significant improvements that are narrowing the performance gap with short-read platforms [10] [12]. Single-cell microbiome sequencing and microfluidic applications are emerging approaches that could overcome limitations related to differential lysis efficiency and PCR amplification biases [9].
In conclusion, the choice of sequencing platform profoundly influences the depth, accuracy, and biological insights attainable in gut microbiome research. There is no universally superior platform; rather, the optimal choice depends on the specific research question, sample type, and analytical requirements. As the field progresses toward clinical applications, standardization of methodologies and rigorous validation across platforms will be essential for translating microbiome science into actionable health interventions. Researchers should carefully consider the trade-offs between resolution, throughput, cost, and analytical complexity when designing studies, and may benefit from hybrid approaches that leverage the complementary strengths of multiple sequencing technologies.
Next-generation sequencing (NGS) technologies have revolutionized microbiome research by enabling comprehensive, culture-independent analysis of microbial communities. The selection of an appropriate sequencing platform is a critical decision that directly impacts the resolution, accuracy, and scope of gut microbiome studies. While Illumina has dominated the field with its high-accuracy short-read sequencing, Pacific Biosciences (PacBio) and Oxford Nanopore Technologies (ONT) have emerged as powerful third-generation technologies offering long-read capabilities [16] [9]. This technical guide provides an in-depth comparison of these three leading platforms, focusing on their application in gut microbiome research, experimental methodologies, and performance characteristics to inform researchers and drug development professionals selecting optimal sequencing strategies.
The evolution from first-generation Sanger sequencing to today's NGS platforms represents a transformative shift in genomic capabilities. Second-generation platforms like Illumina introduced massively parallel sequencing, dramatically reducing costs and time requirements while increasing throughput [17]. Third-generation technologies from PacBio and ONT further advanced the field by enabling single-molecule sequencing without amplification, producing long reads that span complex genomic regions [17]. Understanding the technical foundations of each platform is essential for designing robust gut microbiome studies that deliver meaningful biological insights.
Illumina: Short-Read Sequencing by Synthesis
Illumina's technology employs sequencing by synthesis (SBS) with fluorescently-labeled reversible terminator nucleotides. The process begins with library preparation where DNA is fragmented and adapters are ligated. Fragments are then amplified on a flow cell through bridge amplification to create clusters. During sequencing, fluorescently labeled nucleotides are incorporated one at a time, with imaging after each incorporation to determine the base identity [17]. This approach generates massive quantities of short reads (typically 50-300 bp) with exceptionally high accuracy (exceeding 99.9%) [9]. For 16S rRNA gene sequencing, Illumina typically targets specific hypervariable regions (e.g., V3-V4), which provides cost-effective profiling but limits taxonomic resolution at the species level due to the short read lengths [16] [10].
Pacific Biosciences: Single-Molecule Real-Time Sequencing
PacBio's Single-Molecule Real-Time (SMRT) sequencing operates on fundamentally different principles. DNA polymerase is immobilized at the bottom of nanometer-scale wells called zero-mode waveguides. As the polymerase incorporates fluorescently-labeled nucleotides, the incorporation event is detected in real-time [16]. A key advantage is the Circular Consensus Sequencing (CCS) capability, where the same molecule is sequenced repeatedly by creating circularized templates. This generates HiFi (High Fidelity) reads with accuracy exceeding 99.9% [16] [12]. The technology produces long reads (typically 10-25 kb), making it particularly suitable for full-length 16S rRNA gene sequencing, which enables superior species-level taxonomic resolution in microbiome studies [16] [12].
Oxford Nanopore: Nanopore-Based Electronic Sequencing
ONT technology is characterized by its measurement of electrical current changes as DNA strands pass through protein nanopores. Each nucleotide causes a characteristic disruption in current, allowing for base identification [16] [10]. A significant advantage is the ability to produce ultra-long reads (potentially exceeding 100 kb) and the compact size of some devices (e.g., MinION), which enables field deployment [18] [10]. While historically associated with higher error rates (5-15%), recent improvements in chemistry (R10.4.1 flow cells) and base-calling algorithms have significantly improved accuracy to over 99% [12] [10]. For microbiome applications, ONT enables full-length 16S rRNA gene sequencing, similar to PacBio, facilitating high taxonomic resolution [16].
Table 1: Core Technology Specifications Comparison
| Parameter | Illumina | PacBio | Oxford Nanopore |
|---|---|---|---|
| Sequencing Principle | Sequencing by Synthesis | Single-Molecule Real-Time (SMRT) | Nanopore Electrical Current Detection |
| Typical Read Length | 50-300 bp | 10-25 kb (HiFi reads) | 100 bp - 100+ kb |
| Accuracy | >99.9% | ~Q30 (99.9%) with HiFi | >99% with latest chemistry |
| Primary 16S Approach | Partial gene (V3-V4) | Full-length gene | Full-length gene |
| Run Time | Hours to days | Hours to days | Minutes to days (real-time) |
| Key Advantage | High throughput, low cost per base | Long reads with high accuracy | Ultra-long reads, portability |
Performance Comparison in Microbiome Research
Taxonomic Resolution Across Platforms
Multiple comparative studies have quantitatively assessed the performance of Illumina, PacBio, and ONT for microbiome profiling. A 2025 study comparing these three platforms for rabbit gut microbiota analysis reported significant differences in species-level classification rates. ONT demonstrated the highest resolution, classifying 76% of sequences to the species level, followed by PacBio at 63%, and Illumina at 47% [16]. This advantage stems from the ability of both ONT and PacBio to sequence the full-length 16S rRNA gene (~1,500 bp), which contains more taxonomic information than the short hypervariable regions (e.g., V3-V4, ~450 bp) typically sequenced by Illumina [16] [12].
However, a critical limitation observed across all platforms was that many sequences classified at the species level were labeled as "uncultured_bacterium" [16]. This indicates that despite improved technical resolution, reference database limitations continue to constrain precise species-level characterization of gut microbiota. The same study also noted that while high correlations between relative abundances of major taxa were observed, diversity analyses revealed significant differences in taxonomic compositions across the three platforms [16].
Throughput, Error Profiles, and Technical Considerations
Each platform exhibits distinct error profiles and technical characteristics that impact their application in microbiome studies. Illumina generates the highest number of reads with minimal errors, primarily substitutions [11]. PacBio's HiFi reads achieve high accuracy through multiple passes of the same molecule, with errors occurring randomly without specific context bias [16] [12]. ONT has historically had higher error rates, particularly in homopolymer regions, though recent improvements in chemistry and base-calling have substantially reduced these errors [12] [10].
Throughput varies considerably across platforms. In a direct comparison, after quality filtering, the average number of reads per sample was 30,184 for Illumina, 41,326 for PacBio, and 630,029 for ONT, though read length differed significantly (Illumina: 442±5 bp; PacBio: 1,453±25 bp; ONT: 1,412±69 bp) [16]. This highlights the trade-off between read length and quantity, which must be balanced based on research objectives.
Table 2: Performance Comparison in Microbiome Studies
| Performance Metric | Illumina | PacBio | Oxford Nanopore |
|---|---|---|---|
| Species-Level Resolution | 47% | 63% | 76% |
| Genus-Level Resolution | 80% | 85% | 91% |
| Error Type | Mainly substitutions | Random errors | Historically higher, especially in homopolymers |
| Multikingdom Detection | Limited to bacteria/archaea with 16S | Limited to bacteria/archaea with 16S | Capable of detecting bacteria, archaea, eukaryotes, viruses |
| Required DNA Input | Low | Moderate | Low to moderate |
| Cost Considerations | Low cost per sample | Higher cost per sample | Variable, decreasing rapidly |
Experimental Design and Methodologies
Sample Collection, DNA Extraction, and Quality Control
Robust experimental design begins with proper sample collection and preservation. For gut microbiome studies, fecal samples are typically collected and immediately frozen at -80°C or placed in stabilization solutions like RNAlater [19]. DNA extraction should utilize standardized protocols, such as the International Human Microbiome Standards (IHMS) protocols, to minimize technical variability [19]. The DNeasy PowerSoil kit (QIAGEN) has been successfully used across multiple comparative studies and provides reliable DNA extraction for all three platforms [16].
DNA quality assessment should include quantification using fluorometric methods (e.g., Qubit) and quality verification using spectrophotometric ratios (260/280, 260/230) or fragment analyzers [16] [19]. For PacBio and ONT full-length 16S sequencing, attention to DNA integrity is particularly important due to the longer amplicon requirements.
Library Preparation and Sequencing Protocols
Each platform requires specific library preparation approaches for 16S rRNA gene sequencing:
Illumina Library Preparation:
- Target the V3-V4 hypervariable regions using primers such as 341F (5'-CCTACGGGNGGCWGCAG-3') and 805R (5'-GACTACHVGGGTATCTAATCC-3') [16] [19]
- Amplification using 25-30 PCR cycles
- Multiplexing with dual indices (e.g., Nextera XT Index Kit)
- Sequencing on MiSeq or NextSeq platforms with 2×250 bp or 2×300 bp paired-end reads [16] [10]
PacBio Library Preparation:
- Amplify full-length 16S rRNA gene with primers 27F (5'-AGRGTTYGATYMTGGCTCAG-3') and 1492R (5'-RGYTACCTTGTTACGACTT-3') [16] [12]
- 27-30 PCR cycles with KAPA HiFi Hot Start DNA Polymerase
- Library preparation with SMRTbell Express Template Prep Kit
- Sequencing on Sequel II system with 10-hour movie times [16] [12]
Oxford Nanopore Library Preparation:
- Amplify full-length 16S rRNA gene using 27F and 1492R primers
- 40 PCR cycles with recommended polymerases
- Library preparation using 16S Barcoding Kit (SQK-RAB204 or SQK-16S024)
- Sequencing on MinION device with FLO-MIN106 flow cells [16]
Diagram 1: 16S rRNA Sequencing Workflow Across Platforms. The initial steps are shared, with platform-specific protocols diverging at the PCR amplification stage.
Bioinformatic Processing Pipelines
Bioinformatic processing differs significantly across platforms due to their distinct technical characteristics:
Illumina Data Processing:
- Typically processed using DADA2 for quality filtering, error correction, and Amplicon Sequence Variant (ASV) inference [16] [10]
- Taxonomic classification with SILVA database using Naïve Bayes classifiers [16]
- Analysis in QIIME2 or similar platforms for diversity metrics [11]
PacBio Data Processing:
- Processing through DADA2 for Circular Consensus Sequence (CCS) refinement and ASV generation [16]
- Similar taxonomic classification approach as Illumina but with full-length 16S references [16]
ONT Data Processing:
- Higher error rates may preclude standard DADA2 processing [16]
- Specialized tools like Spaghetti or Emu for ONT-specific error correction and OTU clustering [16] [12]
- EPI2ME Labs 16S Workflow for streamlined analysis [10]
Platform Selection Guide for Gut Microbiome Studies
Application-Based Platform Recommendations
Selecting the optimal platform requires aligning technical capabilities with research objectives:
Choose Illumina when:
- Studying large cohorts where cost-effectiveness is paramount [9]
- Primary research questions focus on genus-level community composition [10]
- Maximum sequencing depth is required for detecting low-abundance taxa [19]
- Established, standardized pipelines are preferred for reproducibility [11]
Choose PacBio when:
- Species-level resolution is critical for the research questions [16] [12]
- High accuracy is required without sacrificing read length [12]
- Studying microbial communities with many closely related species [16]
- Budget allows for higher cost per sample [20]
Choose Oxford Nanopore when:
- Ultra-long reads are needed for strain-level discrimination [18] [10]
- Rapid turnaround time is essential (some applications <24 hours) [17]
- Portability for field-based sequencing is required [18]
- Simultaneous detection of bacteria, fungi, and viruses is desired [9]
Diagram 2: NGS Platform Selection Guide for Gut Microbiome Studies. This decision tree illustrates key considerations when choosing between platforms based on research priorities.
Emerging Trends and Future Directions
The NGS landscape continues to evolve rapidly, with several trends shaping future microbiome research:
Hybrid Sequencing Approaches: Combining Illumina's short-read accuracy with long-read data from PacBio or ONT is emerging as a powerful strategy for comprehensive microbiome characterization [10]. This approach leverages the strengths of each technology while mitigating their respective limitations.
Single-Cell Sequencing: Advanced single-cell sequencing technologies are enabling resolution of microbial communities at the individual cell level, providing insights into microbial heterogeneity and rare populations [21].
Integrated Multi-Omics: Sequencing technologies are increasingly being integrated with other omics approaches (metatranscriptomics, metaproteomics, metabolomics) to obtain functional insights beyond taxonomic composition [9] [18].
AI-Enhanced Bioinformatics: Artificial intelligence and machine learning are being applied to improve base-calling, error correction, and taxonomic classification, potentially mitigating some of the inherent limitations of each platform [21].
Essential Research Reagent Solutions
Table 3: Key Research Reagents and Kits for 16S rRNA Sequencing
| Product Type | Specific Examples | Application | Considerations |
|---|---|---|---|
| DNA Extraction Kits | DNeasy PowerSoil Kit (QIAGEN), Quick-DNA Fecal/Soil Microbe Microprep Kit (Zymo Research) | High-quality DNA extraction from complex samples | Standardized protocols improve reproducibility across labs [16] [12] |
| Illumina Library Prep | 16S Metagenomic Sequencing Library Prep (Illumina), QIAseq 16S/ITS Region Panel (Qiagen) | V3-V4 amplicon library preparation | Primer selection impacts taxonomic resolution; validate for your target community [16] [10] |
| PacBio Library Prep | SMRTbell Express Template Prep Kit 2.0/3.0 (PacBio) | Full-length 16S library preparation | Optimize PCR cycles to minimize chimeras while maintaining yield [16] [12] |
| ONT Library Prep | 16S Barcoding Kit (SQK-RAB204/ SQK-16S024), Native Barcoding Kit 96 (ONT) | Full-length 16S library preparation | Newer kits significantly improve yield and accuracy [16] [12] |
| Quality Control Tools | Fragment Analyzer, Bioanalyzer, Qubit Fluorometer | DNA and library quality assessment | Essential for optimizing input material, especially for full-length protocols [16] [19] |
| Positive Controls | ZymoBIOMICS Microbial Community Standards | Process monitoring and benchmarking | Critical for identifying technical biases and pipeline validation [19] |
The selection of sequencing technology for gut microbiome research involves careful consideration of multiple factors, including required taxonomic resolution, sample throughput, budget constraints, and analytical capabilities. Illumina remains the workhorse for large-scale genus-level profiling studies, while PacBio and Oxford Nanopore offer superior species-level resolution through full-length 16S rRNA gene sequencing. Recent technological advances have substantially improved the accuracy and throughput of all three platforms, making each viable for different research scenarios.
For comprehensive gut microbiome studies aiming to advance therapeutic development, a strategic approach might involve initial large-scale screening with Illumina followed by more targeted deep characterization of select samples using PacBio or ONT. As the technologies continue to evolve and costs decrease, hybrid approaches and integrated multi-omics methodologies will likely become standard practice in advanced gut microbiome research, providing unprecedented insights into the composition and function of microbial communities in health and disease.
In the analysis of high-throughput sequencing data from microbial communities, the method used to group sequences into taxonomic units is a fundamental bioinformatics choice. For decades, the field relied primarily on Operational Taxonomic Units (OTUs), which cluster sequences based on a predefined similarity threshold, typically 97% for bacterial species delineation [22] [23]. This approach served as a crucial tool for reducing the impact of sequencing errors and managing computational complexity [22]. However, recent methodological advances have prompted a shift toward Amplicon Sequence Variants (ASVs), which distinguish biological sequences from sequencing errors to identify exact sequence variants without clustering [23] [24]. This evolution from OTU-based clustering to ASV-based denoising represents a significant paradigm shift in how researchers investigate microbial biodiversity, with profound implications for data resolution, reproducibility, and cross-study comparability [22] [24].
Within the specific context of gut microbiome studies—which aim to characterize microbial communities in health and disease for diagnostic and therapeutic development [25] [9]—the choice between OTUs and ASVs carries particular weight. The decision influences the detection of microbial signatures associated with clinical conditions, the identification of novel taxa, and the overall accuracy of diversity assessments [25] [24]. Furthermore, this choice interacts with other critical methodological factors, including selection of sequencing platforms, reference databases, and analysis pipelines [16] [9]. This technical guide provides an in-depth examination of OTU and ASV methodologies, their computational foundations, their performance characteristics in gut microbiome research, and their integration with modern sequencing technologies.
Core Concepts and Computational Foundations
Operational Taxonomic Units (OTUs): Cluster-Based Approach
OTUs are clusters of sequencing reads grouped based on sequence similarity thresholds. The 97% identity threshold became the conventional cutoff for approximating bacterial species, though 99% is sometimes used for finer resolution [22] [23]. Three primary computational methods generate OTUs:
- De Novo Clustering: Groups sequences without a reference database by performing all-against-all sequence comparisons. This approach is computationally intensive but essential for discovering novel taxa not present in reference databases [23].
- Closed-Reference Clustering: Maps sequences against a reference database, discarding those that don't match. This method offers computational efficiency and easy cross-study comparison but suffers from reference bias and inability to detect novel organisms [23].
- Open-Reference Clustering: Combines both approaches by first clustering against a reference database, then performing de novo clustering on unmatched sequences [23].
The OTU approach inherently reduces the impact of sequencing errors through consensus generation but at the cost of resolution, as it merges biologically real but similar sequences into artificial clusters [23] [24].
Amplicon Sequence Variants (ASVs): Denoising Approach
ASVs represent exact biological sequences distinguished from sequencing errors through a process called "denoising." Unlike OTUs, ASVs aim to resolve single-nucleotide differences without arbitrary clustering thresholds [23] [24]. The DADA2 algorithm exemplifies this approach, using a parametric error model of the sequencing process to infer true biological sequences [22] [24]. The denoising process typically involves:
- Error Model Learning: Construction of a sample-specific error model from the sequencing data quality.
- Dereplication: Consolidation of identical reads.
- Denoising Proper: Separation of true biological sequences from erroneous ones.
- Chimera Removal: Identification and removal of artificial sequences formed from parent sequences.
ASVs provide exact sequence variants that are reproducible across studies, enabling higher resolution analysis and direct sequence comparison without clustering ambiguity [23] [24].
Comparative Workflow Visualization
The fundamental differences in how OTU clustering and ASV denoising process sequence data are visualized in the following workflow diagram:
Performance Comparison in Gut Microbiome Research
Quantitative Metrics and Diversity Assessments
Comparative studies reveal significant differences in how OTU and ASV approaches capture microbial diversity patterns. A 2024 study analyzing bacterial amplicons across 17 adjacent habitats found that OTU clustering at both 97% and 99% identity thresholds led to marked underestimation of ecological indicators for species diversity compared to ASV-based analysis [24]. The study also reported distorted behavior in dominance and evenness indices when using OTU clustering, along with sensitivity in multivariate ordination analyses and tree topology [24].
Table 1: Impact of Clustering Method on Alpha Diversity Metrics
| Diversity Metric | ASV-Based Analysis | OTU Clustering (97%) | OTU Clustering (99%) | Biological Interpretation |
|---|---|---|---|---|
| Richness | Higher observed richness [24] | Lower observed richness [24] | Intermediate observed richness [24] | ASVs capture more unique sequences |
| Evenness | More accurate representation [24] | Distorted patterns [24] | Less distorted than 97% [24] | ASVs better reflect abundance distribution |
| Dominance Indices | Natural distribution [24] | Skewed dominance [24] | Moderately skewed [24] | OTUs artificially inflate dominant taxa |
| Phylogenetic Diversity | Higher resolution [22] [26] | Lower resolution [22] | Intermediate resolution [22] | ASVs preserve single-nucleotide variants |
Research on freshwater invertebrate gut and environmental communities demonstrated that the choice between DADA2 (ASV-based) and Mothur (OTU-based) significantly influenced both alpha and beta diversity measures, particularly affecting presence/absence indices such as richness and unweighted UniFrac [22]. Interestingly, the discrepancy between OTU and ASV-based diversity metrics could be attenuated through rarefaction, though the pipeline effect remained more impactful than either OTU threshold or rarefaction choices [22].
Taxonomic Resolution and Compositional Analysis
The resolution of taxonomic classification represents a critical difference between approaches, with ASVs generally providing superior specificity. A 2025 study comparing 5S-IGS amplicons from beech species found that despite a strong reduction (>80%) of representative sequences, DADA2-ASVs identified all main variant types known for the genus, effectively reflecting expected phylogenetic, taxonomic, and diversity patterns [26]. In contrast, Mothur-generated OTUs produced large proportions of rare variants that complicated phylogenetic inference [26].
Table 2: Taxonomic Resolution and Compositional Analysis
| Analytical Characteristic | ASV-Based Approach | OTU-Based Approach | Implications for Gut Microbiome Studies |
|---|---|---|---|
| Species-Level Resolution | Higher precision [16] [9] | Lower precision [9] | Better detection of disease-associated species |
| Novel Taxon Discovery | Retains unclassified sequences [24] | Dependent on reference database [23] | Identification of previously uncharacterized gut microbes |
| Rare Taxa Detection | Sensitive with proper filtering [23] [24] | Retains rare sequences but with spurious OTUs [24] | Better characterization of low-abundance community members |
| Cross-Study Comparability | High (exact sequences) [23] | Variable (cluster-dependent) [23] | Meta-analyses more reliable with ASVs |
| Reference Database Dependence | Lower for initial calling [24] | Higher for clustering [23] | ASVs more robust for undercharacterized microbiomes |
In clinical gut microbiome studies, where detection of specific bacterial species can inform diagnostics and therapeutics, the enhanced resolution of ASVs offers tangible benefits. For example, studies attempting to identify causative pathogens in culture-negative infections or characterize microbial signatures of inflammatory bowel disease benefit from the precise taxonomic assignment enabled by ASVs [25] [9].
Integration with Sequencing Technologies and Reference Databases
Platform-Specific Considerations
The performance of OTU and ASV methods varies across sequencing platforms, which themselves differ in read length, error profiles, and throughput. A 2025 comparison of Illumina, PacBio, and Oxford Nanopore Technologies (ONT) for rabbit gut microbiota revealed important platform-specific interactions with analysis methods [16]. While ONT and PacBio full-length 16S rRNA sequencing provided better species-level resolution (76% and 63% respectively) compared to Illumina V3-V4 region sequencing (47%), the classification output was frequently labeled as "uncultured_bacterium" across all platforms, highlighting persistent database limitations [16].
For Illumina data, which produces shorter reads but higher throughput, ASV methods like DADA2 have been extensively validated and widely adopted [22] [16]. With third-generation sequencing platforms producing full-length 16S rRNA gene sequences, the resolution advantage of ASVs becomes even more pronounced, enabling more precise taxonomic assignment [16]. However, ONT's higher error rate presents challenges for denoising algorithms, sometimes necessitating OTU-based approaches for this technology [16].
Reference Database Selection and Limitations
Both OTU and ASV methods eventually require taxonomic classification through comparison to reference databases, making database selection a critical consideration. Commonly used databases include:
- SILVA: Comprehensive database of aligned ribosomal RNA sequences [22]
- Greengenes: 16S rRNA gene database with taxonomy definitions [9]
- RDP (Ribosomal Database Project): Curtained database with taxonomic classifications [9]
- RefSeq: Comprehensive genomic database used for shotgun metagenomics [9]
The limitations of these databases significantly impact analysis outcomes. A 2025 study noted that despite improved sequencing technologies, a substantial proportion of species-level classifications received ambiguous labels like "uncultured_bacterium," indicating persistent gaps in reference databases [16]. This limitation is particularly relevant for gut microbiome studies investigating less characterized populations or non-Western cohorts, where novel microbial diversity may be more prevalent [25].
Experimental Protocols and Methodological Implementation
Standardized Protocols for Method Comparison
To ensure robust comparisons between OTU and ASV approaches, researchers should implement standardized experimental protocols. A 2022 benchmarking study on synthetic microbial communities established a rigorous methodology for evaluating sequencing and analysis methods [27]:
Mock Community Construction:
- Create synthetic communities with known composition (64-87 genomic microbial strains)
- Span multiple phylogenetic groups (29 bacterial and archaeal phyla in the cited study)
- Include closely related species to test resolution capability
- Distribute abundances across several orders of magnitude
Sequencing and Analysis:
- Process identical samples through both OTU and ASV pipelines
- Maintain consistent quality filtering steps
- Apply multiple diversity metrics
- Compare observed versus expected composition
This approach using synthetic communities with known ground truth enables objective evaluation of each method's accuracy in taxonomic assignment, abundance estimation, and diversity assessment [27].
Implementation in Gut Microbiome Studies
For researchers designing gut microbiome studies, the following experimental protocol ensures proper implementation of both approaches:
Sample Processing:
- DNA extraction using standardized kits (e.g., DNeasy PowerSoil Pro [22])
- Amplification of target regions (V4 for Illumina, full-length for PacBio/ONT)
- Sequencing on appropriate platform(s)
Parallel Bioinformatics Analysis: Table 3: Implementation Protocols for OTU and ASV Pipelines
| Processing Step | OTU Protocol (Mothur) | ASV Protocol (DADA2) | Quality Control Measures |
|---|---|---|---|
| Quality Filtering | Screen sequences by length and ambiguous bases [22] | Filter and trim based on error rates [22] | FastQC reports, sequence length distribution |
| Error Handling | Chimera removal with VSEARCH [22] | Error model learning [22] | Mock community validation [27] |
| Variant Calling | Cluster at 97% and 99% identity [22] | Denoising to exact sequences [22] | Check chimera rates, track read retention |
| Taxonomic Assignment | Wang classifier with Silva database [22] | Naive Bayes classifier with Silva [16] | Compare against multiple databases |
| Data Output | OTU table with consensus taxonomy [22] | ASV table with exact sequences [22] | Evaluate sparsity, rare variant distribution |
Validation and Quality Assessment:
- Include negative controls to assess contamination
- Use internal standards to quantify accuracy
- Apply multiple rarefaction levels to test robustness
- Compare results with different reference databases
Table 4: Essential Research Resources for OTU and ASV Analysis
| Resource Category | Specific Tools | Application Context | Function and Importance |
|---|---|---|---|
| Bioinformatics Pipelines | DADA2 [22] [24], Mothur [22], QIIME2 [16] | Data processing from raw sequences to taxonomic units | Core analysis tools for implementing OTU/ASV methods |
| Reference Databases | SILVA [22] [16], Greengenes [9], RDP [9] | Taxonomic classification | Essential for assigning identity to sequences/clusters |
| DNA Extraction Kits | DNeasy PowerSoil Pro [22], DNeasy PowerSoil [16] | Sample preparation | Standardized microbial DNA isolation |
| Sequencing Platforms | Illumina MiSeq [22], PacBio Sequel II [27] [16], ONT MinION [16] | Data generation | Platform choice affects resolution and error profiles |
| Mock Communities | ZymoBIOMICS Microbial Community Standard [23], Synthetic communities [27] | Method validation | Ground truth for evaluating performance accuracy |
| Primer Sets | 515F/806R (V4) [22], 27F/1492R (full-length) [16] | Target amplification | Determine genomic region and taxonomic resolution |
The evolution from OTU clustering to ASV denoising represents significant methodological progress in microbiome bioinformatics. ASVs offer higher resolution, better reproducibility, and improved cross-study comparability, making them increasingly the preferred choice for gut microbiome research, particularly when species-level detection or strain-level variation is biologically meaningful [24]. However, OTU approaches retain value in specific contexts, such as when analyzing data from higher-error sequencing platforms or when conducting meta-analyses of legacy datasets [16].
Future directions in the field point toward several developments. First, the integration of full-length 16S rRNA sequencing with ASV methods will likely improve species-level resolution as reference databases expand [16]. Second, hybrid approaches that combine multiple sequencing technologies may offer optimal solutions by leveraging the strengths of different platforms [28]. Finally, as microbiome research increasingly focuses on functional potential rather than mere composition, the integration of amplicon sequencing with shotgun metagenomics and metatranscriptomics will provide more comprehensive biological insights [25] [9].
For researchers designing gut microbiome studies, the current evidence supports adopting ASV-based methods as the primary analytical approach, while maintaining awareness of platform-specific considerations and ongoing database limitations. This strategy will maximize the resolution, accuracy, and reproducibility of findings that may eventually translate into clinical applications [25] [9].
A Practical Workflow: From Sample to Data in Gut Microbiome Studies
Selecting the appropriate sequencing method is a critical first step in designing a gut microbiome study. The choice between 16S rRNA gene sequencing and shotgun metagenomic sequencing shapes every subsequent phase of the project, from sample preparation to bioinformatic analysis. For researchers investigating the gut microbiome's role in colorectal cancer, inflammatory diseases, or drug response, this decision directly impacts the ability to detect relevant microbial signatures [5]. The 16S approach provides a cost-effective method for profiling bacterial and archaeal composition, while shotgun sequencing delivers a comprehensive view of all microbial genomes, enabling species-level identification and functional analysis [1] [29]. This guide provides detailed, step-by-step protocols for both library preparation methods, empowering researchers to make informed decisions aligned with their study objectives and resources.
Key Differences Between 16S and Shotgun Sequencing
The table below summarizes the fundamental distinctions between these two approaches, highlighting their implications for gut microbiome research.
Table 1: Comparison of 16S rRNA Gene Sequencing and Shotgun Metagenomic Sequencing
| Factor | 16S rRNA Sequencing | Shotgun Metagenomic Sequencing |
|---|---|---|
| Cost per Sample | ~$50-$80 [1] [29] | ~$150-$200 (Deep) / ~$120 (Shallow) [1] [29] |
| Target Region | Hypervariable regions of 16S rRNA gene (e.g., V3-V4) [30] [10] | All genomic DNA in a sample [29] |
| Taxonomic Resolution | Genus-level (sometimes species) [1] [29] | Species-level and sometimes strain-level [1] [29] |
| Taxonomic Coverage | Bacteria and Archaea only [1] | All domains of life (Bacteria, Archaea, Viruses, Fungi) [1] |
| Functional Profiling | No (only predicted via tools like PICRUSt) [1] [29] | Yes (direct profiling of microbial genes) [1] [29] |
| Recommended Sample Type | All sample types, especially those with high host DNA [29] | Human microbiome samples (e.g., feces) [29] |
| Minimum DNA Input | As low as 10 copies of the 16S gene [29] | Typically 1 ng [29] |
| Bioinformatics Complexity | Beginner to Intermediate [1] | Intermediate to Advanced [1] |
| Host DNA Interference | Low impact [29] | High impact; may require depletion strategies [29] |
Protocol 1: 16S rRNA Gene Sequencing Library Preparation
This protocol is optimized for preparing 16S sequencing libraries from human stool samples, targeting the V3-V4 hypervariable region, which provides a balance between length and taxonomic information [10] [5].
Principles and Applications
16S rRNA gene sequencing uses polymerase chain reaction (PCR) to amplify specific regions of the bacterial and archaeal 16S rRNA gene. The method leverages the fact that this gene contains both highly conserved regions (for primer binding) and hypervariable regions (for taxonomic discrimination) [10]. This technique is ideal for large-scale cohort studies where the primary goal is to compare bacterial community composition and structure across hundreds of samples at a reasonable cost [5]. For gut microbiome studies, it reliably identifies shifts at the phylum and genus levels associated with conditions like colorectal cancer [5].
Step-by-Step Procedure
- DNA Extraction: Extract genomic DNA from approximately 200 mg of human stool sample using a dedicated kit such as the Dneasy PowerLyzer Powersoil Kit (Qiagen) [5]. Validate DNA concentration and purity using a fluorometer (e.g., Qubit) and spectrophotometer (e.g., Nanodrop).
- First-Stage PCR Amplification:
- Reaction Setup: Prepare PCR reactions using a kit such as the QIAseq 16S/ITS Region Panel (Qiagen). The reaction should include:
- Purified microbial DNA (≤ 20 ng/µl, free of PCR inhibitors) [30]
- 16S V3-V4 targeted primer mix
- PCR master mix
- Cycling Conditions:
- Reaction Setup: Prepare PCR reactions using a kit such as the QIAseq 16S/ITS Region Panel (Qiagen). The reaction should include:
- PCR Clean-up: Perform an enzymatic clean-up step to remove leftover primers and dNTPs. Some optimized kits, like the Quick-16S NGS Library Prep Kit (Zymo Research), incorporate this step to replace lengthy AMPure bead clean-ups, saving time and reducing costs [30].
- Second-Stage PCR (Indexing):
- Perform a second, limited-cycle PCR (typically 8-10 cycles) to attach unique dual index barcodes and full Illumina adapter sequences to the amplicons from each sample using a kit such as the QIAseq 16S/ITS Index Kit [10].
- Library Pooling and Quantification:
- Purify the final indexed libraries using AMPure beads.
- Quantify the library pool using a method such as qPCR. Advanced kits utilize real-time PCR during the amplification stage, which can eliminate the need for additional quantification steps like TapeStation analysis [30].
- Normalize and pool the libraries in equimolar ratios.
- Sequencing: Sequence the pooled library on an Illumina MiSeq or NextSeq system. For the V3-V4 region (~460 bp amplicon), the MiSeq Reagent Kit v3 (600-cycle) is recommended for paired-end 2x300 bp sequencing [30] [10].
Workflow Visualization
The following diagram illustrates the key steps in the 16S rRNA gene sequencing library preparation workflow:
Protocol 2: Shotgun Metagenomic Sequencing Library Preparation
This protocol describes shotgun metagenomic library preparation for gut microbiome samples, which sequences all genomic DNA fragments without targeting a specific gene.
Principles and Applications
Shotgun metagenomic sequencing involves randomly fragmenting all DNA in a sample and sequencing the resulting fragments [1]. This approach provides a unbiased view of the microbial community, allowing for taxonomic profiling at species and potentially strain-level resolution, as well as functional characterization of microbial genes [29] [5]. For gut microbiome studies, this is particularly valuable for investigating functional potential, such as identifying antibiotic resistance genes, metabolic pathways, and virulence factors associated with health and disease [1].
Step-by-Step Procedure
- DNA Extraction: Extract high-quality, high-molecular-weight DNA from stool samples using a kit such as the NucleoSpin Soil Kit (Macherey-Nagel) [5]. Accurate quantification is critical; use a fluorometer (Qubit) to ensure a minimum input of 1 ng, though more is typically recommended [29].
- DNA Fragmentation and Adapter Ligation:
- Fragmentation: Use a library prep kit such as the NEBNext Ultra II FS DNA Library Prep Kit. This step cleaves the genomic DNA into fragments of a desired size distribution (typically 200-500 bp). The "FS" (Fragment, Select) version integrates fragmentation and size selection in a single step [31].
- Adapter Ligation: Ligate unique dual index adapters to the fragmented DNA. These adapters contain the sequences required for binding to the sequencing flow cell and include the sample barcodes for multiplexing [31].
- Library Amplification:
- Perform a limited-cycle PCR (typically 4-12 cycles, depending on input DNA) to amplify the adapter-ligated fragments. This enriches for properly constructed library molecules and adds complete sequencing primer binding sites [31].
- Library Quantification and Quality Control:
- Purify the final library using SPRI beads (e.g., AMPure XP).
- Assess library fragment size distribution using the Agilent 2100 Bioanalyzer with a High Sensitivity DNA Kit [31].
- Quantify the library accurately by qPCR using a kit designed for library quantification.
- Library Pooling and Sequencing:
- Normalize libraries based on qPCR quantification results.
- Pool the normalized libraries in equimolar ratios.
- Sequence on an Illumina NovaSeq or NextSeq system. For metagenomic studies, a sequencing depth of 2 Gb (e.g., paired-end 150 bp, generating ~6.8 million read pairs per sample) is a common target [31].
Workflow Visualization
The following diagram illustrates the key steps in the shotgun metagenomic sequencing library preparation workflow:
The Scientist's Toolkit: Essential Reagents and Equipment
Successful library preparation requires reliable, high-quality reagents and equipment. The following table lists key solutions used in the protocols featured in this guide.
Table 2: Research Reagent Solutions for NGS Library Preparation
| Item | Function | Example Products / Kits |
|---|---|---|
| 16S Library Prep Kit | Provides all reagents for targeted amplification and indexing of the 16S rRNA gene. | Quick-16S NGS Library Prep Kit (Zymo Research) [30], QIAseq 16S/ITS Region Panel (Qiagen) [10] |
| Shotgun Library Prep Kit | Provides reagents for fragmentation, adapter ligation, and amplification of all genomic DNA. | NEBNext Ultra II FS DNA Library Prep Kit (NEB) [31] |
| DNA Extraction Kit (Stool) | Isolates PCR-inhibitor-free microbial DNA from complex gut microbiome samples. | NucleoSpin Soil Kit (Macherey-Nagel) [5], Dneasy PowerLyzer Powersoil Kit (Qiagen) [5] |
| DNA Quantification | Accurately measures DNA concentration, crucial for input normalization in shotgun sequencing. | Qubit dsDNA HS Assay Kit (Thermo Fisher) [31] |
| Library QC Instrument | Analyzes library fragment size distribution to ensure correct profile before sequencing. | Agilent 2100 Bioanalyzer with High Sensitivity DNA Kit [31] |
| Real-time PCR System | Used for quantitative PCR (qPCR) for accurate library quantification and, in some 16S kits, for amplification. | Bio-Rad CFX96, Applied Biosystems 7500 [30] |
The choice between 16S and shotgun sequencing is a fundamental decision that should be driven by the specific research questions and available resources.
Choose 16S rRNA sequencing when the study involves a large number of samples, the budget is limited, and the primary goal is to profile the bacterial and archaeal composition at the genus level. It is also more suitable for samples with high host DNA contamination that is difficult to remove [29] [5]. Its lower cost per sample allows for greater statistical power in large-scale cohort studies of the gut microbiome.
Choose shotgun metagenomic sequencing when the research aims to achieve species- or strain-level resolution, profile non-bacterial members of the community (viruses, fungi), or directly investigate the functional potential of the microbiome through gene content [1] [5]. This method is preferred for in-depth analysis of stool samples where comprehensive genomic information is the priority [29] [5].
A hybrid approach is also emerging, where 16S sequencing is performed on all samples for compositional analysis, supplemented by shotgun sequencing on a representative subset to gain deeper functional insights [1]. As sequencing costs continue to decline and databases improve, shotgun metagenomics is becoming increasingly accessible for gut microbiome research, promising a more complete and functional understanding of this complex microbial ecosystem.
This technical guide provides a detailed comparison of next-generation sequencing (NGS) platforms for gut microbiome studies, focusing on the established short-read Illumina systems (MiSeq and NovaSeq) and the emerging long-read Oxford Nanopore Technologies (ONT) systems (MinION and PromethION). The selection of a sequencing platform significantly influences the depth, resolution, and scope of microbial community analysis, making it a critical decision in research and drug development pipelines.
The global microbiome sequencing market is experiencing rapid growth, projected to reach USD 3.7 billion by 2029, driven by expanding applications in human health, therapeutic development, and personalized medicine [32]. Within this landscape, platform selection balances multiple factors: read length for resolving complex genomic regions, throughput for population-scale studies, accuracy for confident variant calling, and cost-effectiveness for feasible experimental design.
Short-read technologies from Illumina, such as MiSeq and NovaSeq, have been the workhorses of microbiome sequencing due to their high accuracy and maturity of associated bioinformatics tools. They are predominantly used for 16S rRNA gene amplicon sequencing to profile microbial composition and shotgun metagenomics for functional potential analysis. In contrast, long-read technologies from Oxford Nanopore Technologies (ONT), including MinION and PromethION, provide reads spanning thousands to hundreds of thousands of bases, enabling full-length 16S sequencing, improved metagenome-assembled genomes (MAGs), and direct detection of base modifications [33].
This guide details the platform-specific protocols, performance characteristics, and experimental considerations to inform the optimal choice for specific gut microbiome research objectives, whether for exploratory biodiversity studies, translational biomarker discovery, or therapeutic development.
Illumina: MiSeq and NovaSeq
Illumina sequencing-by-synthesis (SBS) technology uses fluorescently-labeled nucleotides to generate high-accuracy short reads. The MiSeq system is a benchtop sequencer ideal for lower-throughput applications, while the NovaSeq series is designed for production-scale sequencing.
Key Technical Specifications:
| Feature | Illumina MiSeq | Illumina NovaSeq |
|---|---|---|
| Max Read Length | 2 x 300 bp (paired-end) [34] | 2 x 250 bp (paired-end) [34] |
| Throughput per Run | 7.5-8.5 Gb; ~50 million reads [34] | 2400-3000 Gb; ~20 billion reads [34] |
| Typical Quality (Q Score) | High majority of bases ≥ Q30 [35] | With XLEAP-SBS, ≥85% of bases at Q40 [36] |
| Key Chemistry | 4-color fluorescent SBS [34] | 2-color fluorescent SBS; XLEAP-SBS chemistry [34] [36] |
| Ideal Microbiome Use Cases | 16S rRNA amplicon (e.g., V3-V4), small-scale shotgun metagenomics | Large-scale 16S studies, deep shotgun metagenomics, population-level studies [34] |
Oxford Nanopore Technologies: MinION and PromethION
ONT sequencing measures changes in electrical current as a DNA or RNA strand passes through a protein nanopore. This allows for real-time sequencing of long fragments. The MinION is a portable, USB-powered device, whereas the PromethION is a high-throughput benchtop system.
Key Technical Specifications:
| Feature | ONT MinION (Mk1C) | ONT PromethION 24/48 |
|---|---|---|
| Read Length | Short to ultra-long (longest >4 Mb) [37] | Short to ultra-long (longest >4 Mb) [37] |
| Throughput per Flow Cell | Varies by library type; up to 10-30 Gb | Up to 290 Gb per flow cell [37] |
| Total Device Output | Up to 290 Gb (single flow cell) | P24: Up to 6.6 Tb; P48: Up to 13.3 Tb [37] |
| Typical Raw Read Accuracy | Improved with new chemistries (e.g., Q20+) [16] | Improved with new chemistries (e.g., Q20+) [16] |
| Key Chemistry | Nanopore-based electronic signal detection | Nanopore-based electronic signal detection |
| Ideal Microbiome Use Cases | Full-length 16S sequencing, ultra-long reads for assembly, field deployment | Large-scale whole-genome sequencing, complex metagenomic assemblies, transcriptomics [38] |
Comparative Performance in Microbiome Studies
Taxonomic Resolution
A critical consideration is the ability of a platform to resolve microbial identity to the species level. Long-read platforms have a demonstrated advantage in this area due to their ability to sequence the entire ~1,500 bp 16S rRNA gene.
Table: Species-Level Classification Performance (Rabbit Gut Microbiota Study) [16]
| Platform | Target Region | Species-Level Classification Rate | Notes |
|---|---|---|---|
| Illumina MiSeq | V3-V4 | 48% | Lower resolution, but high-throughput for community profiling. |
| PacBio HiFi | Full-length 16S | 63% | High-fidelity (HiFi) long reads improve accuracy. |
| ONT MinION | Full-length 16S | 76% | Best resolution, though many species labeled as "uncultured" [16]. |
A study comparing MiSeq and NovaSeq for oral microbiome analysis found that while community diversity metrics were similar, NovaSeq produced significantly more read counts and detected more unique Operational Taxonomic Units (OTUs), highlighting its power for large-scale studies [34].
Throughput and Data Output
Throughput needs dictate platform choice, ranging from targeted, small-scale studies to population-level sequencing.
Table: Throughput and Output Comparison
| Platform | Sample Scale | Key Output Metric | Data Output & Storage Notes |
|---|---|---|---|
| Illumina MiSeq | Small to medium | 71,406 ± 35,105 input reads (oral microbiome study) [34] | Lower data volume, easier storage and analysis on standard servers. |
| Illumina NovaSeq | Very large | 193,081 ± 91,268 input reads (oral microbiome study) [34] | High data volume requires significant computational infrastructure. |
| ONT MinION | Small to medium | 630,029 ± 92,449 reads (rabbit gut study) [16] | Real-time analysis; raw signal data (POD5) is large, but basecalled FASTQ is manageable [39]. |
| ONT PromethION | Large to massive | Up to 100 Gb per flow cell (practical yield) [38] | Very high data volume; integrated 60 TB SSD and high-performance compute help manage data [37]. |
Experimental Protocols
Illumina 16S rRNA Gene Amplicon Sequencing
This is a widely used method for profiling microbial community composition.
Core Workflow Diagram:
Detailed Methodology (as cited in literature):
- DNA Extraction: Total DNA is extracted from samples (e.g., soft feces) using dedicated kits such as the DNeasy PowerSoil kit (QIAGEN) [16].
- PCR Amplification: The target hypervariable region (e.g., V3-V4 of the 16S rRNA gene) is amplified using specific primers (e.g., 341F and 805R) [16]. For the V1-V2 region, primers 27F and 338R have been used [34].
- Library Preparation: Following the Illumina 16S Metagenomic Sequencing Library protocol, amplicons are purified, and dual indices are attached using kits like the Nextera XT Index Kit [16]. The quality and quantity of the final library are assessed using a Fragment Analyzer or Bioanalyzer.
- Sequencing: The pooled and normalized library is loaded onto the Illumina flow cell. The MiSeq Reagent Kit v3 (2x300 cycles) is commonly used for longer amplicons on the MiSeq platform [34]. NovaSeq utilizes 250 x 2 bp chemistry for high-throughput runs [34].
ONT Full-Length 16S rRNA Gene Sequencing
This protocol leverages long reads to sequence the entire 16S rRNA gene, improving taxonomic resolution.
Core Workflow Diagram:
Detailed Methodology (as cited in literature):
- DNA Extraction: High Molecular Weight (HMW) DNA extraction is recommended for optimal performance in long-read sequencing. Protocols often involve a phenol-chloroform cleanup to remove contaminants [38].
- PCR Amplification: The full-length 16S rRNA gene (~1500 bp) is amplified using universal primers 27F and 1492R, which are tailed with ONT-compatible barcode sequences for multiplexing. PCR is typically performed with a high-fidelity polymerase over 27-40 cycles [16].
- Library Preparation: The amplified DNA is purified and quantified. Library construction is performed using ONT kits such as the 16S Barcoding Kit (SQK-RAB204 or SQK-16S024), which involves adapter ligation to the amplicons [16].
- Sequencing: The prepared library is loaded onto a MinION (FLO-MIN106) or PromethION (FLO-PRO002) flow cell. Sequencing occurs in real-time, and basecalling (converting raw electrical signals to nucleotide sequences) can be performed live by the integrated MinKNOW software [16] [37].
The Scientist's Toolkit: Essential Reagents and Materials
Table: Key Research Reagent Solutions for Microbiome Sequencing
| Item | Function | Platform Specificity |
|---|---|---|
| DNeasy PowerSoil Kit | Efficient DNA extraction from complex samples like stool; minimizes inhibitor co-extraction. | Universal (Illumina & ONT) [16] |
| 16S rRNA Gene Primers | Target-specific amplification of bacterial genomic regions for community profiling. | Platform-specific (e.g., V3-V4 for Illumina, full-length 27F/1492R for ONT) [34] [16] |
| Nextera XT Index Kit | Attaches unique dual indices and adapters to amplicons for multiplexing on Illumina sequencers. | Illumina-specific [16] |
| ONT 16S Barcoding Kit | Provides primers and adapters for PCR-based full-length 16S library prep and barcoding. | ONT-specific (MinION/PromethION) [16] |
| SMRTbell Express Prep Kit | Library preparation for generating HiFi long reads on PacBio systems. | PacBio-specific (as a reference) |
| KAPA HiFi HotStart ReadyMix | High-fidelity PCR enzyme for accurate amplification of target regions, critical for both short- and long-read libraries. | Universal (Illumina & ONT) [16] |
| PromethION A-Series Data Acquisition Unit | High-performance compute module with 4x NVIDIA GPUs for real-time basecalling and analysis of nanopore data. | ONT PromethION-specific [39] [37] |
The choice between Illumina (MiSeq/NovaSeq) and ONT (MinION/PromethION) platforms is not a matter of superiority but of strategic alignment with research goals.
- Choose Illumina MiSeq/NovaSeq when: Your priority is high-throughput, cost-effective sequencing for large sample cohorts, and the primary goal is community profiling (alpha/beta diversity) with well-established bioinformatics pipelines. NovaSeq is particularly suited for massive population studies or deep shotgun metagenomics [34] [40].
- Choose ONT MinION/PromethION when: Your research requires long reads to achieve species-level resolution through full-length 16S sequencing, to resolve complex genomic regions, perform high-quality metagenomic assembly, or detect epigenetic modifications in real-time [16] [33]. The PromethION is designed for terabase-scale projects that demand vast amounts of long-read data [37] [38].
For a comprehensive analysis, a hybrid approach using both short- and long-read technologies is increasingly employed to generate complete and accurate metagenome-assembled genomes (MAGs). As technologies evolve, accuracy and throughput for both platforms continue to improve, solidifying NGS as an indispensable tool for unraveling the complexities of the gut microbiome in health and disease.
Within the scope of identifying the optimal NGS platform for gut microbiome studies, the selection of a bioinformatics pipeline is a critical determinant of data quality, reproducibility, and biological insight. This technical guide provides a comprehensive evaluation of three distinct frameworks: the highly versatile QIIME 2 platform, the robust and portable nf-core/ampliseq workflow, and the real-time, integrated EPI2ME ecosystem. While EPI2ME offers unparalleled simplicity for Oxford Nanopore Technologies (ONT) users, QIIME 2 and nf-core/ampliseq represent community-driven, open-source standards for comprehensive amplicon analysis. The nf-core/ampliseq pipeline, which leverages QIIME 2 and DADA2 among other tools, exemplifies a modern approach that balances analytical depth with stringent reproducibility, making it a compelling candidate for large-scale, high-fidelity gut microbiome research [41] [42] [43].
Amplicon sequencing of the 16S rRNA gene is a cornerstone of gut microbiome research, enabling profiling of microbial communities. The analytical pipelines for processing this data vary significantly in their architecture, accessibility, and computational requirements.
QIIME 2 (Quantitative Insights Into Microbial Ecology 2) is a powerful, modular platform that serves as a comprehensive toolkit for microbiome analysis [42] [44]. It is not a single linear pipeline but an integrated environment that allows researchers to construct custom workflows from a wide array of plugins. This flexibility makes it suitable for method development and complex, non-standard analyses.
nf-core/ampliseq is a community-curated, end-to-end workflow built within the Nextflow framework. It provides a standardized and opinionated pathway for amplicon data, from raw sequences to final results, ensuring reproducibility and ease of use [41] [43]. It encapsulates best-practice tools, including QIIME 2 and DADA2, within a portable containerized environment, effectively bundling the power of QIIME 2 into a single-command workflow.
EPI2ME is a cloud-based platform designed primarily for real-time analysis of data generated by Oxford Nanopore Technologies sequencers. It features user-friendly, predefined workflows that require minimal bioinformatics expertise, lowering the barrier to entry for microbial community analysis [44].
Table 1: Core Features and Specifications of the Analysis Pipelines
| Feature | QIIME 2 | nf-core/ampliseq | EPI2ME |
|---|---|---|---|
| Primary Analysis Type | Modular toolkit for custom workflows | Comprehensive, end-to-end workflow | Integrated, real-time workflow |
| Architecture | Standalone platform (Python) | Nextflow workflow (DSL2) | Cloud-based platform |
| Key Embodied Tools | DADA2, DEBLUR, VSEARCH | DADA2, QIIME 2, Cutadapt, MultiQC | ONT-specific basecallers, classifiers |
| Reproducibility | Through QIIME 2 artifacts and conda | High (containerized, versioned) | Managed by the platform |
| Ideal Use Case | Method development, custom analyses | Standardized, reproducible production runs | Rapid, real-time ONT analysis |
Technical Deep Dive: The nf-core/ampliseq Workflow
The nf-core/ampliseq pipeline embodies a complete, validated workflow for amplicon sequencing analysis. Its design is centered on robust community standards and comprehensive reporting, making it highly suitable for rigorous gut microbiome studies.
Workflow Architecture and Process
The pipeline is structured in a sequential, modular fashion, with each process containerized for consistency. The following diagram illustrates the major stages of analysis.
Key Experimental Protocols and Parameters
Implementing nf-core/ampliseq effectively requires careful consideration of several protocol steps and parameters, which are crucial for data quality, especially in gut microbiome studies.
Input Specification and Primer Trimming: The pipeline accepts input via a samplesheet, a folder of FASTQ files, or a pre-computed ASV fasta file [45] [46]. The critical first step is the removal of PCR primer sequences using Cutadapt. Providing the correct forward (
--FW_primer) and reverse (--RV_primer) sequences is essential, as incomplete trimming can lead to artifactual sequences and spurious ASVs [42] [45]. The default error rate for matching is 0.1 (--cutadapt_e)Read Truncation and Denoising: A pivotal step for data quality is read truncation, which is performed by DADA2 to ensure uniform read length for its error model. Users can visually inspect quality plots generated by the
--untilQ2importparameter to manually set forward (--trunclenf) and reverse (--trunclenr) truncation lengths [47]. Alternatively, the pipeline can automatically determine cutoffs based on a user-defined mean quality threshold (--trunc_qmin, default=25) and a minimum fraction of reads to retain (--trunc_rmin, default=0.75) [46]. DADA2 then performs sample inference (denoising), which can be run per sample independently, pseudo-pooled, or fully pooled, with independent being the default for balancing accuracy and computational load [46].Taxonomic Classification and Filtering: By default, ASVs are classified against the SILVA database using DADA2's
assignTaxonomymethod with a minimum bootstrap confidence of 50 (--dada_min_boot) [46] [48]. The pipeline supports a wide array of other databases (e.g., GTDB, PR2, UNITE) and classifiers (e.g., SINTAX, Kraken2) [45]. Following classification, ASVs classified as common contaminants or off-target amplifications (e.g.,mitochondria, chloroplast) are filtered out by default, a step critical for focusing on genuine gut bacteria [42] [46].
The Scientist's Toolkit: Essential Research Reagents and Materials
Successful execution of a gut microbiome study using these pipelines relies on a foundation of key reagents, reference databases, and analytical tools.
Table 2: Key Research Reagent Solutions for Gut Microbiome Amplicon Sequencing
| Item | Function / Description | Example / Specification |
|---|---|---|
| 16S rRNA Gene Primers | Amplification of target hypervariable regions from microbial genomic DNA. | 515F/806R for V4 region; compatibility with --FW_primer/--RV_primer is critical [45]. |
| Reference Taxonomy Database | Provides a curated set of reference sequences for taxonomic classification of ASVs. | SILVA, GTDB, Greengenes2; selected via parameters like --dada_ref_taxonomy [45] [48]. |
| Metadata File | Provides structured contextual data about samples for statistical and visual analysis. | Must follow QIIME 2 specifications; essential for downstream analyses like Adonis or ANCOM [45] [46]. |
| Naive Bayes Classifier | A trained machine learning model (QIIME 2 artifact) for taxonomic assignment. | Can be pre-trained and supplied via --classifier; must match the primer set used [47]. |
| DADA2 Error Model | A run-specific model that learns and corrects for sequencing errors. | Computed internally; reason for processing per sequencing run (--multiple_sequencing_runs) [42]. |
Advanced Applications and Validation
For complex gut microbiome investigations, advanced methodological approaches are often necessary to enhance resolution and robustness.
Multi-Amplicon and Multi-Region Analysis
Sequencing multiple variable regions of the 16S rRNA gene can provide a more comprehensive view of microbial diversity than a single region alone. A recent 2025 study validated an open-source QIIME2 and R pipeline for this purpose, demonstrating that multi-region profiles were nearly identical to proprietary software outputs and offered higher sequencing depth and improved taxonomic resolution [44]. The nf-core/ampliseq pipeline supports this advanced approach via the Sidle (SMURF) implementation within QIIME2, which scaffolds multiple sequenced regions against a reference (e.g., SILVA) to create a unified abundance and taxonomy profile [45]. This is particularly useful for integrating data from different primer sets in a large-scale gut microbiome study.
The following diagram visualizes this multi-region data integration process.
Downstream Statistical and Differential Analysis
The final stages of the nf-core/ampliseq pipeline generate biologically actionable insights through extensive statistical and visual outputs. Key functionalities include [42]:
- Diversity Analysis: Calculation of alpha diversity indices (e.g., Shannon, Faith PD) and beta diversity distances (e.g., Bray-Curtis, UniFrac), accompanied by PCoA plots for visualization.
- Differential Abundance Testing: Identification of taxa that are statistically different between sample groups (e.g., healthy vs. disease cohort) using methods like ANCOM and ANCOM-BC [42] [46].
- Data Export: Generation of R objects (
Phyloseq,TreeSummarizedExperiment) for advanced custom analysis in R, and export of relative abundance tables at all taxonomic levels for further investigation [48].
In the context of identifying the best NGS platform for gut microbiome research, the choice of analysis pipeline is inextricably linked to the sequencing technology and the research goals. For large-scale, reproducible studies utilizing Illumina sequencing, nf-core/ampliseq presents a superior solution by combining the analytical depth of QIIME 2 with robust, containerized workflow management. Its continuous updates, extensive documentation, and support for advanced methods like multi-region analysis make it a future-proof choice. For real-time, long-read applications with ONT, EPI2ME offers a streamlined alternative. Ultimately, the validation of nf-core/ampliseq against mock communities and clinical samples, as evidenced in recent literature, provides the confidence required for high-stakes gut microbiome research where accuracy and reproducibility are paramount [41] [44].
Leveraging Cloud-Based Platforms like HiOmics for Scalable Analysis
Next-generation sequencing (NGS) has revolutionized gut microbiome research, enabling unprecedented exploration of microbial communities' role in human health and disease. However, the vast data volumes generated by metagenomic, metatranscriptomic, and other multi-omic approaches present significant computational challenges [2]. Traditional computing infrastructure often proves inadequate for processing terabytes of sequencing data, creating bottlenecks that delay scientific insights. Cloud-based platforms like HiOmics address these limitations by providing scalable, reproducible bioinformatic environments specifically designed for large-scale omics analysis [49]. For researchers determining the optimal NGS approach for gut microbiome studies, understanding how these cloud platforms can streamline analysis while maintaining reproducibility is crucial for advancing both basic science and therapeutic development.
The complexity of gut microbiome research extends beyond data volume to methodological diversity. Studies employ various NGS platforms including Illumina MiSeq, Ion Torrent PGM, and previously Roche 454 GS FLX+, each with distinct performance characteristics affecting read length, quality scores, and error profiles [50]. Furthermore, researchers must choose between 16S rRNA amplicon sequencing for cost-effective taxonomic profiling and shotgun metagenomics for comprehensive functional insights [9]. These technical decisions significantly impact downstream results, emphasizing the need for standardized analytical frameworks that can accommodate diverse data types while ensuring computational reproducibility—a core capability of specialized cloud platforms like HiOmics [49].
HiOmics: Architecture and Core Capabilities
HiOmics represents a specialized cloud-based platform architected specifically for large-scale omics data analysis. Its technical foundation integrates several advanced computational technologies to address the unique challenges of microbiome bioinformatics. The platform employs Docker container technology to encapsulate analytical tools, ensuring consistent software environments and reproducible results across different computing infrastructures [49]. This containerized approach eliminates versioning conflicts and environment-specific errors that frequently compromise analytical reproducibility in bioinformatics workflows.
For workflow management, HiOmics utilizes the Workflow Description Language (WDL) and Cromwell engine, providing a standardized framework for defining and executing complex multi-step analytical pipelines [49]. This combination enables precise specification of computational procedures, facilitating both portability across different computing environments and transparent examination of intricate data processing steps. The platform's user interface, built with the Element Plus framework, provides researchers with an intuitive graphical environment for configuring analyses and visualizing results without requiring advanced computational expertise [49].
A particularly innovative component of the HiOmics platform is DataCheck, a tool developed using Golang that performs automated validation and conversion of data formats [49]. This utility addresses a common bottleneck in microbiome bioinformatics—data incompatibility—by ensuring input files meet specification requirements before analysis initiation. To manage massive datasets efficiently, HiOmics leverages object storage technology from public cloud providers, offering virtually unlimited capacity while maintaining cost-effectiveness through pay-as-you-go models. The platform further utilizes batch computing capabilities to process numerous samples simultaneously, automatically scaling resources based on workload demands while maintaining resource independence between users to ensure data security and analytical isolation [49].
Figure 1: HiOmics Cloud Architecture. The platform integrates multiple specialized technologies for end-to-end microbiome data analysis.
Comparative Analysis of NGS Platforms for Gut Microbiome Studies
Selecting the appropriate NGS platform is fundamental to gut microbiome study design, as each technology presents distinct trade-offs in read length, throughput, error profiles, and cost-effectiveness. Understanding these characteristics enables researchers to match platform capabilities with specific research objectives, whether focusing on taxonomic profiling, functional potential, or active microbial transcription.
Table 1: Performance Comparison of Major NGS Platforms for Microbiome Analysis
| Platform | Read Length | Throughput | Error Profile | Key Advantages | Key Limitations | Best Applications |
|---|---|---|---|---|---|---|
| Illumina MiSeq | Up to 2×300 bp | 13.5 Gb (PE300) | Substitution errors | Fastest run time, highest throughput [50] | Relatively shorter reads [50] | 16S rRNA (V3-V4), shallow shotgun metagenomics |
| Ion Torrent PGM | 200-400 bp | 2 Gb | Stable quality scores, homopolymer errors [50] | Lower homopolymer error rate than 454 [50] | Lower throughput, shorter reads [50] | Targeted resistance gene profiling, bacterial composition |
| Roche 454 GS FLX+ | 600-700 bp | 0.7 Gb | Homopolymer errors (>6 bp) [50] | Longest reads among platforms [50] | High cost, low throughput, discontinued [50] | Full-length 16S rRNA (historical study comparison) |
| PacBio Sequel IIe | 10-20 kb | 10-20 Gb | Random errors (<1%) | Exceptionally long reads, minimal bias | Higher cost per sample, complex data analysis | Full-length 16S rRNA, metagenome-assembled genomes |
| Oxford Nanopore | 10 kb - 2 Mb | 10-50 Gb | Random errors (5-15%) | Real-time sequencing, longest reads | Higher raw error rate requires correction | Strain-level resolution, mobile genetic elements |
Technical performance varies significantly across platforms. Illumina MiSeq generates the largest number of reads after quality filtering but experiences quality score declines starting at bases 90-99, while Ion Torrent PGM maintains stable quality scores throughout runs [50]. Roche 454 GS FLX+ produces the longest reads but struggles with poly-bases exceeding 6 base pairs [50]. These technical differences directly impact microbial community assessments, with average relative abundance of specific taxa varying depending on sequencing platform, library preparation method, and bioinformatics analysis [50].
Despite these technical variations, comparative studies demonstrate that major platforms can yield consistent biological conclusions. Research comparing Illumina MiSeq, Ion Torrent PGM, and Roche 454 GS FLX+ found that all three platforms successfully discriminated samples by treatment group, leading to similar biological interpretations despite differences in diversity measures and abundance estimates [50]. This consistency underscores that platform selection should align with specific research questions, weighing factors such as required taxonomic resolution, functional profiling needs, and budget constraints.
Methodological Standards for Reproducible Microbiome Analysis
DNA Extraction and Library Preparation
Methodological consistency beginning with DNA extraction is crucial for reproducible microbiome analysis. Comprehensive evaluations identify the Zymo Research Quick-DNA HMW MagBead Kit as particularly effective for high-quality microbial diversity analysis, providing consistent yields with minimal variation between replicates [51]. The Macherey-Nagel and Invitrogen kits also produce suitable DNA quality and quantity for most sequencing applications, though with higher variance in concentration metrics [51]. Importantly, the DNA extraction method significantly impacts microbial community representation, with protocols excluding bead-beating potentially underrepresenting Gram-positive bacteria with rigid cell wall structures [51].
For library preparation, the Illumina DNA Prep method demonstrates superior performance for whole-genome shotgun sequencing, while amplicon sequencing requires careful selection of target regions based on research objectives [51]. The V3-V4 hypervariable regions of the 16S rRNA gene represent the most commonly targeted regions for partial-length metabarcoding, though different primer pairs can introduce variability in taxonomic classification [19]. Full-length 16S rRNA sequencing using PacBio or Oxford Nanopore platforms provides enhanced taxonomic resolution, potentially discriminating closely related species more effectively than partial-length approaches [19].
Table 2: DNA Extraction Kit Performance Comparison
| Extraction Kit | Hands-on Time | DNA Yield | Quality/Fragment Length | Host DNA Ratio | Reproducibility | Best Applications |
|---|---|---|---|---|---|---|
| Zymo Research Quick-DNA HMW MagBead | Extensive | High (despite half sample volume) | High-quality, long fragments [51] | Low host DNA ratio [51] | Highest consistency, minimal variation [51] | Long-read sequencing, projects requiring high molecular weight DNA |
| Macherey-Nagel (MN) | Moderate | Highest yield | Suitable for LRS [51] | Low host DNA ratio [51] | Reliable quality across replicates [51] | High-throughput studies maximizing yield |
| Invitrogen (I) | Moderate | Moderate yield | Suitable for LRS [51] | Low host DNA ratio [51] | Highest variance among replicates [51] | Standard metabarcoding with quality control |
| Qiagen (Q) | Moderate | Lowest yield | Most degraded DNA [51] | Significantly higher host DNA [51] | Below-average consistency [51] | Limited to specific applications with protocol optimization |
Bioinformatics Pipelines and Computational Considerations
Bioinformatic processing introduces substantial variability in microbiome analysis outcomes. Multicenter comparisons reveal that different computational pipelines significantly impact taxonomic profiles, with half of genera identified by one laboratory's pipeline being unique to that approach [19]. This variability stems from multiple factors including quality filtering parameters, chimera detection methods, clustering algorithms (OTUs vs. ASVs), and reference database selection [50] [9].
Reproducibility improves dramatically when raw sequences are processed using standardized bioinformatic workflows [19]. For cloud-based implementation, platforms like HiOmics address this challenge through containerized analytical components that ensure consistent software versions and parameters [49]. Specific tools demonstrating robust performance include minitax for uniform analysis across sequencing platforms, sourmash for excellent accuracy and precision with both short- and long-read data, and Kraken2 for taxonomic classification of whole-genome shotgun reads [51].
For advanced multi-omic integration, the MintTea framework employs sparse generalized canonical correlation analysis (sGCCA) to identify disease-associated multi-omic modules comprising coordinated features from different molecular layers [52]. This approach captures cross-omic dependencies more effectively than single-omic analyses, generating systems-level hypotheses about microbiome-disease interactions. Such computationally intensive methodologies particularly benefit from cloud implementation, as they require substantial processing resources and flexible scaling during iterative analytical procedures.
Figure 2: Bioinformatic Workflow for Microbiome Data. Standardized processing is essential for reproducible results across studies.
Experimental Protocol: A Complete Cloud-Based Microbiome Analysis
Sample Collection, DNA Extraction, and Quality Control
Implement a standardized sample collection protocol using the IHMS SOP 05_V2, preserving samples in RNAlater Stabilization Solution at room temperature with processing within 24 hours of collection [19]. For DNA extraction, employ the Zymo Research Quick-DNA HMW MagBead Kit according to manufacturer specifications, using approximately 200 mg of intestinal content homogenized with glass beads in a TissueLyser for 5 minutes at 30 Hz in 1-minute intervals between bead beating and ice incubation cycles [50] [51]. Include the ZymoBIOMICS Microbial Community DNA Standard as an internal positive control to monitor technical variability throughout the analytical process [19].
Assess DNA quality and quantity using multiple methods: fluorometric quantification (Qubit dsDNA HS kit), spectral ratios (NanoDrop 260/280 and 260/230), and DNA size profiling (Fragment Analyzer with Genomic DNA 50 kb kit) [19]. High-molecular-weight DNA (>20 kbp) is essential for long-read sequencing, while standard fragment lengths suffice for Illumina short-read platforms. Ensure DNA extracts meet the following quality thresholds: concentration ≥5 ng/μL, 260/280 ratio between 1.8-2.0, 260/230 ratio ≥2.0, and fragment size distribution appropriate for the selected sequencing platform.
Library Preparation and Sequencing Platform Selection
For comprehensive microbial community characterization, employ shotgun metagenomic sequencing using the Illumina DNA Prep library construction method with 1 μg of high-molecular-weight DNA [51]. Fragment DNA to approximately 150 bp using covariant ultrasonication, then proceed with library construction according to manufacturer specifications. If targeting specific phylogenetic markers, select full-length 16S rRNA gene amplification using the LUMI-Seq methodology with unique molecular barcodes to enable sequencing of the V1-V9 regions on Illumina short-read platforms [19].
Base sequencing platform selection on research objectives: Illumina MiSeq for high-throughput community profiling, PacBio Sequel IIe for full-length 16S rRNA sequencing and metagenome-assembled genomes, or Oxford Nanopore for real-time analysis and maximal read length [50] [19]. Generate a minimum of 20 million high-quality reads per sample for shotgun metagenomics or 40,000 reads per sample for amplicon sequencing to ensure adequate coverage of microbial diversity [19].
Cloud-Based Data Analysis via HiOmics
Upload raw sequencing data to the HiOmics platform, initiating the automated DataCheck process to validate file formats and integrity [49]. Select appropriate analytical workflows based on experimental design: 16S rRNA amplicon processing, shotgun metagenomic assembly, or multi-omic integration. For taxonomic profiling from shotgun data, implement the minitax tool with standard parameters: minimap2 alignment with 95% identity threshold followed by taxonomic assignment based on mapping qualities and CIGAR strings [51].
For multi-omic data integration, apply the MintTea framework using sparse generalized canonical correlation analysis (sGCCA) to identify disease-associated modules comprising features from multiple omic layers [52]. Configure analysis with repeated sampling (90% of samples) and consensus threshold (80% co-occurrence) to ensure robust module identification. Execute workflows through the Cromwell engine, which automatically scales cloud resources based on computational demands while maintaining reproducible environments through Docker containers [49].
Essential Research Reagent Solutions
Table 3: Essential Research Reagents and Materials for Microbiome Studies
| Category | Specific Product/Kit | Application | Key Features |
|---|---|---|---|
| DNA Extraction | Zymo Research Quick-DNA HMW MagBead Kit | High-quality DNA extraction for long-read sequencing | Bead-beating for Gram-positive bacteria, high molecular weight DNA [51] |
| DNA Extraction | QIAsymphony DSP Virus/Pathom Kit (IHMS protocol) | Standardized DNA extraction for human microbiome studies | Follows IHMS SOP 06_V2 for cross-study comparability [19] |
| Library Preparation | Illumina DNA Prep | Shotgun metagenomic library construction | Optimized for complex microbial communities [51] |
| Library Preparation | LUMI-Seq Methodology | Full-length 16S rRNA sequencing on short-read platforms | Incorporates UMIs for amplicon sequencing [19] |
| Quality Control | ZymoBIOMICS Microbial Community DNA Standard | Process control for technical variability | Contains 8 bacteria, 1 yeast, 1 protist with varying GC content [19] |
| Quality Control | Qubit dsDNA HS Kit | Fluorometric DNA quantification | Accurate concentration measurement for library preparation [19] |
| Sequencing | Illumina MiSeq Reagent Kit v3 | 16S rRNA amplicon and metagenomic sequencing | 2×300 bp for V3-V4 region, 2×150 bp for shotgun [50] |
| Bioinformatics | HiOmics Platform | Cloud-based analysis workflow management | 300+ plugins, Docker containers, WDL/Cromwell engine [49] |
Cloud-based platforms like HiOmics represent a paradigm shift in microbiome bioinformatics, addressing critical challenges in scalability, reproducibility, and analytical standardization. By containerizing analytical components within scalable cloud infrastructure, these platforms make sophisticated multi-omic analyses accessible to researchers without advanced computational expertise while ensuring methodological consistency across studies. As microbiome research increasingly focuses on translational applications and therapeutic development, the robust computational frameworks provided by specialized cloud platforms will be essential for generating clinically actionable insights from complex microbial community data.
The integration of established best practices—from DNA extraction through bioinformatic processing—within scalable cloud environments enables researchers to focus on biological interpretation rather than computational technicalities. This maturation of microbiome bioinformatics infrastructure, particularly when combined with careful NGS platform selection aligned to specific research questions, accelerates our understanding of host-microbiome interactions in health and disease. Future developments will likely enhance cross-omic integration capabilities and incorporate artificial intelligence approaches, further advancing the field toward personalized microbiome-based interventions.
Optimizing Your NGS Results: Tackling Bias, Error, and Data Quality
Characterizing the complex ecosystem of the gut microbiome is fundamental to understanding its role in human health and disease. Next-generation sequencing (NGS) technologies have revolutionized this field, with Illumina and Oxford Nanopore Technologies (ONT) emerging as two dominant platforms. However, each technology presents a distinct profile of advantages and technical challenges. Illumina is renowned for its high base-calling accuracy (exceeding 99.9%), making it a benchmark for reliable microbial community profiling [53]. Conversely, ONT generates long reads (several kilobases), enabling the sequencing of full-length genes and improving resolution for distinguishing closely related bacterial species, but it has historically been associated with higher error rates (5–15%) [10] [54]. This technical guide provides an in-depth analysis of these platform-specific errors and offers detailed, actionable protocols for mitigating them, framed within the context of selecting the optimal NGS platform for gut microbiome studies.
Technical Comparison of Sequencing Platforms
The core trade-off between Illumina and ONT stems from their fundamental sequencing chemistries. Understanding the source and nature of their respective errors is the first step toward effective mitigation.
Illumina: The Gold Standard in Accuracy with Limitations
- Technology Principle: Illumina utilizes sequencing-by-synthesis with reversible dye-terminators. This process generates massive volumes of short, paired-end reads (typically 75–300 bp) [53].
- Error Profile: Its primary strength is an exceptionally low error rate (<0.1%), which is largely stochastic and random in nature [10] [53]. This makes it exceptionally reliable for detecting single-nucleotide variations and quantifying microbial abundance with high confidence.
- Key Limitations for Microbiome Studies: The short read length is a significant constraint. It typically allows for sequencing of only one or two hypervariable regions of the 16S rRNA gene (e.g., V3-V4), which limits taxonomic classification to the genus level and struggles to resolve closely related species [10] [16]. This can obscure important functional differences within a genus.
Oxford Nanopore: Long-Read Resolution with an Error Hurdle
- Technology Principle: ONT measures changes in electrical current as a DNA strand passes through a protein nanopore. This allows for the generation of long reads that can span the entire ~1,500 bp 16S rRNA gene or be used for shotgun metagenomics [10].
- Error Profile: The main challenge is a higher raw error rate, recently reported in the range of 5–15% [10] [54]. These errors are not random; they are systematic biases, particularly prevalent in homopolymer regions (stretches of consecutive identical bases) where current signal interpretation is challenging [55]. Common errors include insertions and deletions (INDELS) [55].
- Key Advantages for Microbiome Studies: The ability to sequence the full-length 16S rRNA gene provides superior species-level and sometimes strain-level resolution [10] [28]. ONT also offers real-time sequencing capabilities and platform portability, which can be crucial for rapid, on-site analyses [53].
Table 1: Core Technical Specifications and Performance Metrics of Illumina and ONT Platforms in Microbiome Studies.
| Feature | Illumina (e.g., NextSeq) | Oxford Nanopore (e.g., MinION) |
|---|---|---|
| Read Length | Short reads (~300 bp) [10] | Long reads (full-length 16S; several kb) [10] |
| Raw Accuracy | >99.9% [53] | Recent chemistries: >99% [12] [55] |
| Primary Error Type | Stochastic substitution errors | Systematic INDELS, homopolymer bias [55] |
| 16S rRNA Target | Hypervariable regions (e.g., V3-V4) [10] | Full-length gene (V1-V9) [10] [16] |
| Species-Level Resolution | Limited (~48% classified) [16] | High (~76% classified) [16] |
| Typical Microbiome Application | High-throughput microbial surveys; genus-level profiling [10] | Species-level identification; real-time, portable sequencing [10] |
Experimental Protocols for Error Mitigation
Robust experimental design and wet-lab protocols are critical for minimizing errors before sequencing begins. The following methodologies are tailored to each platform's specific biases.
Wet-Lab Protocol 1: Optimized 16S rRNA Amplification and Library Preparation
This protocol is designed for a comparative gut microbiome study, generating compatible libraries for both Illumina and ONT from the same DNA extracts.
A. Sample Collection and DNA Extraction
- Sample: Collect fecal samples and immediately freeze at -80°C. Use biological replicates (recommended: n=3 per condition) to ensure robust statistical power [12].
- DNA Extraction: Employ a standardized kit method, such as the DNeasy PowerSoil kit (QIAGEN) or Quick-DNA Fecal/Soil Microbe Microprep kit (Zymo Research), to ensure high molecular weight DNA and consistent lysis across all samples [16] [12]. Quantify DNA using a fluorometer (e.g., Qubit).
B. PCR Amplification and Library Prep
- For Illumina:
- Target Region: Amplify the V3-V4 hypervariable region using primers (e.g., 341F/805R) [10] [16].
- Protocol: Use a high-fidelity polymerase and follow a validated protocol (e.g., Illumina's 16S Metagenomic Sequencing Library Prep). Keep PCR cycles low (e.g., 20-25) to reduce chimera formation [10].
- Library Construction: Attach dual indices and adapters using a kit such as the Nextera XT Index Kit, followed by library pooling [16].
- For ONT:
- Target Region: Amplify the full-length 16S rRNA gene using universal primers (e.g., 27F/1492R) [16] [12].
- Protocol: Use a robust polymerase (e.g., KAPA HiFi) and a higher cycle number (e.g., 35-40) to ensure sufficient yield for native library prep [16].
- Library Construction: Prepare the library using the ONT 16S Barcoding Kit (e.g., SQK-16S114). This involves barcoding PCR products, pooling equimolarly, and loading onto a flow cell (preferably the R10.4.1 for improved accuracy) [10] [56].
Wet-Lab Protocol 2: Hybrid Metagenomic Sequencing for High-Accuracy Genome Assembly
For studies requiring complete and accurate microbial genomes (e.g., for discovering novel biosynthetic gene clusters or tracking antibiotic resistance genes), a hybrid approach is optimal.
A. DNA Requirements
- High Molecular Weight (HMW) DNA: Critical for long-read sequencing. Verify DNA integrity using pulse-field gel electrophoresis or a Fragment Analyzer. HMW DNA is less crucial for short-read-only protocols [28].
B. Sequencing Strategy
- ONT Long-Read Sequencing: Sequence the HMW DNA on a GridION or PromethION platform using the latest ligation kit (e.g., SQK-LSK114) and an R10.4.1 flow cell. Aim for a coverage of >50x for the metagenome [56].
- Illumina Short-Read Sequencing: From the same HMW DNA stock, prepare a standard short-insert library and sequence on an Illumina platform (e.g., NextSeq) to achieve >100x coverage.
C. Hybrid Assembly
- The high-accuracy Illumina short reads are used to polish and correct the systematic errors in the ONT long reads. This can be performed using assemblers like Unicycler, which is specifically designed for hybrid assembly, resulting in complete, high-quality metagenome-assembled genomes (MAGs) [56].
Bioinformatic Correction and Analysis Workflows
Post-sequencing, specialized bioinformatic pipelines are required to further correct errors and extract biological insights.
Bioinformatic Protocol 1: Standardized 16S rRNA Data Processing
A. Illumina Data Processing
- Pipeline: Use the nf-core/ampliseq workflow (version 2.11.0 or higher) for a standardized, reproducible analysis [10].
- Key Steps:
- Quality Control: Assess read quality with FastQC and MultiQC.
- Primer Trimming: Use Cutadapt to remove primer sequences.
- Infer ASVs: Apply DADA2 for error correction, read merging, and chimera removal to generate high-resolution Amplicon Sequence Variants (ASVs) [10] [16].
- Taxonomy Assignment: Classify ASVs against the SILVA 138.1 database using a Naïve Bayes classifier [10].
B. ONT Data Processing
- Basecalling and Demultiplexing: Use the Dorado basecaller with the High Accuracy (HAC) model or Guppy for superior basecalling [10] [56].
- Quality Filtering: Remove reads shorter than 1,000 bp and with a quality value below Q10 using NanoFilt [56].
- Denoising and Taxonomy: Due to the higher error rate, DADA2 is less effective. Instead, use tools like Emu or the EPI2ME Labs 16S Workflow, which are specifically designed for the error profile of Nanopore 16S data and employ abundance-based modeling to correct errors and assign taxonomy [12] [28].
Bioinformatic Protocol 2: Hybrid Metagenomic Assembly and Polishing
A. Assembly and Polishing
- Long-Read Assembly: Perform a de novo assembly of the filtered ONT reads using Flye, which is highly effective for long, error-prone reads [56].
- Polish with Short Reads: Use the Illumina short reads to polish the Flye assembly with multiple rounds of Medaka (for ONT data) followed by Pilon (which uses the Illumina reads). This iterative process corrects INDELs and substitutions, resulting in a final assembly with accuracy >99.99% [56].
B. Analysis
- Binning: Use binning tools (e.g., MetaBAT2) on the polished assembly to reconstruct Metagenome-Assembled Genomes (MAGs).
- Functional Annotation: Annotate MAGs with tools like Prokka to identify genes, including those for antibiotic resistance (ARGs) and virulence factors.
Table 2: Essential Research Reagent Solutions for Robust Gut Microbiome Sequencing.
| Reagent / Kit | Function | Application Note |
|---|---|---|
| DNeasy PowerSoil Kit (QIAGEN) | Standardized DNA extraction from fecal samples. | Ensures consistent lysis of Gram-positive and Gram-negative bacteria, critical for representative community profiling [16]. |
| QIAseq 16S/ITS Region Panel (Qiagen) | Targeted amplification for Illumina 16S libraries. | Integrated ISO-certified workflow includes positive controls for library construction [10]. |
| ONT 16S Barcoding Kit (SQK-16S114) | Preparation of full-length 16S libraries for Nanopore. | Designed for multiplexing; use with R10.4.1 flow cells for improved homopolymer accuracy [10] [55]. |
| SMRTbell Prep Kit 3.0 (PacBio) | Library prep for HiFi sequencing. | An alternative for generating highly accurate long reads, suitable for full-length 16S sequencing without a hybrid approach [12]. |
| ZymoBIOMICS Gut Microbiome Standard | Mock community control. | Contains known abundances of microbial strains; essential for quantifying technical bias and error rates in any workflow [12]. |
The choice between Illumina and ONT is not a matter of identifying a universally superior technology, but of aligning the platform's characteristics with the specific research objectives.
- Choose Illumina MiSeq/NextSeq when: The primary goal is high-throughput, cost-effective profiling of microbial communities at the genus level for large cohort studies. It is the preferred platform for achieving the highest statistical power in detecting abundance changes across many samples and is ideal for hypothesis generation [10] [2].
- Choose ONT MinION/GridION when: The research demands species-level or strain-level resolution, rapid turnaround time (e.g., for clinical diagnostics), or the ability to perform sequencing in the field. Its long reads are also superior for resolving complex genomic regions and assembling complete genomes in hybrid protocols [10] [28] [53].
- Adopt a Hybrid Approach when: The study requires complete, high-fidelity microbial genomes from complex metagenomic samples. This strategy combines the unparalleled accuracy of Illumina with the scaffold-building power of ONT long reads, mitigating the inherent errors of both platforms to produce the highest quality genomic data [56] [54].
Future directions will see the increasing use of PacBio HiFi sequencing, which offers long reads with very high accuracy (>99.9%), potentially reducing the need for hybrid approaches [16] [12]. Regardless of the platform, the consistent use of mock community standards and the careful application of the error-mitigation protocols outlined in this guide are imperative for generating reliable, reproducible, and biologically meaningful data in gut microbiome research.
Addressing PCR Amplification Biases in 16S rRNA Studies
In gut microbiome research, 16S ribosomal RNA (rRNA) gene sequencing has become a foundational method for profiling microbial communities without the need for cultivation [2] [9]. Despite its widespread adoption, this technique is susceptible to multiple sources of bias, particularly during the polymerase chain reaction (PCR) amplification step that precedes sequencing [57]. PCR amplification introduces systematic errors that can distort the true biological representation of microbial communities by preferentially amplifying certain templates over others [57] [58]. These biases represent a significant challenge for quantitative microbiome research, as they can substantially impact estimates of microbial relative abundances, potentially skewing results by a factor of four or more [57]. Understanding, measuring, and correcting for these biases is therefore essential for selecting appropriate next-generation sequencing (NGS) platforms and ensuring data accuracy in gut microbiome studies.
The sources of PCR bias are multifaceted, originating from both primer-template mismatches and non-primer-mismatch (NPM) factors [57]. Early-cycle bias predominantly results from primer-template mismatches, where even single nucleotide differences can lead to preferential amplification of up to 10-fold [57]. In contrast, mid-to-late cycle biases (PCR NPM-bias) emerge from differential amplification efficiencies between templates independent of primer binding, becoming increasingly pronounced with additional PCR cycles [57]. Additional complications arise from interference by DNA flanking the template region and polymerase errors that accumulate during amplification [59] [58]. The following sections provide a technical examination of these bias mechanisms, present quantitative assessments of their impact, detail experimental and computational correction strategies, and discuss implications for NGS platform selection in gut microbiome research.
Primer-Template Mismatches and Early-Cycle Bias
The initial cycles of PCR amplification are particularly vulnerable to biases introduced by sequence mismatches between universal primers and template DNA. These mismatches occur due to natural genetic variation in the 16S rRNA gene across different bacterial taxa. Research has demonstrated that even single nucleotide mismatches between primer and template can lead to preferential amplification of up to 10-fold [57]. This bias manifests primarily in the first three PCR cycles, after which the original primer binding sequences are replaced by sequences complementary to the primers themselves [57]. The impact of primer-template mismatches is further complicated by the selection of hypervariable regions targeted for amplification. Studies have shown that different variable regions (V1-V2, V3-V4, etc.) can yield differing taxonomic representations due to sequence variation affecting primer binding efficiency [9] [10].
Non-Primer-Mismatch (NPM) Bias in Mid-to-Late PCR Cycles
Even with perfect primer matching, significant biases emerge during later PCR cycles due to differential amplification efficiencies between templates. Termed "PCR NPM-bias" (non-primer-mismatch bias), this phenomenon causes the composition of template mixtures to become increasingly distorted between cycles 10 and 35 [57]. Studies of environmental DNA have demonstrated that observed community richness can decrease by a factor of approximately four between cycles 10 and 15 alone [57]. This bias likely originates from multiple factors including template secondary structure, GC content, and fragment length [57]. The enzymatic properties of different polymerase enzymes also contribute to NPM-bias, with various polymerases exhibiting distinct preferences for specific sequence contexts [57].
Interference from Flanking DNA and Polymerase Errors
Evidence suggests that genomic DNA segments outside the amplified template region can inhibit initial PCR steps to different degrees across bacterial species [58]. This flanking DNA interference represents a particularly challenging source of bias because it cannot be addressed through primer optimization alone. Additionally, polymerase errors that occur during amplification can create artificial diversity, especially problematic when using unique molecular identifiers (UMIs) where PCR errors can lead to overcounting of molecular tags and inaccurate transcript quantification [59]. One study found that PCR can be a more significant source of UMI errors than sequencing itself, with error rates increasing substantially with additional PCR cycles [59].
Table 1: Quantitative Impact of Different PCR Bias Mechanisms
| Bias Mechanism | Cycle Phase Affected | Maximum Impact Documented | Primary Factors |
|---|---|---|---|
| Primer-Template Mismatch | Early (1-3 cycles) | Up to 10-fold preferential amplification [57] | Single nucleotide mismatches, primer binding affinity |
| Non-Primer-Mismatch (NPM) Bias | Mid-to-late (10-35 cycles) | 4-fold skew in relative abundances [57] | Template secondary structure, GC content, fragment length |
| Flanking DNA Interference | Initial cycles | Species-dependent preferential amplification [58] | Genomic context surrounding target region |
| Polymerase Errors | Throughout amplification | UMI error rates >25% at high cycles [59] | Polymerase fidelity, number of cycles |
Quantitative Assessment of PCR Bias Impact
Magnitude of Bias in Mock Community Studies
Experimental data from mock bacterial communities with known composition provides the most direct evidence of PCR bias magnitude. These controlled studies have demonstrated that PCR NPM-bias can skew estimates of microbial relative abundances by a factor of 4 or more [57]. One particularly revealing experiment showed that 16S rDNA from one species out of four was preferentially amplified in a model microbial consortium, significantly distorting the apparent community structure [58]. The direction and magnitude of this bias varies by taxonomic group, with some species consistently overrepresented while others are underrepresented in the final sequencing data.
Platform-Specific Bias Patterns
The choice of sequencing platform introduces additional layers of bias through their interaction with PCR amplification. Comparative studies of Illumina and Oxford Nanopore Technologies (ONT) platforms have revealed systematic differences in taxon representation [10]. For instance, ONT has been observed to overrepresent certain taxa (e.g., Enterococcus, Klebsiella) while underrepresenting others (e.g., Prevotella, Bacteroides) [10]. Illumina sequencing, while generally providing higher accuracy for short-read applications, struggles with species-level resolution due to its limited read length [10]. These platform-specific biases compound PCR-derived biases, creating complex interactions that must be considered in experimental design.
Impact on Diversity Metrics
PCR biases substantially impact both alpha and beta diversity measures, which are fundamental to microbiome study conclusions. One comparative analysis found that Illumina captured greater species richness compared to ONT, while community evenness remained comparable between platforms [10]. The effect of sequencing platform on beta diversity was more pronounced in complex microbiomes, with significant differences observed in pig samples but not in human samples [10]. This suggests that bias correction strategies may need to be tailored based on sample complexity and community structure.
Table 2: Comparative Analysis of NGS Platforms for 16S rRNA Sequencing
| Platform Feature | Illumina | Oxford Nanopore Technologies (ONT) |
|---|---|---|
| Read Length | Short reads (~300 bp) [10] | Full-length 16S rRNA reads (~1,500 bp) [10] |
| Error Rate | <0.1% [10] | 5-15% (improving with new chemistries) [10] |
| Taxonomic Resolution | Genus-level reliable, species-level challenging [9] [10] | Species-level and strain-level possible [10] |
| PCR Bias Interaction | Cluster generation requires PCR amplification [60] | Direct sequencing possible, but PCR often used |
| Strength in Gut Microbiome | Broad microbial surveys, quantitative accuracy [10] [61] | Species-level resolution, rare pathogen detection [62] |
Experimental Strategies for Bias Mitigation
Laboratory Protocols for Minimizing Bias
Optimized PCR Conditions: Limiting PCR cycle number represents one of the most straightforward approaches to reducing amplification bias. Studies recommend minimizing cycles to the lowest number that still provides sufficient material for sequencing [57] [58]. Additionally, polymerase selection significantly impacts bias, with different enzymes exhibiting varying amplification efficiencies across templates [57]. Empirical testing of multiple polymerases using mock communities can identify the optimal enzyme for specific sample types.
Primer Selection and Design: Given the profound impact of primer-template mismatches, careful primer selection is crucial. Research suggests that community diversity analysis can be improved by using at least two different primer sets targeting different variable regions [58]. This approach helps overcome biases specific to particular primer binding sites. For comprehensive coverage, full-length 16S rRNA sequencing approaches made possible by long-read technologies can circumvent the regional bias associated with short-read sequencing of specific hypervariable regions [10].
Unique Molecular Identifiers (UMIs): Incorporating UMIs - random oligonucleotide sequences that tag individual molecules before amplification - enables computational correction of PCR biases [59]. Recent advances in UMI design include homotrimeric nucleotide blocks that provide error-correcting capabilities [59]. This approach uses a 'majority vote' method where each nucleotide position is determined by three redundant bases, allowing correction of substitution errors and indels that would otherwise corrupt molecular counts.
The Calibration Experiment Approach
A powerful method for quantifying and correcting PCR NPM-bias involves adding a simple calibration experiment to standard sequencing workflows [57]. This approach requires pooling aliquots of extracted DNA from each study sample into a single calibration sample, which is then split into aliquots and amplified for different numbers of PCR cycles. By sequencing these aliquots at different cycle numbers, researchers can directly measure how amplification biases accumulate across cycles and build models to correct for these biases in the actual study samples [57]. This method provides study-specific bias quantification without requiring mock communities, making it applicable to diverse sample types including human gut microbiota.
Computational Correction Methods
Log-Ratio Linear Models
Building on early work by Suzuki and Giovannoni, who demonstrated that PCR bias in two-template mixtures follows a log-ratio linear pattern, recent computational approaches have extended this model to complex microbial communities [57]. The fundamental model describes the relative amplification of two transcripts after x PCR cycles as:
Where wi1/wi2 represents the relative abundance after xi cycles, a1/a2 the true starting ratio, and b1/b2 the ratio of amplification efficiencies [57]. For microbiome applications, this model has been generalized to handle multiple taxa simultaneously using multinomial logistic-normal linear models that account for the compositional nature of 16S rRNA sequencing data [57]. These models can be implemented using statistical packages like the R package fido, which efficiently handles the sparse, zero-laden data typical of microbiome datasets [57].
Bioinformatic Tools for Bias Correction
Several specialized bioinformatics tools have been developed to address PCR biases in 16S rRNA data:
Minitax: A recently developed software tool designed to provide consistent results across different platforms and methodologies [51]. This tool aligns sequencing reads to reference databases and determines the most probable taxonomy for each read based on mapping qualities and CIGAR strings, helping to standardize analysis across different experimental setups.
Homotrimeric UMI Correction: This specialized approach corrects PCR errors in unique molecular identifiers by synthesizing UMIs using homotrimeric nucleotide blocks [59]. Each nucleotide position is represented by three identical bases, enabling a majority vote correction method that significantly improves counting accuracy compared to traditional monomeric UMIs [59].
DADA2 and Deblur: These algorithms model and correct PCR errors in amplicon sequencing data by identifying amplicon sequence variants (ASVs) rather than clustering sequences into operational taxonomic units (OTUs) [9] [51]. This approach provides higher resolution and can distinguish genuine biological sequences from PCR errors.
Integrated Bioinformatics Pipelines
Comprehensive pipelines like nf-core/ampliseq and EPI2ME provide end-to-end solutions for 16S rRNA data analysis, incorporating multiple bias correction steps [10] [51]. These pipelines typically include quality filtering, chimera removal, error correction, and taxonomic assignment in a reproducible workflow. The selection of appropriate reference databases (SILVA, Greengenes, RDP) further influences bias correction, as database completeness affects taxonomic assignment accuracy [9].
Table 3: Research Reagent Solutions for PCR Bias Mitigation
| Resource Category | Specific Examples | Function in Bias Reduction |
|---|---|---|
| DNA Extraction Kits | Zymo Research Quick-DNA HMW MagBead Kit [51] | High-quality DNA extraction with minimal bias against Gram-positive bacteria |
| Library Preparation | Illumina DNA Prep [51] | Consistent library preparation with minimal bias introduction |
| Polymerase Enzymes | Various high-fidelity polymerases [57] | Reduced amplification bias through improved template fidelity |
| UMI Systems | Homotrimeric nucleotide UMI designs [59] | Error-correcting molecular identifiers for precise molecular counting |
| 16S Amplification Panels | QIAseq 16S/ITS Region Panel [10] | Targeted amplification with minimized primer bias |
| Bioinformatics Tools | Minitax, DADA2, EPI2ME, nf-core/ampliseq [10] [51] | Computational correction of remaining PCR and sequencing biases |
Addressing PCR amplification biases is not merely a technical concern but a fundamental requirement for generating reliable, reproducible gut microbiome data. The selection of appropriate NGS platforms must consider their interaction with PCR bias - while Illumina provides superior accuracy for quantitative applications, ONT enables full-length 16S sequencing that circumvents regional bias [10]. An ideal approach may involve hybrid sequencing strategies that leverage the strengths of multiple platforms while implementing both experimental and computational bias correction methods.
For researchers designing gut microbiome studies, we recommend: (1) implementing calibration experiments to quantify study-specific biases [57], (2) utilizing homotrimeric UMIs where precise quantification is critical [59], (3) selecting extraction methods that minimize taxonomic bias [51], and (4) applying appropriate bioinformatic corrections for remaining biases [57] [51]. As sequencing technologies continue to evolve, with single-molecule approaches potentially eliminating amplification entirely, PCR biases may become less concerning. However, for current 16S rRNA-based gut microbiome research, a thorough understanding and systematic addressing of PCR amplification biases remains essential for advancing our understanding of host-microbiome interactions in health and disease.
Strategies for Low-Biomass Samples and Contamination Control
The accurate characterization of the gut microbiome is fundamental to understanding its role in human health and disease. However, when investigating low-biomass environments or samples with high host contamination, researchers face unique methodological challenges that can compromise data integrity. Low microbial biomass samples, characterized by minimal microbial DNA relative to host DNA, pose exceptional vulnerabilities to contamination from laboratory reagents, kits, and the environment [63]. Such contamination can lead to false positives and significantly skewed results, potentially derailing downstream analyses and therapeutic development efforts. For drug development professionals and researchers working with delicate gut microbiome samples—such as mucosal biopsies, luminal washes, or samples from interventional studies where microbial load may be reduced—implementing robust contamination control strategies is not merely best practice but an essential component of reliable science. This technical guide outlines comprehensive, evidence-based strategies for preventing and identifying contamination throughout the research workflow, ensuring that results reflect true biological signals rather than technical artifacts.
Contamination in low-biomass microbiome studies originates from multiple sources, each introducing distinct taxonomic "bread crumbs" that can be misidentified as genuine signal [64]. External sources include DNA extraction kits, laboratory reagents, personnel, and the laboratory environment itself [63] [64]. Internal sources may include sample mislabeling or cross-contamination between samples during processing [64]. The impact of these contaminants is disproportionately large in low-biomass contexts because the contaminant DNA can constitute a significant fraction, or even the majority, of the total sequenced DNA [63]. This effect is particularly pronounced in gut microbiome studies involving mucosal biopsies or samples from specific intestinal niches where bacterial density may be low. Furthermore, contaminants have been documented to find their way into public reference databases, perpetuating errors and complicating comparative analyses across studies [64].
Sequencing Platform Selection for Low-Biomass Gut Microbiome Research
The choice of sequencing platform influences the resolution, accuracy, and potential biases in profiling gut microbial communities. The table below summarizes a comparative analysis of the dominant next-generation sequencing platforms, synthesizing findings from studies on respiratory and soil microbiomes, which provide relevant insights for gut research [10] [65].
Table 1: Comparative Evaluation of Sequencing Platforms for Microbiome Profiling
| Platform | Technology | Read Length | Key Strengths | Key Limitations | Best-Suited Gut Microbiome Applications |
|---|---|---|---|---|---|
| Illumina | Short-read, sequencing by synthesis | ~300 bp (e.g., V3-V4) [10] | High accuracy (<0.1% error rate) [10]; High sensitivity for species richness [10]; Ideal for broad microbial surveys [10] | Limited species-level resolution due to short reads [10] | Large-scale population studies; Genus-level community profiling; When high reproducibility and depth are critical [10] |
| Oxford Nanopore Technologies (ONT) | Long-read, nanopore | Full-length 16S rRNA (~1,500 bp) [10] | Species- and strain-level resolution [10] [65]; Real-time data analysis [10] | Historically higher error rates (5-15%), though improved with new chemistry [10] [65] | Studies requiring species-level identification; Functional analysis of specific pathways; Rapid, field-based sequencing [10] |
| Pacific Biosciences (PacBio) | Long-read, circular consensus sequencing (CCS) | Full-length 16S rRNA [65] | High accuracy (>99.9%) with CCS [65]; Excellent species-level resolution [65] | Higher DNA input requirements; Lower throughput than Illumina [65] | High-fidelity characterization of key taxa; Reference-grade genome assembly; Resolving complex taxonomic questions [65] |
Platform selection should align with specific research goals. Illumina is ideal for large-scale gut microbiome surveys where high accuracy and depth are paramount for detecting shifts in overall community structure. In contrast, ONT and PacBio are superior for investigations requiring species-level resolution, such as tracking specific probiotic strains or pathogens within the gut ecosystem [10] [65]. A hybrid approach, utilizing Illumina for broad surveys and long-read platforms for deep characterization of key samples, can effectively leverage the strengths of both technologies.
Comprehensive Experimental Workflow for Contamination Control
A rigorous, multi-layered strategy is essential to mitigate contamination from sample collection through data analysis. The following workflow diagram and subsequent breakdown detail the critical steps.
Sample Collection and Handling
- Sterile Technique: Use sterile, DNA-free consumables for sample collection. For gut biopsies, this includes specialized collection tubes that preserve DNA integrity and inhibit host nucleases.
- Immediate Stabilization: Snap-freeze samples in liquid nitrogen or place in specialized DNA/RNA stabilizers immediately after collection to prevent microbial growth or degradation [63].
- Metadata Documentation: Meticulously record all reagents and equipment batch numbers, as contaminant profiles can vary between lots [63] [64].
DNA Extraction and Laboratory Processing
- Kit Selection: Employ DNA extraction kits validated for low-biomass samples. These kits often incorporate reagents designed to lyse tough bacterial cell walls while minimizing contaminant introduction.
- Dedicated Workspace: Perform extractions and pre-amplification steps in a dedicated, clean laboratory space, ideally with UV irradiation and positive airflow to reduce environmental contamination [63].
- Essential Controls:
- Negative Controls: Include extraction controls where sterile water is processed alongside samples to identify kit and laboratory-derived contaminants [63] [64].
- Positive Controls: Use a mock microbial community with a known composition to assess the efficiency and bias of the entire workflow, from extraction to sequencing [63].
- Blank Controls: Include master mix blanks during library preparation to detect contamination from PCR reagents [63].
Library Preparation and Sequencing
- Clean Lab Practices: Conduct library preparation in a PCR clean hood to prevent amplicon contamination. Use UV irradiation to degrade contaminating DNA in workstations and reagents [63].
- Minimize PCR Cycles: Use the minimum number of PCR cycles necessary during library amplification to reduce the amplification of contaminant DNA and chimera formation [10].
- Replication: Process technical replicates to distinguish consistent biological signals from stochastic contamination.
Computational Identification of Contaminants
When experimental controls are unavailable or insufficient, computational tools are indispensable for identifying putative contaminants. The tool Squeegee represents a significant advancement as a de novo contamination detection tool that does not require negative control samples [64]. Its underlying principle is that contaminants from the same source (e.g., a specific DNA extraction kit) will appear across samples from distinct ecological niches, whereas genuine community members will be niche-specific.
Table 2: Computational Tools for Contaminant Identification
| Tool | Methodology | Input Requirements | Key Application in Gut Microbiome Studies |
|---|---|---|---|
| Squeegee [64] | Identifies species shared across dissimilar sample types, then filters false positives via coverage depth and sample similarity. | Multiple samples from distinct body sites or environments. | Ideal for re-analysis of public datasets lacking controls; Validating contamination in multi-site gut studies. |
| Decontam [64] | Prevalence-based (uses negative controls) and/or frequency-based (uses DNA concentration). | Negative control samples and/or DNA quantitation data. | Primary analysis when proper negative controls are available; Effective for batch-effect correction. |
Squeegee's performance has been benchmarked against negative control-based methods. In one evaluation, it achieved a weighted recall of 0.958 and a weighted precision of 0.856 at the genus level, meaning it correctly identified the majority of high-abundance contaminants with a low false-positive rate [64]. This makes it particularly valuable for analyzing historical or public gut microbiome datasets where negative controls were not collected or are unavailable.
The Scientist's Toolkit: Essential Reagents and Materials
The following table details key reagents and their critical functions in managing low-biomass and contamination challenges, based on methodologies cited in the literature.
Table 3: Essential Research Reagents and Solutions for Low-Biomass Studies
| Reagent / Material | Function & Application | Example Use-Case in Protocol |
|---|---|---|
| DNA/RNA Stabilization Buffer | Preserves nucleic acid integrity from moment of collection, inhibiting nucleases and preventing microbial growth shifts. | Immediate immersion of gut biopsy samples to preserve in vivo microbial community structure. |
| Low-Biomass Validated DNA Extraction Kits (e.g., ZymoBIOMICS, Norgen Biotek) | Designed for maximal microbial lysis and DNA yield from small inputs while minimizing kit-borne contaminant DNA. | Used with ~1 mL sample volume; includes bead-beating for mechanical lysis of tough Gram-positive bacteria [10]. |
| Mock Microbial Communities (e.g., ZymoBIOMICS Standard) | Defined mix of microbial genomes serving as a positive control to quantify technical bias and recovery efficiency. | Added to a separate sample aliquot to benchmark extraction and sequencing performance across batches [65]. |
| DNA-free Water and Reagents | Certified nuclease-free and DNA-free to prevent introduction of contaminating DNA during reactions. | Used as the solvent for all PCR master mixes and as the negative control template [63]. |
| UNG (Uracil-N-Glycosylase) Treatment | Enzymatically degrades carryover PCR amplicons from previous experiments to prevent cross-contamination. | Added to PCR master mix prior to thermal cycling to destroy contaminating amplicons containing dUTP. |
The integrity of gut microbiome research, particularly in low-biomass contexts, is entirely dependent on the rigorous implementation of contamination control strategies. There is no single solution; rather, reliability is achieved through a holistic approach that integrates conscious platform selection, stringent laboratory practices with appropriate controls, and robust bioinformatic cleaning of sequence data. By adhering to these best practices, researchers and drug development professionals can generate data of the highest quality, ensuring that subsequent insights into host-microbiome interactions, biomarker discovery, and therapeutic development are built upon a foundation of trustworthy science.
The selection of an optimal Next-Generation Sequencing (NGS) platform for gut microbiome research represents only the initial step in generating reliable microbial community data. Even the most advanced sequencing technology cannot compensate for poor data quality control, which remains a fundamental aspect of robust microbiome analysis. The accuracy of gut microbiome characterization is directly influenced by multiple technical factors throughout the experimental workflow, from sample collection to bioinformatic processing [50] [66]. These technical variations can significantly impact biological interpretations, potentially leading to erroneous conclusions about microbial community structures and their relationships to host health and disease [66].
Quality control in microbiome sequencing encompasses both laboratory and computational approaches designed to minimize technical artifacts and biases. In the context of gut microbiome studies, which often involve complex microbial communities with diverse taxonomic members, effective quality control must address multiple potential sources of error [50]. These include sequencing platform-specific errors, PCR amplification artifacts, chimeric sequence formation, and contamination from various sources [66]. Additionally, the choice of DNA extraction method introduces substantial bias, particularly affecting gram-positive bacteria with more rigid cell wall structures that may lyse less efficiently than gram-negative species [66] [51]. Without comprehensive quality control procedures, these technical confounders can obscure true biological signals and compromise the validity of research findings [66].
The gut microbiome presents unique challenges for quality control due to its exceptional complexity, varying microbial densities, and the presence of difficult-to-lyse bacterial taxa [51]. Furthermore, the low biomass nature of some gut samples makes them particularly susceptible to contamination effects [66]. This technical guide provides a comprehensive framework for implementing rigorous quality control procedures specifically tailored to gut microbiome research, encompassing both laboratory and computational approaches to ensure data integrity and biological relevance.
NGS Platform Selection: Balancing Accuracy, Resolution, and Throughput for Gut Microbiome Analysis
The choice of sequencing platform establishes the foundation for data quality in gut microbiome studies. The two predominant technologies—Illumina short-read and Oxford Nanopore long-read sequencing—offer complementary strengths and limitations. A comparative analysis of these platforms reveals key performance characteristics that influence their suitability for different research applications [10].
Table 1: Comparative Analysis of Sequencing Platforms for Gut Microbiome Studies
| Feature | Illumina Platforms | Oxford Nanopore Technologies |
|---|---|---|
| Read Length | Short reads (~300 bp) [10] | Long reads (>1,500 bp, full-length 16S) [10] |
| Error Rate | Low (<0.1%) [10] | Higher (5-15%), though improving [10] |
| Taxonomic Resolution | Genus-level, limited species-level resolution [10] | Species-level and strain-level resolution [10] |
| Throughput | High [10] | Moderate, but real-time capability [10] |
| Strengths | High accuracy, well-established protocols, ideal for broad microbial surveys [10] | Species-level identification, real-time applications, portable options [10] |
| Limitations | Limited resolution for closely related species [10] | Higher error rates require sophisticated error correction [10] |
Illumina sequencing platforms target specific hypervariable regions of the 16S rRNA gene (typically V3-V4), providing high-accuracy, short-read data suitable for genus-level classification [10]. This approach captures greater species richness in complex microbial communities like the gut microbiome but struggles to resolve closely related bacterial species due to its limited read length [10]. In contrast, Oxford Nanopore Technologies generates full-length 16S rRNA reads, enabling higher taxonomic resolution down to the species level, which is particularly valuable for distinguishing between closely related bacterial species that may have different functional roles in the gut ecosystem [10].
The selection between these platforms should align with specific research objectives. Illumina is ideal for large-scale population studies where high accuracy and reproducibility are critical, while ONT excels in applications requiring species-level resolution or rapid, field-based sequencing [10]. Emerging hybrid approaches that leverage the strengths of both technologies show promise for improving microbiome characterization in complex environments like the gut [10].
Laboratory Procedures: Establishing Robust Foundations for Quality Data
DNA Extraction Considerations for Gut Microbiome Samples
The DNA extraction process introduces substantial bias in gut microbiome studies, significantly impacting downstream community composition results [66] [51]. Different extraction protocols vary in their efficiency for lysing various bacterial cell types, particularly affecting gram-positive bacteria with more rigid cell wall structures [51]. Comprehensive comparisons of DNA extraction kits have revealed significant differences in both the quantity and quality of extracted nucleic acids, which directly influence sequencing results and microbial composition accuracy [51].
Table 2: DNA Extraction Kit Performance Comparison for Stool Samples
| Kit | Yield | Quality/Degradation | Host DNA Ratio | Reproducibility |
|---|---|---|---|---|
| Zymo Research MagBead | High (despite half sample volume) [51] | High quality, suitable for long-read sequencing [51] | Low bacterial DNA selectivity [51] | Most consistent with minimal variation [51] |
| Macherey-Nagel (MN) | Highest yield [51] | Suitable for long-read sequencing [51] | Low host DNA ratio [51] | Reliable consistency [51] |
| Invitrogen (I) | Moderate yield [51] | Suitable for long-read sequencing [51] | Low host DNA ratio [51] | Highest variance between replicates [51] |
| Qiagen (Q) | Lowest yield [51] | Most degraded DNA [51] | Significantly higher host DNA [51] | Below-average consistency [51] |
A comprehensive evaluation of four commercial DNA isolation kits revealed substantial differences in performance characteristics [51]. The Zymo Research Quick-DNA HMW MagBead Kit produced the most consistent results with minimal variation among replicates, despite using only half the initial sample volume [51]. The Macherey-Nagel kit yielded the highest DNA quantity, while the Qiagen kit consistently produced the lowest yield and most degraded DNA across multiple canine stool samples [51]. These findings highlight the critical importance of DNA extraction kit selection for gut microbiome studies, as this initial step can significantly influence all subsequent analyses.
Addressing Extraction Bias Through Morphological Correction
Extraction bias remains one of the most significant confounders in microbiome sequencing studies, with different protocols exhibiting varying lysis efficiencies and DNA recovery rates across bacterial taxa [66]. Recent research has demonstrated that extraction bias per species is predictable by bacterial cell morphology, enabling computational correction of this protocol-dependent bias [66]. By using mock community controls with known composition, researchers can measure taxon-specific extraction efficiencies and apply morphology-based corrections to improve the accuracy of resulting microbial compositions [66].
This innovative approach links bias to cellular properties, allowing for the transfer of bias corrections from mock communities to environmental microbiome samples containing non-mock taxa [66]. Implementation of this correction method has shown substantial impacts on microbiome compositions, representing an important advancement toward overcoming protocol biases and improving cross-study comparability in gut microbiome research [66].
Computational Quality Control: From Raw Reads to Analysis-Ready Data
Quality Assessment of Raw Sequencing Data
The initial quality assessment of raw sequencing data represents a critical first step in computational quality control. The FASTQ file format serves as the standard output from sequencing instruments, containing both nucleotide sequences and quality scores for each base call [67]. Several key metrics enable comprehensive evaluation of raw read quality, including Q scores, error rates, GC content, adapter contamination, and duplicate read percentages [67].
FastQC has emerged as one of the most widely used tools for initial quality assessment, providing comprehensive visualization of quality metrics through an intuitive interface [67]. The "per base sequence quality" graph is particularly valuable, displaying the distribution of quality scores across all read positions [67]. Quality scores (Q scores) follow the formula Q = -10log₁₀P, where P represents the probability of an incorrect base call [67]. A Q score of 30 indicates a 1 in 1000 chance of an erroneous base call (99.9% accuracy) and is generally considered the minimum threshold for high-quality data in most applications [67].
For long-read technologies such as Oxford Nanopore, specialized quality control tools like Nanoplot and PycoQC provide tailored visualization of quality metrics and read length distributions [67]. These tools account for the distinct characteristics of long-read data, including higher error rates that are typically randomly distributed rather than showing the 3' end quality degradation common in Illumina sequencing [10] [67].
Read Trimming and Adapter Removal
Read trimming represents an essential preprocessing step to remove low-quality bases and adapter sequences before downstream analysis. The optimal stringency of quality trimming requires careful consideration, as overly aggressive trimming may discard valuable biological data while insufficient trimming can introduce errors in assembly and taxonomic classification [68].
Table 3: Quality Trimming Strategies and Their Applications
| Trimming Stringency | Phred Score Threshold | Recommended Applications | Considerations |
|---|---|---|---|
| Very Gentle | Phred <2 [68] | Studies focusing on low-expression transcripts [68] | Maximizes data retention but may retain some errors [68] |
| Gentle | Phred <5 [68] | Most mRNA-Seq studies; optimal for transcriptome assembly [68] | Balanced approach for error reduction and data retention [68] |
| Moderate | Phred <10 | Standard microbiome studies with high-quality DNA | Common default in many pipelines |
| Aggressive | Phred <20 [68] | Applications requiring highest base accuracy | May remove substantial high-quality data [68] |
Empirical studies comparing trimming stringency have demonstrated that gentle trimming (Phred score threshold of 2-5) optimizes the balance between error reduction and data retention for most applications [68]. Although aggressive trimming (Phred score threshold of 20) was historically common, this approach may remove substantial high-quality data, as nucleotides with Phred scores of 20 are still accurate 99% of the time [68].
Adapter contamination occurs when adapter sequences used in library preparation are not fully removed from the sequencing data, leading to false alignments and reduced analytical accuracy [67]. Tools such as Cutadapt and Trimmomatic effectively identify and remove adapter sequences [67] [69]. Cutadapt offers multiple adapter types to accommodate different experimental designs, including regular 3' adapters (-a option), regular 5' adapters (-g option), and anchored adapters that require exact matches at read ends [69]. For gut microbiome studies employing amplicon sequencing, anchored adapters are particularly relevant for removing PCR primers that appear in full at the beginning of reads [69].
Chimera Detection and Removal
Chimeric sequences represent artificial concatenations of biologically distinct sequences formed during PCR amplification, particularly in multi-template reactions with high homology between templates, as occurs in 16S rRNA gene sequencing experiments [66]. These artifacts inflate diversity estimates and can lead to erroneous taxonomic assignments if not properly addressed [66]. Research has demonstrated that chimera formation increases with higher input DNA concentrations, highlighting the importance of appropriate template dilution in PCR amplification [66].
Multiple computational approaches exist for chimera detection and removal, each with distinct methodologies and performance characteristics. DADA2 implements a sophisticated model-based approach that can simultaneously correct sequencing errors and remove chimeras, providing amplicon sequence variants (ASVs) rather than traditional operational taxonomic units (OTUs) [10]. UCHIME and ChimeraSlayer represent additional widely used algorithms that compare query sequences against reference databases or leverage abundance-based information to identify chimeric artifacts [66]. The effectiveness of these tools varies depending on sequencing platform, read length, and community complexity, necessitating careful selection and parameter optimization for gut microbiome applications [66].
Integrated Quality Control Protocols
Experimental Protocol: Comprehensive 16S rRNA Amplicon Sequencing Quality Control
Sample Collection and DNA Extraction:
- Collect gut microbiome samples using standardized collection methods appropriate for the study design (e.g., stool collection kits with stabilizers).
- Extract genomic DNA using a bead-beating protocol validated for gram-positive and gram-negative bacteria. The Zymo Research Quick-DNA HMW MagBead Kit has demonstrated excellent performance for stool samples [51].
- Include extraction controls (mock communities with known composition) to monitor and correct for extraction bias [66]. Recent research enables computational correction of extraction bias based on bacterial cell morphology using these mock controls [66].
- Quantify DNA concentration using fluorometric methods (e.g., Qubit Fluorometer) and assess purity via spectrophotometry (e.g., Nanodrop). Acceptable parameters include A260/A280 ratios of ~1.8-2.0 [67].
Library Preparation and Sequencing:
- Amplify the appropriate hypervariable region(s) of the 16S rRNA gene using primers with attached Illumina adapter sequences. The V3-V4 region (~460 bp) provides a balance between taxonomic resolution and amplicon size for Illumina platforms [10].
- For full-length 16S rRNA sequencing, utilize the Oxford Nanopore 16S Barcoding Kit with unique barcodes for each sample [10].
- Perform library quantification and quality assessment using capillary electrophoresis (e.g., Agilent TapeStation) to ensure appropriate fragment size distribution [67].
- Sequence libraries on the appropriate platform following manufacturer recommendations. For Illumina, target 50,000-100,000 reads per sample for gut microbiome studies; for Nanopore, sequence until sufficient coverage is achieved (typically 10,000-50,000 reads per sample) [10].
Computational Analysis:
- Perform initial quality assessment using FastQC for Illumina data or Nanoplot for Nanopore data [67].
- Remove adapter sequences and low-quality bases using Cutadapt with the following parameters for 16S amplicon data: This command simultaneously removes forward primers at the 5' end (-g ^FWPRIMER) and reverse primers at the 3' end (-a RVADAPTER) while filtering short reads and those with ambiguous bases [69].
- For quality trimming, use a Phred score threshold of 5-10, which provides optimal balance between error reduction and data retention [68].
- Process quality-filtered reads through DADA2 for error correction, dereplication, and chimera removal [10]. Alternatively, for reference-based chimera detection, use UCHIME against the SILVA database [66].
- Perform taxonomic assignment using the SILVA 138.1 reference database or other appropriate curated databases [10].
- Conduct final data curation by removing contaminants identified through negative controls and applying abundance filters to eliminate spurious low-frequency taxa [66].
Reagent Solutions for Quality Control in Gut Microbiome Studies
Table 4: Essential Research Reagents and Tools for Microbiome Quality Control
| Reagent/Tool | Function | Application Notes |
|---|---|---|
| ZymoBIOMICS Microbial Community Standards | Mock communities with known composition for benchmarking [66] | Use to quantify and correct technical biases throughout workflow [66] |
| Quick-DNA HMW MagBead Kit (Zymo Research) | DNA extraction with bead-beating for comprehensive lysis [51] | Provides high yield and quality with minimal host DNA contamination [51] |
| QIAseq 16S/ITS Region Panel (Qiagen) | Targeted amplification of 16S rRNA regions [10] | Includes controls for library construction steps [10] |
| SILVA 138.1 SSU Database | Curated reference database for taxonomic assignment [10] | Provides comprehensive phylogenetic framework for classification [10] |
| Cutadapt | Adapter trimming and quality filtering [69] | Flexible tool supporting multiple adapter types and quality thresholds [69] |
| DADA2 | Error correction, ASV inference, and chimera removal [10] | Model-based approach for high-resolution amplicon variant calling [10] |
Comprehensive quality control represents an indispensable component of gut microbiome research, directly influencing the validity and reproducibility of scientific findings. This guide has outlined a systematic approach to quality control spanning from initial sample processing through computational analysis, with specific considerations for the unique challenges posed by complex gut microbial communities. The integration of mock community standards enables quantification and correction of technical biases, while appropriate platform selection and computational processing ensure optimal data quality [66].
Effective quality control in gut microbiome studies requires careful consideration of multiple interdependent factors: DNA extraction efficiency across diverse bacterial morphologies [66] [51], sequencing platform characteristics [10], adapter contamination and read quality [67] [69], and chimera formation during amplification [66]. By implementing the protocols and recommendations outlined in this guide, researchers can significantly enhance the reliability of their gut microbiome data, facilitating more accurate biological interpretations and enabling meaningful comparisons across studies. As the field continues to evolve, ongoing refinement of quality control standards will further strengthen the foundation of gut microbiome research and its applications in understanding human health and disease.
NGS Platform Showdown: A Data-Driven Comparison for Gut Microbiome Research
The selection of an appropriate next-generation sequencing (NGS) platform is a critical foundational decision in gut microbiome research, directly influencing the resolution, accuracy, and biological relevance of study outcomes. The choice between short-read and long-read technologies represents a significant methodological crossroad, each with distinct advantages and limitations. Illumina's NextSeq, a dominant short-read platform, is celebrated for its high throughput and exceptional base-level accuracy, making it a workhorse for large-scale microbial profiling studies [10] [70]. In contrast, Oxford Nanopore Technologies (ONT) offers a long-read platform that sequences single DNA molecules in real-time, providing the read length necessary to resolve complex genomic regions and achieve superior taxonomic classification [10] [16]. Within the specific context of gut microbiome studies—characterized by immense microbial diversity, complex community interactions, and a critical need for accurate species-level identification—this technical comparison aims to delineate the operational performance, data characteristics, and optimal application scenarios of these two leading platforms. The goal is to provide researchers with a evidence-based framework for selecting the most appropriate technology based on their specific research objectives, whether for broad microbial surveys or detailed strain-level characterization.
Core Technology and Mechanism Comparison
The fundamental differences between Illumina and Oxford Nanopore technologies originate from their distinct biochemical approaches to DNA sequencing. Understanding these core mechanisms is essential for interpreting the data outputs and performance characteristics relevant to microbiome research.
Illumina NextSeq (Sequencing by Synthesis): The Illumina platform utilizes a sequencing-by-synthesis (SBS) approach. DNA fragments are attached to a flow cell and amplified in situ to create clusters of identical copies. Fluorescently labeled nucleotides are then incorporated sequentially by a DNA polymerase. Each incorporated nucleotide is identified by its fluorescent tag before the terminator group is cleaved to allow the next incorporation cycle. This process generates massive quantities of short, parallel reads, typically up to 2x300 bp for paired-end runs on the NextSeq [10] [70]. This method is renowned for its high raw read accuracy (exceeding 99.9%), but its short-read nature inherently limits its ability to resolve repetitive regions or span the entire length of genomic markers like the 16S rRNA gene.
Oxford Nanopore (Nanopore Sensing): Oxford Nanopore technology employs a fundamentally different strategy. A single strand of DNA is threaded through a biological protein nanopore embedded in an electrically resistant membrane. As each nucleotide passes through the pore, it causes a characteristic disruption in the ionic current. Machine learning models then decode these current changes in real-time to determine the DNA sequence [70]. A significant advancement is duplex sequencing, where both strands of a DNA molecule are read sequentially. This allows the basecaller to reconcile the two reads, correcting random errors and pushing consensus accuracy beyond Q30 (>99.9%), a level that rivals short-read platforms while retaining the advantages of long reads [70]. This technology enables read lengths that are limited only by the integrity of the DNA molecule, routinely generating reads tens of kilobases long.
The following diagram illustrates the core sequential processes and logical decision points for data generation and analysis in both technologies, highlighting their fundamental differences.
Performance Metrics in Gut Microbiome Studies
Empirical comparisons in gut microbiome research reveal how the fundamental technological differences between Illumina and Oxford Nanopore translate into distinct performance outcomes. The following table summarizes the key quantitative metrics derived from recent comparative studies, providing a clear, side-by-side comparison of their capabilities.
Table 1: Direct Performance Comparison for Gut Microbiome Analysis
| Performance Characteristic | Illumina NextSeq | Oxford Nanopore (ONT) |
|---|---|---|
| Typical Read Length | Short reads (~300 bp, paired-end) [10] | Full-length 16S rRNA reads (~1,500 bp) & long reads (>10 kb) [10] [16] |
| Raw Read Accuracy | Very high (<0.1% error rate) [10] | Lower single-read accuracy, but Duplex reads >Q30 (>99.9%) [70] |
| Species-Level Resolution | Limited (~47-48% of sequences classified) [16] | Superior (~76% of sequences classified) [16] |
| Alpha Diversity (Richness) | Captures greater species richness [10] | Slightly lower observed richness [10] |
| Community Evenness | Comparable to ONT [10] | Comparable to Illumina [10] |
| Taxonomic Bias | Detects a broader range of taxa; better for rare species [10] | Overrepresents certain taxa (e.g., Enterococcus, Klebsiella); better for dominant species [10] |
| Ideal Application | Broad microbial surveys and genus-level profiling [10] | Species-level resolution and real-time applications [10] |
The data in Table 1 demonstrates a fundamental trade-off. Illumina's superior per-base accuracy and high throughput make it a robust tool for discovering a wide range of taxa, including those at low abundance. However, Oxford Nanopore's ability to sequence the entire ~1,500 bp 16S rRNA gene provides a decisive advantage for species-level resolution, a critical requirement for many functional microbiome studies [16]. A study on rabbit gut microbiota confirmed this, showing ONT classified 76% of sequences to the species level, compared to 48% for Illumina [16]. It is crucial to note that a significant portion of species-level identifications across all platforms may be assigned ambiguous names like "uncultured_bacterium," highlighting a limitation imposed by current reference databases rather than the technology itself [16].
Experimental Protocols for Comparative Studies
To ensure the validity of a direct platform comparison, a standardized experimental design from sample collection through bioinformatics is essential. The following workflow and detailed protocol are synthesized from recent comparative studies to serve as a robust template for benchmarking NGS platforms in microbiome research.
Detailed Step-by-Step Methodology
1. Sample Collection and DNA Extraction:
- Sample Source: Collect gut microbiome samples (e.g., fecal matter) and immediately freeze at -80°C to preserve microbial integrity [10] [16].
- Standardized DNA Extraction: Extract genomic DNA from all samples using the same commercial kit, such as the DNeasy PowerSoil Kit (QIAGEN) or the Sputum DNA Isolation Kit (Norgen Biotek), strictly adhering to the manufacturer's protocol [10] [16]. This minimizes batch effects and ensures a consistent starting point for both platforms.
- DNA Quality Control: Precisely quantify DNA using a fluorometer (e.g., Qubit) and assess purity with a spectrophotometer (e.g., Nanodrop) [10].
2. Platform-Specific Library Preparation:
- Illumina NextSeq Library:
- Target Region: Amplify the V3-V4 hypervariable regions of the 16S rRNA gene using primers such as 341F and 805R [10] [16].
- Protocol: Perform a two-step PCR amplification. The first PCR amplifies the target region, and the second attaches dual indices and sequencing adapters using a kit such as the QIAseq 16S/ITS Region Panel [10].
- Oxford Nanopore Library:
- Target Region: Amplify the full-length 16S rRNA gene (V1-V9 regions, ~1,500 bp) using universal primers 27F and 1492R [16].
- Protocol: Use the ONT 16S Barcoding Kit (e.g., SQK-16S114.24). The PCR product is purified, quantified, and barcoded libraries are pooled for sequencing on a MinION flow cell (R10.4.1) [10] [16].
3. Sequencing and Data Processing:
- Sequencing Execution: Sequence Illumina libraries on a NextSeq to generate 2x300 bp paired-end reads. Sequence ONT libraries on a MinION Mk1C, running the flow cell to end-of-life (e.g., 72 hours) to maximize data yield [10].
- Bioinformatics Pipelines:
- Illumina Data: Process using established pipelines like nf-core/ampliseq. Steps include primer trimming with Cutadapt, quality filtering, denoising, and Amplicon Sequence Variant (ASV) generation with DADA2, followed by taxonomic classification against the SILVA database [10] [16].
- ONT Data: Process raw reads through the Dorado basecaller and the EPI2ME Labs 16S Workflow or a custom pipeline like Spaghetti. These pipelines handle quality control, filtering, and clustering into Operational Taxonomic Units (OTUs) or error-corrected reads, followed by taxonomic assignment with the SILVA database for a fair comparison [10] [16].
Essential Research Reagent Solutions
The following table catalogs the key reagents and kits required to execute the comparative protocol described above.
Table 2: Essential Reagents and Kits for NGS Microbiome Studies
| Item | Function | Example Products |
|---|---|---|
| DNA Extraction Kit | Isolates high-purity microbial genomic DNA from complex samples. | DNeasy PowerSoil Kit (QIAGEN) [16], Sputum DNA Isolation Kit (Norgen Biotek) [10] |
| Illumina Library Prep Kit | Prepares amplicon libraries for sequencing on Illumina platforms. | QIAseq 16S/ITS Region Panel (Qiagen) [10] |
| ONT Library Prep Kit | Prepares barcoded, full-length 16S libraries for nanopore sequencing. | 16S Barcoding Kit (SQK-16S114.24, Oxford Nanopore) [10] |
| qPCR / Fluorometry Kit | Accurately quantifies DNA concentration for library normalization. | Qubit dsDNA HS Assay Kit (Thermo Fisher Scientific) [10] |
| Bioinformatics Tools | Processes raw sequencing data into actionable biological insights. | nf-core/ampliseq, DADA2 (for Illumina) [10]; EPI2ME Labs, Spaghetti (for ONT) [10] [16] |
The choice between Illumina NextSeq and Oxford Nanopore Technologies for gut microbiome research is not a matter of identifying a universally superior platform, but rather of selecting the right tool for the specific research question. The following decision tree synthesizes the empirical data to provide a clear selection pathway.
As illustrated, Illumina NextSeq is the preferred choice for large-scale epidemiological studies or any research where the primary goal is a comprehensive, high-resolution census of microbial membership at the genus level across thousands of samples. Its high throughput, low per-sample cost, and ability to detect a wider range of taxa, including rare species, make it ideal for hypothesis generation [10].
Conversely, Oxford Nanopore is unequivocally superior when the research demands species-level or strain-level discrimination, investigation of structural variations, or access to epigenetic markers like methylation directly from native DNA. Its real-time sequencing capability is also invaluable for rapid diagnostic applications or when in-field sequencing is required [10] [71] [72].
Looking forward, the field is moving toward hybrid sequencing approaches, leveraging the strengths of both technologies. One promising strategy is to use Illumina for broad, deep sequencing of large sample cohorts to identify key taxa of interest, followed by Oxford Nanopore sequencing for in-depth, strain-level characterization of those selected targets. This synergistic approach promises a more complete and functionally insightful characterization of the complex gut ecosystem, ultimately accelerating the translation of microbiome research into clinical and therapeutic applications.
The choice between genus-level and species-level taxonomic identification represents a critical decision point in the design of gut microbiome studies using next-generation sequencing (NGS). This technical guide evaluates the capabilities and limitations of major NGS platforms and methodologies—including 16S rRNA amplicon sequencing and shotgun metagenomics—in achieving sufficient resolution for research and drug development. While species-level identification provides crucial insights for clinical applications, significant technical challenges remain in achieving this resolution reliably. This review synthesizes current evidence on methodological performance, detailing standardized protocols and analytical pipelines to guide researchers in selecting appropriate platforms based on their specific resolution requirements. The findings underscore that method selection profoundly influences data interpretation, diagnostic accuracy, and therapeutic development in human microbiome research.
Taxonomic resolution—the level at which microorganisms can be classified—forms the foundation for interpreting microbiome data in research and clinical contexts. The human gut microbiome exhibits tremendous complexity, with differences in microbial composition spanning from phylum to strain levels. While 16S rRNA gene sequencing has served as the workhorse for bacterial identification, its limitations in achieving species-level resolution have become increasingly apparent as researchers investigate finer microbial associations with health and disease [9]. The choice between genus-level and species-level identification carries profound implications for understanding disease mechanisms, identifying biomarkers, and developing targeted therapeutics.
The drive toward species-level identification stems from recognition that closely related microbial species can exert dramatically different effects on host physiology. As noted in recent microbiome research, "different species within the same genus can display substantial variations in pathogenic potential" [73]. This biological reality necessitates methodological approaches capable of discriminating between these functionally distinct taxa. However, achieving this resolution consistently across laboratories and study designs presents significant challenges related to methodology selection, experimental protocols, and bioinformatic analysis.
Within the context of selecting optimal NGS platforms for gut microbiome research, this review examines the technical foundations, performance characteristics, and practical considerations for achieving different levels of taxonomic resolution. By synthesizing evidence from methodological comparisons and multicenter studies, we provide a framework for researchers to match analytical approaches with scientific objectives in drug development and clinical translation.
Technical Foundations of Taxonomic Classification
16S rRNA Gene Sequencing
16S rRNA gene sequencing leverages variations in the bacterial 16S ribosomal RNA gene to classify organisms. The gene contains nine hypervariable regions (V1-V9) flanked by conserved sequences, enabling PCR amplification using universal primers [9]. The selection of which variable region(s) to sequence significantly influences taxonomic resolution:
Partial-length sequencing (e.g., V3-V4, V4-V5) offers practical advantages including reduced costs, higher throughput, and suitability for low-biomass samples [73]. However, it typically provides genus-level resolution with limited ability to distinguish closely related species.
Full-length sequencing of the entire 16S gene (V1-V9) enables higher taxonomic resolution, potentially reaching species-level identification [9] [19]. Recent advances in long-read sequencing technologies have made this approach more accessible.
Two primary analytical approaches dominate 16S rRNA data processing: Operational Taxonomic Units (OTUs) clustered at a fixed sequence similarity threshold (typically 97%), and Amplicon Sequence Variants (ASVs) that distinguish sequences at single-nucleotide resolution [9]. While ASVs offer finer discrimination, both methods ultimately depend on the quality and comprehensiveness of reference databases for taxonomic assignment.
Shotgun Metagenomic Sequencing
Shotgun metagenomic sequencing bypasses PCR amplification of specific marker genes, instead sequencing all DNA fragments in a sample. This approach provides several advantages for taxonomic resolution:
- Species and strain-level identification through alignment of sequencing reads to comprehensive genomic databases [9]
- Functional profiling by identifying microbial genes and metabolic pathways
- Detection of non-bacterial community members including archaea, viruses, and eukaryotes
However, shotgun metagenomics requires substantial sequencing depth to adequately capture low-abundance taxa, particularly in samples with high host DNA contamination [74]. The method also demands significant computational resources and sophisticated bioinformatic pipelines for meaningful data interpretation.
Methodological Performance Comparison
Resolution Capabilities by Methodology
Table 1: Taxonomic Resolution Capabilities of Different Sequencing Approaches
| Methodology | Optimal Taxonomic Resolution | Key Advantages | Key Limitations |
|---|---|---|---|
| 16S rRNA (Partial-Length) | Genus-level | Cost-effective; standardized protocols; suitable for large cohorts | Limited species resolution; primer bias; variable region selection affects results |
| 16S rRNA (Full-Length) | Species-level for some taxa | Improved discrimination over partial-length; identifies more species | Higher cost than partial-length; longer sequencing time |
| Shotgun Metagenomics | Species to strain-level | Comprehensive community profiling; functional potential assessment | High cost; computational intensity; host DNA interference in low-microbial-biomass samples |
| 2bRAD-M | Species-level in high-host-DNA samples | Effective in high-host-DNA contexts; requires minimal sequencing | Newer method with less established protocols; database dependencies |
The resolution limitations of partial-length 16S sequencing were highlighted in a multicenter study comparing metabarcoding approaches, which found "large variations in alpha-diversity between laboratories, uncorrelated with sequencing depth" [19]. This inter-laboratory variability underscores the challenge of obtaining consistent species-level data across different research settings.
For the V3-V4 regions commonly used in gut microbiome studies, the fixed 98.5% similarity threshold typically applied for species-level identification can cause misclassification due to varying divergence rates among species [73]. This has prompted development of more sophisticated classification approaches using flexible thresholds based on specific taxonomic groups.
Quantitative Performance Metrics
Table 2: Performance Metrics for Taxonomic Profiling Methods in High-Host-DNA Contexts
| Method | Host DNA Context | AUPR (Genus) | AUPR (Species) | L2 Similarity (Genus) | L2 Similarity (Species) |
|---|---|---|---|---|---|
| 2bRAD-M | 90% | >93% | >93% | >93% | >93% |
| 2bRAD-M | 99% | High | High | High | High |
| 16S rRNA | 90% | Low | Low | Low | Low |
| 16S rRNA | 99% | Significant false positives | Significant false positives | Diminished | Diminished |
| WMS | 99% | High | High | Reduced | Reduced |
Note: AUPR = Area Under Precision-Recall Curve; L2 Similarity = Abundance Estimation Accuracy; Data adapted from [74]
In direct comparisons, shotgun metagenomic sequencing consistently outperforms 16S rRNA approaches for species-level classification. As noted in a comprehensive review, "16S rRNA sequencing tends to offer less resolution and sensitivity for detecting changes at the species level and cannot detect strain-level changes" [9]. This performance gap is particularly evident when analyzing complex microbial communities like the human gut, where closely related species co-occur.
However, novel methods are emerging to bridge this resolution gap. The 2bRAD-M approach, for instance, demonstrates particular strength in challenging samples with high host DNA content, achieving over 93% in both AUPR and L2 similarity metrics in mock samples with >90% human DNA [74]. This performance advantage highlights how method innovation can expand resolution capabilities in specific experimental contexts.
Experimental Protocols for Optimal Resolution
Sample Collection and DNA Extraction
Standardized sample collection is crucial for reliable taxonomic profiling. The gold standard protocol involves:
- Whole stool collection with immediate homogenization
- Flash freezing in liquid nitrogen or dry ice/ethanol slurry
- Storage at -80°C until processing
- Aliquot preservation in 20% glycerol in Lysogeny Broth for potential culturing [75]
For DNA extraction, the Zymo Research Quick-DNA HMW MagBead Kit has demonstrated superior performance in comparative studies, providing high-quality DNA with minimal degradation and optimal microbial-to-host DNA ratios [51]. The DNA extraction method significantly impacts downstream results, as inefficient lysis of Gram-positive bacteria can lead to their underrepresentation [51]. Bead-beating steps are particularly important for breaking rigid cell walls of certain bacterial species.
Library Preparation and Sequencing
For 16S rRNA sequencing targeting species-level resolution:
- Primer selection should be optimized for the target microbiota. For human gut studies focusing on Firmicutes and Bacteroidetes, the V3-V4 regions are recognized as optimal [73].
- PCR conditions must be carefully controlled to minimize amplification bias.
- Sequencing depth should exceed 40,000 reads per sample to adequately capture diversity [19].
For shotgun metagenomic sequencing:
- DNA fragmentation to approximately 150bp fragments using ultrasonication
- Library preparation using kits such as the Illumina DNA Prep (identified as most effective in comparative studies) [51]
- Sequencing depth of 20 million high-quality reads per sample as a minimum [19]
Bioinformatic Analysis Pipelines
Bioinformatic processing significantly influences taxonomic resolution:
- For 16S rRNA data, the DADA2 pipeline performs well for amplicon-based short-read sequencing, while the minitax tool provides consistent results across platforms [51].
- For shotgun metagenomic data, tools like MetaPhlAn4 and Bracken offer reliable taxonomic profiling at species level [74].
- Database selection critically affects annotation accuracy. Comprehensive databases like GTDB (Genome Taxonomy Database) and SILVA provide improved taxonomic coverage over traditional references [74] [73].
Table 3: Recommended Bioinformatics Tools for Taxonomic Classification
| Tool | Sequencing Type | Optimal Application | Key Features |
|---|---|---|---|
| DADA2 | 16S rRNA (SRS) | Amplicon sequence variant inference | Error correction; single-nucleotide resolution |
| minitax | Multiple platforms | Consistent cross-platform analysis | Reduced variability; versatile application |
| MetaPhlAn4 | Shotgun metagenomics | Species-level profiling | Marker-based approach; fast execution |
| Kraken2 | Shotgun metagenomics | Comprehensive taxonomic assignment | K-mer matching; suitable for WGS reads |
| ASVtax | 16S rRNA (V3-V4) | Species-level identification from partial 16S | Flexible thresholds; gut microbiome-optimized |
A specialized pipeline called ASVtax has been developed specifically for enhancing species-level identification from V3-V4 regions. This approach uses flexible classification thresholds for 674 families, 3,661 genera, and 15,735 species, establishing precise taxonomic boundaries for 896 common human gut species [73]. This represents a significant advancement over fixed-threshold methods that often misclassify taxa with unusual levels of intraspecies diversity.
Experimental Workflow Visualization
The workflow illustrates critical decision points that influence taxonomic resolution outcomes. Sample collection and DNA extraction methods establish the foundation for data quality, while the choice between 16S rRNA sequencing (either partial or full-length) and shotgun metagenomics determines the maximum achievable resolution. Bioinformatic processing represents the final stage where data is transformed into taxonomic classifications, with method selection directly impacting whether genus-level or species-level identification is achieved.
The Scientist's Toolkit: Essential Research Reagents and Materials
Table 4: Essential Research Reagents and Materials for Microbiome Taxonomic Studies
| Item | Specific Product Examples | Function/Application | Performance Notes |
|---|---|---|---|
| DNA Extraction Kit | Zymo Research Quick-DNA HMW MagBead Kit; QIAsymphony DSP Virus/Pathogen Midi Kit | Nucleic acid purification with microbial cell wall disruption | Zymo kit provides high molecular weight DNA optimal for long-read sequencing [51] [19] |
| Library Prep Kit | Illumina DNA Prep; PerkinElmer V1-V3 kit; Zymo Research V1-V2/V3-V4 kits | Sequencing library construction | Illumina DNA Prep shows high effectiveness for microbial diversity analysis [51] |
| Sequencing Platforms | Illumina MiSeq/NextSeq; PacBio Sequel IIe; Oxford Nanopore MinION | DNA sequencing | Short-read platforms dominate for cost-effectiveness; long-read platforms enable full-length 16S sequencing [51] |
| Bioinformatics Tools | minitax; DADA2; MetaPhlAn4; ASVtax; Kraken2 | Taxonomic classification from sequence data | minitax provides consistent results across platforms; ASVtax enables species-level from V3-V4 [51] [73] |
| Reference Databases | SILVA; GTDB; NCBI RefSeq; Greengenes | Taxonomic assignment reference | GTDB offers improved taxonomic coverage over traditional databases [74] [73] |
| Standard Reference | ZymoBIOMICS Microbial Community DNA Standard | Method validation and quality control | Contains 10 microbial species with varying GC content for pipeline validation [19] |
The pursuit of species-level taxonomic resolution in gut microbiome research represents both a technical challenge and a scientific necessity. While 16S rRNA sequencing remains adequate for genus-level profiling and large cohort studies, shotgun metagenomics and emerging methods like 2bRAD-M and full-length 16S sequencing offer superior species-level discrimination essential for understanding disease mechanisms and developing targeted interventions.
The selection of appropriate methodology must balance resolution requirements with practical constraints including budget, sample type, and analytical capabilities. Regardless of the chosen approach, standardization of protocols from sample collection through bioinformatic analysis is crucial for generating reproducible, comparable data across studies. As the field advances toward clinical application, methodological rigor and transparent reporting of limitations will be essential for building robust associations between microbial taxa and human health outcomes.
For drug development professionals and clinical researchers, species-level identification often provides critical insights into mechanism of action, patient stratification biomarkers, and therapeutic monitoring. However, genus-level analysis may suffice for initial exploratory studies or population-level epidemiological investigations. By carefully matching methodological capabilities to research objectives, the scientific community can maximize the translational potential of gut microbiome research while acknowledging current technical limitations.
In gut microbiome research, accurately characterizing microbial communities is fundamental to understanding host health, disease etiology, and therapeutic responses. Alpha and beta diversity metrics serve as the cornerstone for quantifying and comparing these complex microbial ecosystems. Alpha diversity describes the species richness and uniformity within a single sample, providing insights into the intrinsic complexity of an individual's gut microbiota. In contrast, beta diversity measures the compositional differences between microbial communities, enabling researchers to identify shifts associated with disease states, dietary interventions, or other experimental conditions [76].
The accurate measurement of these diversity metrics is highly dependent on the choice of sequencing platform and analytical approach. Different next-generation sequencing (NGS) technologies exhibit varying performance characteristics in terms of resolution, accuracy, and depth, which directly impact downstream diversity calculations and biological interpretations. Within the context of identifying the optimal NGS platform for gut microbiome studies, this technical guide provides a comprehensive comparison of alpha and beta diversity metrics across leading sequencing technologies, supported by experimental data and standardized protocols.
Theoretical Foundations of Diversity Metrics
Alpha Diversity: Within-Sample Complexity
Alpha diversity represents the species richness and evenness within a single microbial community. Commonly employed metrics include:
- Species Richness: The simple count of distinct species present in a sample.
- Shannon-Wiener Index: Quantifies species diversity by considering both richness and evenness, giving more weight to rare species.
- Simpson Index: Measures dominance by emphasizing the abundance of the most common species.
- Pielou's Evenness: Assesses how evenly individuals are distributed among different species [76].
Comparative analysis of alpha diversity must be performed only when sequencing efforts have reached sufficient depth, typically demonstrated by the plateauing of rarefaction curves. This ensures observed differences reflect true biological variation rather than technical artifacts [76].
Beta Diversity: Between-Sample Compositional Differences
Beta diversity quantifies the dissimilarity between microbial communities from different samples. Key metrics include:
- Bray-Curtis Dissimilarity: Based on species abundance data, considering both presence/absence and relative abundances.
- Weighted UniFrac: Incorporates phylogenetic relationships between organisms and their relative abundances.
- Unweighted UniFrac: Focuses on presence/absence data while considering phylogenetic distances [76].
These metrics transform complex microbial community data into measurable distances, enabling statistical testing of hypotheses related to group differences, environmental gradients, or temporal changes.
Platform Performance: Comparative Analysis of NGS Technologies
Multiple sequencing platforms are currently employed in gut microbiome research, each with distinct technological approaches and performance characteristics. Illumina platforms utilize sequencing-by-synthesis (SBS) chemistry, offering high throughput and accuracy (Q30). PacBio Onso employs sequencing-by-binding (SBB) technology, achieving exceptional accuracy (Q40+) with lower sequencing depth requirements. Oxford Nanopore Technologies (ONT) utilizes real-time single-molecule sequencing through protein nanopores, providing long reads ideal for resolving complex genomic regions [77] [18].
Table 1: Technical Specifications of Major NGS Platforms for Microbiome Analysis
| Platform | Technology | Read Length | Accuracy | Key Advantages for Microbiome Studies |
|---|---|---|---|---|
| Illumina NovaSeq 6000 | SBS | Short-read (PE150) | Q30 (≥85%) | High throughput, established workflows, low error rate |
| PacBio Onso | SBB | Short-read | Q40+ (90% of bases) | 15x higher accuracy than SBS, lower depth requirements |
| Oxford Nanopore | Nanopore | Long-read | Not specified in sources | Real-time sequencing, rapidly improving accuracy |
| MGI DNBSEQ-T1+ | DNBSEQ | Mid-throughput | Q40 | 24-hour workflow for PE150 [18] |
Impact of Platform Selection on Diversity Assessments
Platform choice significantly influences diversity metric outcomes due to variations in resolution, error profiles, and data yield. Research comparing ONT, PacBio, and Illumina for gut microbiome analysis demonstrates that long-read platforms (ONT, PacBio) achieve superior species-level annotation rates compared to short-read technologies. At equivalent sequencing depths, ONT demonstrates better saturation characteristics, requiring fewer reads to capture full microbial diversity [78].
In a comparative wastewater surveillance study, the PacBio Onso system detected greater microbial diversity than Illumina NextSeq 2000 across all taxonomic levels, as measured by Shannon's Diversity Index [77]. This enhanced detection capability directly improves the resolution of both alpha and beta diversity analyses, particularly for identifying rare taxa and making finer distinctions between communities.
Table 2: Comparative Performance in Microbial Diversity Studies
| Performance Metric | PacBio Onso | Illumina NextSeq 2000 | ONT | PacBio CCS (conventional) |
|---|---|---|---|---|
| Taxonomic groups identified | Higher at all levels | Lower at all levels | Comparable to PacBio | Lower saturation than ONT |
| Species-level annotation | N/A | N/A | Superior to Illumina | Superior to Illumina |
| Data saturation | N/A | N/A | Reached with fewer reads | Requires more reads |
| AMR gene detection | More ARGs detected | Fewer ARGs detected | N/A | N/A |
Experimental Protocols for Cross-Platform Diversity Analysis
Standardized Sample Processing and Sequencing Workflow
To ensure valid cross-platform comparisons, consistent sample processing from collection through data analysis is essential. The following protocol outlines a standardized approach for gut microbiome studies:
- Sample Collection: Collect fecal samples using standardized kits with stabilizers to preserve microbial DNA integrity. Store immediately at -80°C [79].
- DNA Extraction: Employ automated nucleic acid extraction systems (e.g., Quick-DNA/RNA Water Kit) with mechanical lysis to ensure comprehensive cell disruption across diverse bacterial taxa [77].
- Library Preparation:
- For Illumina: Utilize compatible library prep kits with dual indexing to minimize cross-sample contamination.
- For PacBio Onso: Implement simple library conversion processes compatible with existing short-read workflows [77].
- For ONT: Employ native barcoding kits for multiplexed sequencing on GridION or PromethION platforms.
- Sequencing:
- Illumina: Target 20 million paired-end 150bp reads per sample on NovaSeq 6000 using S4 flow cells [78].
- PacBio Onso: Sequence at 6,000x coverage, leveraging 4-fold lower depth requirements than SBS platforms for equivalent sensitivity [77].
- ONT: Generate approximately 50,000 reads per sample to achieve saturation in gut microbiome diversity capture [78].
Bioinformatic Processing and Diversity Calculation
Bioinformatic Workflow for Diversity Analysis
Quality Control:
ASV/OTU Generation:
- Apply DADA2 for Illumina data to resolve amplicon sequence variants (ASVs).
- For long-read data, employ specific clustering tools optimized for higher error rates (e.g, ONT) or circular consensus sequencing (e.g., PacBio).
Taxonomic Assignment:
- Annotate features against curated 16S databases (e.g., SILVA, Greengenes) for targeted analyses.
- For shotgun metagenomics, use custom databases like Microba's reference genome collection for improved species-level resolution [79].
Diversity Metric Calculation:
- Compute alpha diversity using standardized indices (Shannon, Simpson, Chao1) after rarefying to even sequencing depth.
- Calculate beta diversity employing Bray-Curtis, weighted/unweighted UniFrac distances based on experimental question.
- Conduct statistical tests (PERMANOVA for beta diversity; Kruskal-Wallis for alpha diversity) to assess significance of observed differences.
Case Study: Multi-Platform Comparison in Gut Microbiome Research
Experimental Design and Methodology
A comprehensive comparison of ONT, PacBio, and Illumina platforms was conducted using identical human fecal samples to directly assess their impact on diversity metrics [78]. The experimental design included:
- Sample Preparation: DNA extracted from a single homogenized fecal sample aliquoted for all platforms to eliminate biological variability.
- Sequencing Parameters:
- ONT: 50,000 reads per sample
- PacBio: 30,000 circular consensus sequences (CCS)
- Illumina: 200,000 tags (exceeding standard 50,000 tag protocols)
- Data Analysis: Uniform bioinformatic processing with platform-specific optimizations followed by identical diversity metric calculations.
Results and Interpretation
Alpha Diversity Findings: ONT demonstrated superior data saturation characteristics compared to PacBio, with 40,000 reads sufficient to capture full diversity versus PacBio's requirement for more than 50,000 CCS reads. Both long-read platforms (ONT, PacBio) showed significantly higher species-level annotation rates compared to Illumina, resolving taxonomic assignments that Illumina classified as "unclassified" [78].
Beta Diversity Insights: While all platforms correctly identified major sample groupings in PCoA plots, long-read technologies provided enhanced resolution of closely related samples. Weighted UniFrac distances calculated from ONT and PacBio data revealed subtle compositional differences obscured by Illumina's higher error rate in species-level assignments [78] [77].
Essential Research Reagents and Computational Tools
Table 3: Research Reagent Solutions for Cross-Platform Diversity Studies
| Category | Product/Platform | Application in Diversity Studies | Key Features |
|---|---|---|---|
| DNA Extraction | Quick-DNA/RNA Water Kit (Zymo) | Standardized nucleic acid isolation from fecal samples | Effective lysis across diverse bacterial taxa; compatible with all major platforms [77] |
| Library Prep | Illumina DNA Prep | Library construction for Illumina platforms | High reproducibility for accurate diversity comparisons |
| Library Prep | SBB Library Prep Kit (PacBio) | Library construction for Onso platform | Maintains Q40+ accuracy for improved variant detection [77] |
| Sequencing | NovaSeq 6000 (Illumina) | High-throughput microbiome sequencing | S4 flow cells; PE150 configuration; Q30 ≥ 85% [81] |
| Sequencing | Onso (PacBio) | High-accuracy microbiome sequencing | Q40+ accuracy; lower depth requirements [77] |
| Data Analysis | Cutadapt | Adapter trimming and quality control | Flexible parameter setting for diverse data types [80] |
| Data Analysis | QIIME 2 | Comprehensive diversity analysis | Integrates multiple diversity metrics and statistical comparisons |
| Data Analysis | Microba's Custom Pipeline | Species-level annotation for shotgun data | Custom reference database for improved resolution [79] |
The choice of NGS platform significantly influences alpha and beta diversity outcomes in gut microbiome research. For studies prioritizing species-level resolution and accurate strain discrimination, long-read technologies (ONT, PacBio) demonstrate clear advantages over Illumina short-read platforms. PacBio's exceptional accuracy (Q40+) provides enhanced sensitivity for detecting rare variants and low-abundance taxa with reduced sequencing depth requirements. ONT offers favorable data saturation characteristics, capturing comprehensive diversity with fewer reads than comparable technologies.
For large-scale epidemiological studies requiring high throughput and cost-effectiveness, Illumina remains a robust choice, particularly when analysis focuses on genus-level compositional changes rather than species-level discrimination. Emerging platforms like MGI's DNBSEQ-T1+ with Q40 accuracy present promising alternatives as the competitive landscape evolves [18].
Future directions in gut microbiome diversity analysis will likely involve hybrid sequencing approaches, combining short-read accuracy with long-read resolution for complete community characterization, alongside improved reference databases and standardized analytical frameworks to enhance cross-study comparability.
Platform Selection Decision Tree
Analyzing Cost, Throughput, and Scalability for Large Cohort Studies
Next-generation sequencing (NGS) has revolutionized gut microbiome research, enabling unprecedented exploration of microbial communities' role in human health and disease. For large cohort studies—which are essential for robust statistical power, understanding population-level variations, and identifying biomarkers—selecting the appropriate sequencing platform is a critical decision that directly impacts research costs, data quality, and analytical outcomes [82] [83]. The fundamental challenge lies in balancing three competing factors: cost-efficiency for processing hundreds or thousands of samples, throughput to generate sufficient data within feasible timelines, and data quality necessary for meaningful biological insights. This technical guide provides a structured framework for researchers to evaluate NGS platforms against the specific demands of large-scale gut microbiome studies, with a focus on practical implementation and strategic decision-making.
The evolution of sequencing technologies has been remarkable, with costs plummeting from billions of dollars per genome during the Human Genome Project to potentially under $100 today [84] [85]. This cost reduction, coupled with massive improvements in throughput, has made large-cohort studies financially feasible. However, not all sequencing data are equivalent; different platforms exhibit distinct error profiles, read lengths, and limitations in genomic coverage that significantly influence their suitability for microbiome applications [82] [86]. Furthermore, the total cost of ownership extends beyond mere sequencing costs to include library preparation, bioinformatics analysis, data storage, and computational resources [84]. This guide synthesizes current technical specifications, performance metrics, and experimental considerations to inform platform selection for scalable, cost-effective microbiome research.
Comparative Analysis of NGS Platforms
Sequencing platforms are broadly categorized by read length and underlying biochemistry. Second-generation sequencing (SGS), or short-read sequencing, is characterized by high accuracy (exceeding 99.5%) and massive parallelization but produces reads typically between 50-600 base pairs [85]. This category is dominated by Illumina's Sequencing by Synthesis (SBS) technology, which utilizes fluorescently-labeled reversible terminators, and MGI's DNBSEQ platforms [86] [87]. While highly accurate for detecting single nucleotide variants, short reads struggle to resolve repetitive regions and complex structural variations, and cannot unambiguously link distant genomic features on the same molecule—a significant limitation for microbiome studies aiming to reconstruct complete genomes or associate specific genes with their host organisms [86].
Third-generation sequencing (TGS), or long-read sequencing, addresses these limitations by generating reads thousands to millions of base pairs long [86]. Pacific Biosciences (PacBio) employs Single Molecule Real-Time (SMRT) sequencing, where nucleotide incorporation is observed in real-time within nanoscale wells called zero-mode waveguides (ZMWs) [82]. Oxford Nanopore Technologies (ONT) detects changes in electrical current as DNA strands pass through protein nanopores [82] [86]. While historically burdened by higher error rates (5-20% for TGS versus ~1% for SGS), recent advancements like PacBio's HiFi (High Fidelity) reads achieve accuracy exceeding 99.9% by circularly consensus sequencing the same molecule multiple times [83]. This combination of long reads and high accuracy is particularly transformative for microbiome research, enabling complete metagenome-assembled genomes (MAGs) and precise taxonomic classification at strain level [83] [88].
Table 1: Technical Specifications of Major Sequencing Platforms
| Platform | Technology | Read Length | Accuracy | Key Strengths | Primary Limitations |
|---|---|---|---|---|---|
| Illumina NovaSeq 6000 [86] [87] | Sequencing by Synthesis (SBS) | 36-300 bp | >99.5% (per base) | Extremely high throughput, low per-base cost, established protocols | Short reads struggle with repetitive regions and phasing |
| MGI DNBSEQ-T7 [86] [87] | DNA Nanoball Sequencing by Ligation | 50-150 bp | High (comparable to Illumina) | Lower cost per run, reduced GC bias | Short reads, requires multiple PCR cycles |
| PacBio Sequel/Revio [82] | Single Molecule Real-Time (SMRT) Sequencing | Average 10,000-25,000 bp | >99.9% (HiFi mode) | Very long reads, high consensus accuracy, detects epigenetics | Higher instrument and reagent costs, lower throughput than short-read |
| Oxford Nanopore [82] [86] | Nanopore Sensing (Electrical Detection) | Average 10,000-30,000 bp | ~85-98% (varies with kit) | Longest reads, real-time analysis, portable options | Higher indel error rates, particularly in homopolymers |
Quantitative Comparison: Cost, Throughput, and Scalability
For large cohort studies, understanding the relationship between cost, throughput, and data quality is paramount. Cost structures have evolved dramatically, with whole-genome sequencing costs dropping from billions to potentially under $100-$500 per genome, outpacing Moore's Law for over a decade [84] [83]. In 2024, Illumina claimed whole genome sequencing for approximately $200, while startup Ultima Genomics announced an $80-$100 genome with their UG100 platform, which uses a novel, cheaper chemical process [84]. These platforms achieve remarkable throughput; the Ultima UG100 with Solaris offers 10-12 billion reads per wafer, theoretically enabling 30,000 genomes per year [84]. Similarly, Roche's newest machines can sequence seven human genomes at 30x depth per hour, creating unprecedented data generation capabilities [84].
However, these headline figures often represent human whole-genome sequencing and must be contextualized for microbiome shotgun metagenomics, where sequencing depth, sample multiplexing, and library preparation complexity significantly influence costs. While short-read platforms like Illumina and MGI offer the lowest cost per gigabase, long-read technologies provide superior genomic resolution. PacBio's HiFi sequencing, now achievable for approximately $500 per genome, offers a balanced solution with both accuracy and long reads [83]. The critical consideration for large studies is that decreasing sequencing costs do not necessarily reduce associated expenses for data management, storage, and analysis—which can become the dominant cost factor at scale [84].
Table 2: Cost and Throughput Considerations for Large Cohort Studies
| Platform | Approximate Cost per Genome | Typical Output per Run | Time per Run | Scalability for Large Cohorts | Data Analysis Burden |
|---|---|---|---|---|---|
| Illumina NovaSeq 6000 | ~$200 (WGS) [84] | Up to 6 Tb (20B reads) [85] | 1-3 days | Excellent: Extremely high throughput supports thousands of samples | High for assembly, moderate for variant calling |
| MGI DNBSEQ-T7 | Lower than Illumina (platform-specific) [86] | Comparable to NovaSeq | 1-3 days | Excellent: High-throughput capabilities similar to Illumina | Similar to Illumina platforms |
| PacBio HiFi | ~$500 (WGS) [83] | Varies by instrument (0.5-6 Tb) | 0.5-2 days | Good: Improving throughput with Revio system; ideal for subset deep-dive | Lower for assembly, higher for initial data processing |
| Oxford Nanopore | Variable by flow cell | PromethION: 100-200 Gb per flow cell | Real-time (hours to days) | Flexible: Scalable from portable to high-throughput | High due to basecalling requirements, real-time analysis possible |
Experimental Design for Large Cohort Microbiome Studies
Sample Preparation and Library Construction
Robust experimental design begins with standardized sample collection and DNA extraction protocols to minimize technical variability, which is particularly crucial when comparing across large sample sets. For gut microbiome studies, this typically involves collecting fecal samples using standardized kits, immediate freezing at -80°C, and using DNA extraction methods that efficiently lyse both Gram-positive and Gram-negative bacteria. The selection of library preparation approach directly impacts downstream sequencing compatibility and data quality.
For short-read platforms (Illumina, MGI), library preparation involves fragmenting DNA (via sonication or enzymatic digestion), followed by end-repair, A-tailing, and adapter ligation [85]. These libraries are typically amplified via PCR to generate sufficient material for sequencing, though PCR-free protocols are available to eliminate amplification biases. The relatively straightforward protocol and availability of automated systems make short-read library preparation highly scalable for thousands of samples, with costs as low as $10-20 per sample in high-throughput settings.
For long-read platforms, library preparation differs significantly. PacBio SMRTbell library preparation involves DNA repair, end-repair/A-tailing, and ligation of hairpin adapters to create circular templates suitable for continuous sequencing [82]. ONT library prep typically involves tagmentation or ligation-based approaches with native DNA, requiring minimal amplification and preserving epigenetic modifications [82]. While historically more challenging and expensive, recent innovations like the PacBio Onso system (utilizing sequencing by binding chemistry) and ONT's rapid kits have simplified workflows and reduced input requirements [82].
Microbiome Sequencing Workflow Comparison
Sequencing Strategy and Data Analysis Considerations
Choosing an appropriate sequencing strategy requires balancing depth, breadth, and resolution. For large cohort studies aiming to characterize microbial community composition, shallow shotgun sequencing (1-5 million reads per sample) provides cost-effective taxonomic and functional profiling across thousands of samples [83]. For studies requiring metagenome-assembled genomes (MAGs) or strain-level resolution, deeper sequencing (10-30 million reads per sample) with long-read technologies is advantageous.
A hybrid approach increasingly proves optimal for large studies: using high-throughput short-read sequencing for the entire cohort to identify associations, followed by deep long-read sequencing on strategic subsets (cases/controls, extreme phenotypes) for mechanistic insights. This approach leverages the scalability of short-read platforms while harnessing the resolution of long-read technologies where it provides maximum scientific value [86] [83].
Data analysis workflows differ substantially between platforms. Short-read analysis typically involves quality trimming (using tools like Trimmomatic or FastQC), removal of host DNA (using KneadData or BMTagger), taxonomic profiling (with MetaPhlAn or Kraken), functional profiling (HUMAnN), and assembly (MEGAHIT or metaSPAdes) [89] [85]. Long-read analysis requires specialized tools for basecalling (Guppy for ONT), circular consensus sequencing processing (ccs for PacBio), and assembly (Flye, Canu), but enables more complete MAG reconstruction and eliminates the need for complex metagenome assembly graphs [86] [88].
Platform Selection Framework for Specific Research Objectives
Decision Matrix for Common Microbiome Study Designs
The optimal platform choice depends heavily on study objectives, sample size, and budget constraints. The following decision matrix provides guidance for common scenarios in large-cohort microbiome research:
Table 3: Platform Selection Guide by Research Objective
| Research Objective | Recommended Approach | Rationale | Typical Coverage/Sample | Cost Optimization Strategy |
|---|---|---|---|---|
| Population-level diversity & association studies [83] | Illumina/MGI short-read shotgun | Cost-effective profiling of thousands of samples; sufficient for taxonomic and functional inferences | 2-5 million reads | Multiplex hundreds of samples per lane; use shallow sequencing |
| High-quality MAG generation [88] | PacBio HiFi or ONT Ultra-long | Long reads span repetitive regions, enabling complete chromosome assembly | 10-20 Gb per sample (varies by complexity) | Sequence deeply but on subset of samples; hybrid assembly with short reads |
| Strain-level tracking & transmission [88] | PacBio HiFi | High accuracy enables single nucleotide variant calling between strains | 10-15 Gb per sample | Use linked-read technologies or sequence informative subsets |
| Real-time pathogen detection/characterization | Oxford Nanopore | Portable, rapid turnaround; minimal sample prep | Variable by application | Use smaller flow cells for rapid results; minimal basecalling |
| Complex biomarker discovery [83] | Hybrid: Short-read (cohort) + Long-read (subset) | Combines statistical power of large N with resolution for mechanistic insights | Short: 3-5M reads; Long: 10+Gb | Strategic use of each technology; prioritize long reads for extreme phenotypes |
Implementation Protocols for Scalable Microbiome Sequencing
Protocol 1: High-Throughput Short-Read Metagenomic Sequencing This protocol is optimized for processing hundreds to thousands of samples in large cohort studies:
- Sample Preparation: Use automated DNA extraction systems (e.g., KingFisher, QIAcube) with bead-beating for consistent cell lysis across diverse microbial taxa.
- Quality Control: Quantify DNA using fluorometric methods (Qubit) and assess quality via fragment analyzer; establish minimum quality thresholds for inclusion.
- Library Preparation: Utilize automated liquid handling systems with tagmentation-based library prep kits (e.g., Illumina DNA Prep) to minimize hands-on time and variability.
- Normalization and Pooling: Precisely normalize libraries using quantitative PCR or fluorometry before pooling to ensure balanced representation.
- Sequencing: Run on high-throughput platforms (NovaSeq 6000, DNBSEQ-T7) with appropriate read length (2×150 bp) and depth (3-5 million read pairs per sample).
- Quality Assessment: Monitor sequencing metrics including cluster density, Q30 scores, and sample-wise yield throughout the run.
Protocol 2: Hybrid Approach for Deep Microbiome Characterization This protocol combines the strengths of short and long-read technologies:
- Cohort-wide Screening: Process all samples using Protocol 1 to identify associations and stratify samples.
- Sample Selection: Choose informative subsets (e.g., case-control pairs, temporal series, extreme phenotypes) for deep sequencing.
- Long-read Library Preparation: Extract high molecular weight DNA (>20 kb) using gentle protocols. For PacBio: Prepare SMRTbell libraries with size selection >10 kb. For ONT: Prepare libraries using ligation kits with minimal fragmentation.
- Deep Sequencing: Sequence selected samples to high coverage (>20 Gb per sample) using PacBio HiFi or ONT PromethION.
- Integrated Analysis: Combine short and long-read data for hybrid assembly, using short reads for polishing and long reads for scaffolding.
Essential Research Reagents and Computational Tools
Successful implementation of large-scale microbiome studies requires careful selection of reagents and computational resources. The following toolkit represents essential components for ensuring reproducible, high-quality results:
Table 4: Research Reagent Solutions for Microbiome Sequencing
| Category | Specific Products/Kits | Key Function | Considerations for Large Studies |
|---|---|---|---|
| DNA Extraction | QIAamp PowerFecal Pro, MagAttract PowerSoil DNA Kit, DNeasy 96 | Microbial cell lysis and DNA purification | Compatibility with automation, yield consistency, representation of Gram-positive bacteria |
| Library Preparation (Short-read) | Illumina DNA Prep, Nextera XT, KAPA HyperPlus | Fragmentation, adapter ligation, index addition | Cost per sample, hands-on time, compatibility with automation, success with low-input samples |
| Library Preparation (Long-read) | SMRTbell Express, Ligation Sequencing Kit | Create sequencing-ready libraries from long DNA fragments | Input DNA requirements, fragment size distribution, minimization of shearing |
| Quality Control | Qubit dsDNA HS, Fragment Analyzer, TapeStation, Qubit | Quantification and quality assessment of input DNA and final libraries | Throughput, sensitivity, cost per sample, integration with laboratory information management systems |
| Automation | Hamilton Star, Echo 525, QIAcube | Liquid handling for library prep and normalization | Walk-away time, cross-contamination prevention, reproducibility across plates and batches |
Future Directions and Strategic Recommendations
The field of microbiome sequencing continues to evolve rapidly, with several trends particularly relevant for large cohort studies. Continuous cost reduction is expected to persist, with the $100 genome becoming increasingly accessible and potentially dropping further [84]. This will enable even larger sample sizes or deeper sequencing at fixed budgets. Long-read technologies are progressively addressing their historical limitations, with both PacBio and ONT making significant strides in improving accuracy, throughput, and cost-effectiveness [82] [83]. The emergence of multimodal sequencing approaches that simultaneously capture genome sequence, methylation, and chromatin structure will provide unprecedented insights into microbial function and host-microbe interactions [82].
Based on current technology trajectories and the analysis presented in this guide, the following strategic recommendations emerge for researchers planning large cohort microbiome studies:
Prioritize Data Quality Over Lowest Cost: While tempting to minimize per-sample sequencing costs, insufficient data quality or depth will compromise study conclusions. Allocate budget for appropriate sequencing depth and quality control measures.
Adopt a Hybrid Sequencing Strategy: For cohorts exceeding 500-1000 samples, implement a tiered approach using high-throughput short-read sequencing for the entire cohort complemented by targeted long-read sequencing for biologically informative subsets.
Budget for Data Management and Analysis: Computational costs frequently exceed sequencing expenses in large studies. Allocate appropriate resources for data storage, transfer, and analysis infrastructure at the project planning stage.
Implement Robust Laboratory Information Management Systems (LIMS): Sample tracking, batch effects, and metadata management become critical with increasing sample numbers. Implement LIMS before sample processing begins.
Plan for Data Integration and Meta-analysis: Design studies with compatible protocols and metadata standards to enable future integration with other datasets, maximizing the value of generated data.
As sequencing technologies continue their rapid advancement, the feasibility and resolution of large-scale microbiome studies will further improve. However, the fundamental principles outlined in this guide—matching technology capabilities to research questions, implementing robust and scalable protocols, and anticipating computational needs—will remain essential for generating impactful insights from gut microbiome research in large human cohorts.
Conclusion
The choice of an NGS platform for gut microbiome studies is not one-size-fits-all but must be strategically aligned with the research question. Illumina platforms, with their high accuracy and throughput, remain the gold standard for large-scale, genus-level profiling and broad microbial surveys. In contrast, Oxford Nanopore's long-read technology provides unparalleled species-level resolution and real-time sequencing capabilities, ideal for identifying specific pathogens or resolving complex genomic regions. As the field progresses, future directions will likely involve hybrid sequencing approaches that leverage the strengths of both technologies. Furthermore, the integration of advanced bioinformatic pipelines and cloud-based analysis platforms will be crucial for translating complex sequencing data into actionable biological insights, ultimately accelerating the development of microbiome-based diagnostics and therapeutics in clinical and pharmaceutical research.
References
- 1. Gene 16 . S rRNA Sequencing vs Shotgun Metagenomic Sequencing [https://blog.microbiomeinsights.com/16s-rrna-sequencing-vs-shotgun-metagenomic-sequencing]
- 2. Human Microbiome Analysis | Profile microbial ... [https://www.illumina.com/areas-of-interest/microbiology/human-microbiome-analysis.html]
- 3. for... - CD Genomics 16 S rRNA Sequencing VS Shotgun Sequencing [https://www.cd-genomics.com/microbioseq/resource-16s-rrna-sequencing-vs-shotgun-sequencing-for-microbial-research]
- 4. Advantages and Limitations of 16S rRNA Next-Generation ... [https://pmc.ncbi.nlm.nih.gov/articles/PMC7602188/]
- 5. Comparison between 16S rRNA and shotgun sequencing in ... [https://bmcgenomics.biomedcentral.com/articles/10.1186/s12864-024-10621-7]
- 6. Prospective Comparison Between Shotgun and... Metagenomics [https://pmc.ncbi.nlm.nih.gov/articles/PMC9020828/]
- 7. Comparison between 16S rRNA and shotgun sequencing ... [https://www.nature.com/articles/s41598-021-82726-y]
- 8. Next-Generation Sequencing in Microbiome Research – A Practical... [https://blog.invitek.com/articles/microbiome/next-generation-sequencing-in-microbiome-research-a-practical-guide]
- 9. Next-generation sequencing: insights to advance clinical ... [https://pmc.ncbi.nlm.nih.gov/articles/PMC8970668/]
- 10. Comparative analysis of illumina and oxford nanopore ... [https://www.nature.com/articles/s41598-025-18768-3]
- 11. A comparison of sequencing platforms and bioinformatics pipelines... [https://bmcmicrobiol.biomedcentral.com/articles/10.1186/s12866-017-1101-8]
- 12. Comparative evaluation of sequencing platforms [https://pmc.ncbi.nlm.nih.gov/articles/PMC12365774/]
- 13. Healthy human gut : Towards standardized research microbiome [https://www.aimspress.com/article/id/69113f3dba35de34708add6d]
- 14. Targeted NGS For Human Microbiome Research [https://www.thermofisher.com/us/en/home/global/forms/life-science/targeted-ngs-microbiome.html]
- 15. 10 Leading Cancer Microbiome Sequencing Companies ... [https://www.researchandmarkets.com/articles/key-companies-in-cancer-microbiome-sequencing?srsltid=AfmBOopsV1fo5Nl-s2xchsQUyZq4VRrmeV3uSsdR81SiLL4rI_ITKyEF]
- 16. Comparative analysis of Illumina, PacBio, and nanopore ... [https://www.frontiersin.org/journals/microbiomes/articles/10.3389/frmbi.2025.1587712/full]
- 17. Next Generation Sequencing Platform: Ultimate Guide 2025 [https://lifebit.ai/blog/next-generation-sequencing-platform/]
- 18. The Best of NGS: Instrument Companies to Watch in 2025 [https://www.genengnews.com/topics/omics/the-best-of-ngs-instrument-companies-to-watch-in-2025/]
- 19. Multicenter evaluation of gut microbiome profiling by next- ... [https://www.nature.com/articles/s41598-023-46062-7]
- 20. US NGS Market Forecast and Company Analysis Report ... [https://finance.yahoo.com/news/us-ngs-market-forecast-company-112700116.html]
- 21. Next Generation Sequencing Market Size 2025 to 2034 [https://www.precedenceresearch.com/next-generation-sequencing-market]
- 22. Ranking the biases: The choice of OTUs vs. ASVs in 16S ... [https://pmc.ncbi.nlm.nih.gov/articles/PMC8870492/]
- 23. Microbiome Informatics: OTU vs. ASV [https://www.zymoresearch.com/blogs/blog/microbiome-informatics-otu-vs-asv?srsltid=AfmBOoo6ELTfyHc4TvSTmtNKwTXvtKFhNuTPCW9bN2c1hLq7BCral51a]
- 24. ASV vs OTUs clustering: Effects on alpha, beta, and gamma ... [https://journals.plos.org/plosone/article?id=10.1371/journal.pone.0309065]
- 25. Gut microbiome metagenomics in clinical practice [https://pmc.ncbi.nlm.nih.gov/articles/PMC12562794/]
- 26. Pruning the Tree: Comparing OTUs and ASVs in High ... [https://pmc.ncbi.nlm.nih.gov/articles/PMC12502049/]
- 27. Benchmarking second and third-generation sequencing ... [https://www.nature.com/articles/s41597-022-01762-z]
- 28. Comparative evaluation of sequencing technologies and ... [https://pmc.ncbi.nlm.nih.gov/articles/PMC12130029/]
- 29. 16S Sequencing vs Shotgun Metagenomic Sequencing [https://www.zymoresearch.com/blogs/blog/16s-sequencing-vs-shotgun-metagenomic-sequencing?srsltid=AfmBOoobMEAzToX3S0uGmC4d-quNCB3TjloOp6PwXgmISlA_TkPe-qRP]
- 30. Quick-16S NGS Library Prep Kit [https://www.zymoresearch.com/products/quick-16s-ngs-library-prep-kit?srsltid=AfmBOorsxkrxdnMIltzveV9uBKqJioncQuqiu3hwpLFGx--h08jZBW34]
- 31. Library Preparation for Shotgun Metagenomic and Single ... [https://bio-protocol.org/exchange/minidetail?id=9891584&type=30]
- 32. From Gut to Growth: The Rise of Microbiome Sequencing [https://blog.bccresearch.com/from-gut-to-growth-the-rise-of-microbiome-sequencing]
- 33. Why Are Long-Read Sequencing Methods Revolutionizing ... [https://www.mdpi.com/2076-2607/13/8/1861]
- 34. Comparison of the performance of MiSeq and NovaSeq in oral ... [https://pmc.ncbi.nlm.nih.gov/articles/PMC11028001/]
- 35. Sequencing Quality Scores [https://www.illumina.com/science/technology/next-generation-sequencing/plan-experiments/quality-scores.html]
- 36. XLEAP-SBS chemistry enables Q40 and above data ... [https://www.illumina.com/science/genomics-research/articles/data-quality-q-scores.html]
- 37. PromethION [https://nanoporetech.com/products/sequence/promethion-24-48]
- 38. Nanopore Sequencing – PromethION | DNA Technologies Core [https://dnatech.ucdavis.edu/nanopore-sequencing-promethion]
- 39. PromethION 24/48 A-Series IT requirements [https://nanoporetech.com/document/requirements/promethion-it-reqs]
- 40. Microbiome Sequencing Service Market Analysis & Forecast [https://www.coherentmarketinsights.com/industry-reports/microbiome-sequencing-service-market]
- 41. nf-core/ampliseq: a versatile, comprehensive, and ... [https://forum.qiime2.org/t/nf-core-ampliseq-a-versatile-comprehensive-and-reproducible-amplicon-sequencing-analysis-pipeline/22019]
- 42. ampliseq: Output [https://nf-co.re/ampliseq/1.1.3/docs/output]
- 43. ampliseq: Introduction [https://nf-co.re/ampliseq/2.3.2/]
- 44. QIIME2 enhances multi-amplicon sequencing data analysis [https://pubmed.ncbi.nlm.nih.gov/40711419/]
- 45. ampliseq: Usage [https://nf-co.re/ampliseq/dev/docs/usage]
- 46. ampliseq: Parameters [https://nf-co.re/ampliseq/latest/parameters]
- 47. ampliseq: Usage [https://nf-co.re/ampliseq/1.1.0/docs/usage]
- 48. ampliseq: Releases [https://nf-co.re/ampliseq/releases_stats/]
- 49. HiOmics: A cloud-based one-stop platform for the ... [https://www.sciencedirect.com/science/article/pii/S2001037024000023]
- 50. A comparison of sequencing platforms and bioinformatics ... [https://pmc.ncbi.nlm.nih.gov/articles/PMC5598039/]
- 51. Cross-comparison of gut metagenomic profiling strategies [https://www.nature.com/articles/s42003-024-07158-6]
- 52. Multi-omic integration of microbiome data for identifying ... [https://www.nature.com/articles/s41467-024-46888-3]
- 53. Comparative Meta-Analysis of Long-Read and Short ... [https://www.mdpi.com/2076-2607/13/10/2366]
- 54. Implications of Error-Prone Long-Read Whole-Genome ... [https://www.sciencedirect.com/science/article/pii/S2589004220304089]
- 55. Error Rate of PacBio vs Nanopore: How Accurate Are Long ... [https://www.cd-genomics.com/blog/pacbio-nanopore-error-rate-correction-strategies/]
- 56. Oxford nanopore long-read sequencing enables the ... [https://pmc.ncbi.nlm.nih.gov/articles/PMC10225699/]
- 57. Measuring and mitigating PCR bias in microbiota datasets [https://pmc.ncbi.nlm.nih.gov/articles/PMC8284789/]
- 58. Biased 16S rDNA PCR amplification caused by ... [https://www.sciencedirect.com/science/article/abs/pii/S0168649698000312]
- 59. Correcting PCR amplification errors in unique molecular ... [https://www.nature.com/articles/s41592-024-02168-y]
- 60. Next-Generation Sequencing (NGS): Platforms and ... [https://pmc.ncbi.nlm.nih.gov/articles/PMC11001031/]
- 61. Applications of NGS [https://www.illumina.com/science/technology/next-generation-sequencing/beginners/applications.html]
- 62. Next Generation Sequencing Improves Diagnostic 16S ... [https://pmc.ncbi.nlm.nih.gov/articles/PMC12418051/]
- 63. Guidelines for preventing and reporting contamination in ... [https://pubmed.ncbi.nlm.nih.gov/40542287/]
- 64. De novo identification of microbial contaminants in low ... [https://www.nature.com/articles/s41467-022-34409-z]
- 65. Comparative evaluation of sequencing platforms: Pacific ... [https://www.frontiersin.org/journals/microbiology/articles/10.3389/fmicb.2025.1633360/full]
- 66. De-biasing microbiome sequencing data: bacterial ... [https://microbiomejournal.biomedcentral.com/articles/10.1186/s40168-024-01998-4]
- 67. How-to: NGS Quality Control [https://frontlinegenomics.com/how-to-ngs-quality-control/]
- 68. On the optimal trimming of high-throughput mRNA ... [https://pmc.ncbi.nlm.nih.gov/articles/PMC3908319/]
- 69. User guide — Cutadapt 5.2 documentation - Read the Docs [https://cutadapt.readthedocs.io/en/stable/guide.html]
- 70. A Primer on NGS Technologies and Their Specs (2025) [https://blog.latch.bio/p/a-primer-on-ngs-technologies-and]
- 71. Science unlocked: publication picks from August 2025 [https://nanoporetech.com/blog/science-unlocked-publication-picks-from-august-2025]
- 72. Science unlocked: publication picks from May 2025 [https://nanoporetech.com/blog/science-unlocked-publication-picks-from-may-2025]
- 73. A species-level identification pipeline for human gut ... [https://www.frontiersin.org/journals/microbiology/articles/10.3389/fmicb.2025.1553124/full]
- 74. High-resolution microbiome analysis of host-rich samples ... [https://www.nature.com/articles/s41522-025-00851-2]
- 75. Microbiome 101: Studying, Analyzing, and Interpreting Gut ... [https://pmc.ncbi.nlm.nih.gov/articles/PMC6391518/]
- 76. Alpha多样性Beta多样性原创 [https://blog.csdn.net/weixin_47464737/article/details/129369139]
- 77. 新一代测序(NGS)技术平台的别样选择 [https://www.ebiotrade.com/newsf/2025-2/202521195736174.htm]
- 78. ONT-全长16S专题| 研发结果之肠道菌群篇 [https://m.10100.com/article/27480015]
- 79. NGS揭示微生物的神秘世界-进化树_Illumina中国官网 [https://www.illumina.com.cn/science/customer-stories/icommunity-customer-interviews-case-studies/hugenholtz-microba-interview-microbiome-novaseq.html]
- 80. 都2025年了,谁还不会下一代测序(NGS)数据质控(四) 原创 [https://blog.csdn.net/weshengxin/article/details/144598387]
- 81. 蛋白组学等!北京发布2025年生物样本库建设技术攻关项目 [http://www.yinzhisci.com/industry/1888.html]
- 82. Next-Generation Sequencing Technology: Current Trends ... [https://pmc.ncbi.nlm.nih.gov/articles/PMC10376292/]
- 83. Biobanks to reach 15% coverage in five nations by 2025 [https://www.drugdiscoverytrends.com/genomics-in-2025-how-500-whole-genome-sequencing-could-democratize-genomic-data/]
- 84. The $100 Genome: Where's the Limit? [https://frontlinegenomics.com/the-100-genome-wheres-the-limit/]
- 85. Next-generation sequencing: 2025 Revolution [https://lifebit.ai/blog/next-generation-sequencing/]
- 86. A practical comparison of the next-generation sequencing ... [https://www.life-science-alliance.org/content/6/4/e202201744]
- 87. A practical comparison of the next-generation sequencing ... [https://pmc.ncbi.nlm.nih.gov/articles/PMC9902641/]
- 88. 2025 Microbiome SMRT Grant Awardees [https://www.pacb.com/blog/2025-microbiome-smrt-grant-awardees/]
- 89. Comparing FASTA and FASTQ Sequence Formats [https://sequenceserver.com/blog/fasta-vs-fastq-formats/]