Full-Length vs. Partial 16S rRNA Sequencing: A Comprehensive Guide for Microbial Research and Diagnostics
This article provides a definitive comparison between full-length and partial 16S rRNA gene sequencing for researchers and drug development professionals.
Full-Length vs. Partial 16S rRNA Sequencing: A Comprehensive Guide for Microbial Research and Diagnostics
Abstract
This article provides a definitive comparison between full-length and partial 16S rRNA gene sequencing for researchers and drug development professionals. It explores the foundational principles of the 16S rRNA gene and its variable regions, detailing how third-generation long-read sequencing technologies from PacBio and Oxford Nanopore are overcoming the limitations of short-read platforms. The content delivers actionable methodological protocols, addresses critical troubleshooting and optimization points such as primer selection and PCR bias, and presents rigorous validation data from mock communities and human microbiome samples. Synthesizing current evidence, this guide concludes that full-length sequencing offers superior species-level resolution, which is crucial for discovering biomarkers and developing targeted therapies, while also providing pragmatic advice on when partial sequencing remains a viable option.
The 16S rRNA Gene: Unlocking Taxonomic Resolution from Variable Regions to Full-Length Sequences
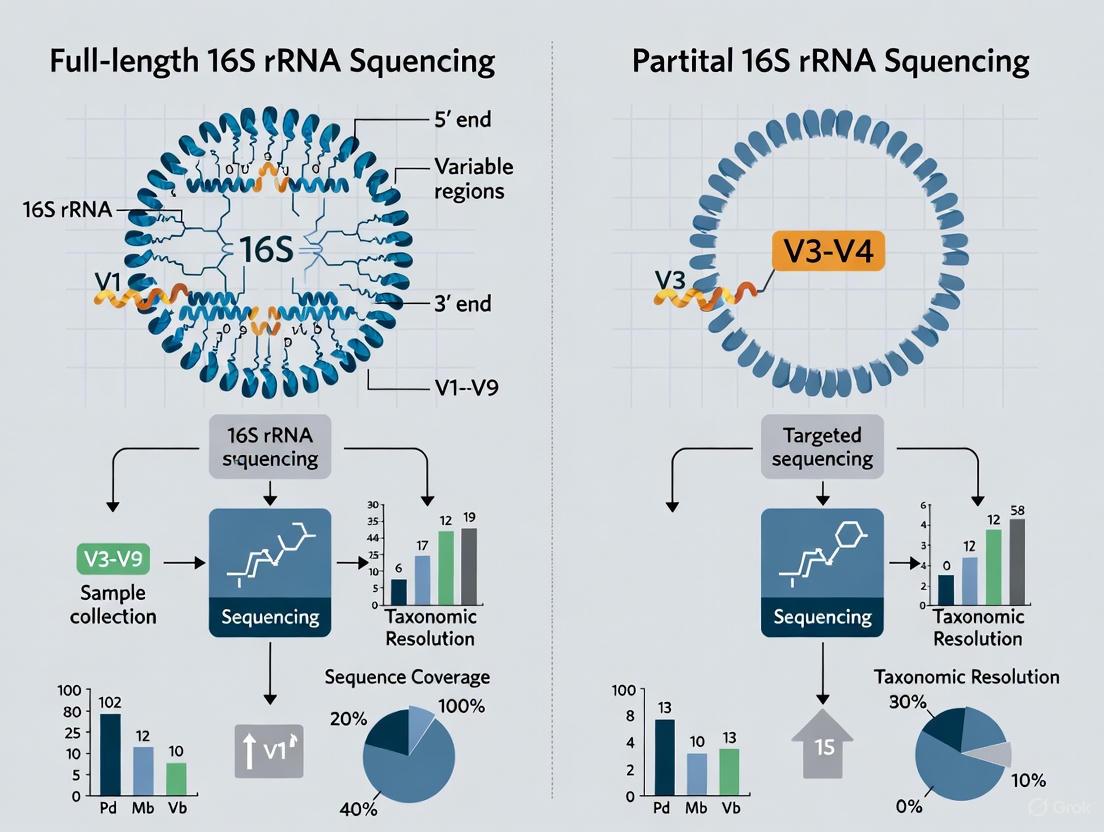
The 16S ribosomal RNA (rRNA) gene is a foundational molecular marker in microbiology, serving critical roles in phylogenetic studies, bacterial identification, and microbiome analysis. This gene, approximately 1,500 base pairs (bp) in length, possesses a characteristic structure comprising nine hypervariable regions (V1-V9) flanked by conserved sequences [1]. The conserved regions enable the design of universal PCR primers that can amplify this gene from a vast range of bacteria, while the hypervariable regions accumulate mutations at different rates, providing signature sequences that can differentiate taxonomic groups from the domain level down to the species and strain level [2] [3]. The advent of high-throughput sequencing technologies has fundamentally transformed how researchers utilize this gene. This guide objectively compares the performance of two primary sequencing approaches: full-length 16S rRNA gene sequencing using third-generation long-read platforms (e.g., PacBio) and partial 16S rRNA gene sequencing targeting specific hypervariable regions with second-generation short-read platforms (e.g., Illumina). The central thesis is that while targeting sub-regions was a necessary historical compromise due to technological limitations, full-length sequencing delivers superior taxonomic resolution, albeit with different cost and logistical considerations [4].
The 16S rRNA gene is a component of the 30S small subunit of the prokaryotic ribosome [3]. Its structure is key to its dual function in protein synthesis and its utility as a molecular clock. The gene's architecture consists of:
- Conserved Regions: These stretches of sequence are highly similar across most bacterial domains. They primarily serve structural and functional roles within the ribosome, such as defining ribosomal protein positions and aiding in the initiation of protein synthesis [2]. From a practical standpoint, these conserved segments provide reliable binding sites for "universal" PCR primers, allowing for the amplification of the 16S gene from a wide spectrum of bacterial species without prior knowledge of the specific sequences present [1].
- Hypervariable Regions (V1-V9): Interspersed between the conserved areas are nine hypervariable regions (V1 through V9), which range from approximately 30 to 100 base pairs in length [3]. These regions demonstrate considerable sequence diversity among different bacterial species due to a higher tolerance for evolutionary change. The variable regions contain species-specific signature sequences that are the primary basis for bacterial identification and phylogenetic discrimination [5] [1]. It is crucial to note that the degree of conservation and the power to discriminate between taxa vary significantly across the different hypervariable regions [4].
The following diagram illustrates the relative positions of these regions within the linear sequence of the 16S rRNA gene.
Comparative Analysis of Hypervariable Regions
Not all hypervariable regions are equally effective for differentiating bacterial taxa. The discriminatory power of each region varies considerably, making the choice of target region a critical decision in experimental design [5] [4].
Diagnostic Resolution of Individual Hypervariable Regions
A systematic analysis of hypervariable regions in 110 bacterial species, including common pathogens and CDC-defined select agents, revealed distinct strengths and weaknesses for each region [5]. The table below summarizes the key findings regarding the suitability of individual variable regions for differentiating specific bacterial groups.
Table 1: Suitability of 16S rRNA Hypervariable Regions for Differentiating Bacterial Taxa
| Hypervariable Region | Recommended Taxonomic Level | Notable Strengths and Limitations |
|---|---|---|
| V1 | Genus/Species | Best differentiation of Staphylococcus aureus and coagulase-negative Staphylococcus species [5]. |
| V2 & V3 | Genus | Suitable for distinguishing most bacteria to the genus level, except for closely related Enterobacteriaceae. V2 best for Mycobacterium; V3 best for Haemophilus [5]. |
| V6 | Species | A short region (∼58 bp) that could distinguish among most bacterial species except Enterobacteriaceae. Noteworthy for differentiating all CDC-defined select agents [5]. |
| V4, V5, V7, V8 | Higher Levels (e.g., Phylum) | Less useful targets for genus or species-specific probes; more appropriate for broader phylogenetic analyses [5] [3]. |
Performance of Region Combinations in Metagenomic Studies
In practice, many studies sequence multiple adjacent variable regions to increase the amount of informative data. However, in silico experiments demonstrate that even combinations of regions cannot match the taxonomic resolution provided by the full-length gene [4]. The following table compares common region combinations used with short-read platforms against full-length sequencing.
Table 2: Comparative Performance of Common 16S rRNA Amplicon Strategies
| Targeted Region(s) | Approximate Length | Species-Level Classification Efficiency | Taxonomic Biases and Notes |
|---|---|---|---|
| V4 | ~250 bp | Lowest performance; 56% of in silico amplicons failed to be confidently matched to their correct species [4]. | Provides adequate phylum-level resolution but struggles with species-level discrimination [4]. |
| V1-V3 | ~510 bp | A reasonable approximation of 16S diversity; performance varies by taxon [6] [4]. | Poor at classifying Proteobacteria; good for Escherichia/Shigella [4]. |
| V3-V5 | ~428 bp | Moderate performance [4]. | Poor at classifying Actinobacteria; good for Klebsiella [4]. |
| V6-V9 | ~548 bp | Moderate performance [4]. | The best sub-region for classifying Clostridium and Staphylococcus [4]. |
| Full-Length (V1-V9) | ~1500 bp | Highest performance; nearly all sequences correctly classified at the species level [4]. | Consistently provides the best results across diverse taxa with minimal bias [4] [7]. |
Experimental Comparisons: Full-Length vs. Partial Gene Sequencing
Direct experimental comparisons between full-length and partial 16S rRNA gene sequencing methodologies highlight critical differences in their outputs and applications.
Experimental Protocol for Method Comparison
A standard protocol for a head-to-head performance comparison, as used in recent studies, involves [7]:
- Sample Collection: DNA is extracted from relevant samples (e.g., human fecal samples, saliva, subgingival plaque, or environmental samples).
- Parallel Amplification:
- Partial Gene Approach: Amplify a specific hypervariable region (e.g., V3-V4) using primers such as 347F/803R [7] and sequence the amplicons on an Illumina MiSeq platform.
- Full-Length Approach: Amplify the entire V1-V9 region using universal primers (e.g., 27F/1492R) [8] [7] and sequence the amplicons on a long-read platform like PacBio Sequel II or Oxford Nanopore Technologies (ONT) MinION.
- Bioinformatic Analysis: Process raw reads from both platforms using standardized pipelines (e.g., QIIME 2, DADA2) for quality filtering, denoising, and Amplicon Sequence Variant (ASV) generation. Taxonomic assignment is performed against reference databases (e.g., SILVA, Greengenes).
- Comparison Metrics: Evaluate outcomes based on the percentage of reads assigned to genus and species levels, alpha and beta diversity measures, and accuracy in classifying taxa from mock communities of known composition.
Key Comparative Data
Recent studies yield the following performance data:
- Taxonomic Resolution: A 2024 study on human microbiome samples found that while both Illumina (V3-V4) and PacBio (V1-V9) assigned a similar percentage of reads to the genus level (~95%), PacBio assigned a significantly higher proportion of reads to the species level (74.14% vs. 55.23%) [7]. This confirms that full-length sequencing provides a substantial improvement in species-level classification.
- Community Composition: Despite differences in resolution, both platforms generally recapitulate similar broad-scale community profiles, with samples clustering by body site (niche) rather than by sequencing platform [7].
- Quantitative Accuracy: Both methods demonstrate high accuracy for quantifying most microbial genera. However, specific biases can occur; for instance, the genus Streptococcus has been observed at a higher relative abundance in PacBio data compared to Illumina data in oral samples, though such differences are not always statistically significant after multiple-testing corrections [7].
- Utility in Clinical Diagnostics: A 2024 clinical study found that 16S NGS (targeting the V3 region) demonstrated enhanced detection in 40% of confirmed infection cases compared to culture methods, and was particularly useful for identifying pathogens in patients who had already received antibiotic therapy [9].
The relationship between sequencing strategy and taxonomic outcomes is summarized below.
Successful 16S rRNA gene sequencing, whether full-length or partial, relies on a set of key reagents and bioinformatic resources.
Table 3: Essential Research Reagents and Resources for 16S rRNA Gene Sequencing
| Category | Item | Specific Example(s) | Function and Application |
|---|---|---|---|
| Wet-Lab Reagents | Universal PCR Primers | 27F (AGAGTTTGATCMTGGCTCAG) & 1492R (CGGTTACCTTGTTACGACTT) for full-length [8] [7]. 347F/803R or other pairs for V3-V4 [7]. | Amplify target regions of the 16S rRNA gene from complex DNA mixtures. |
| DNA Polymerase for Amplicon Generation | LongAmp Taq Master Mix [8]. | Robust amplification of target regions, especially for full-length amplicons. | |
| Library Prep Kit | SQK-16S Barcoding Kit (ONT) [8]. SMRTbell Express Template Prep Kit (PacBio) [6]. | Prepare amplified DNA for sequencing on a specific platform. | |
| Sequencing Platforms | Long-Read Sequencer | PacBio Sequel II System [6] [7], Oxford Nanopore MinION [8]. | Generates long reads (>1,000 bp) necessary for full-length 16S sequencing. |
| Short-Read Sequencer | Illumina MiSeq [7] [9]. | Generates high-throughput, short reads (≤600 bp) for partial gene sequencing. | |
| Bioinformatic Resources | Reference Databases | SILVA [1], Greengenes [4] [1], EzBioCloud [1]. | Curated collections of 16S rRNA sequences for taxonomic assignment. |
| Analysis Pipelines | DADA2 [4] [7], QIIME 2 [3], mothur [3]. | Process raw sequencing data, perform quality control, and conduct diversity analyses. |
The structure of the 16S rRNA gene, with its mosaic of conserved and hypervariable regions, makes it an powerful tool for microbial ecology and clinical diagnostics. The choice between full-length and partial gene sequencing is a fundamental one, with a clear trade-off between taxonomic resolution and practical considerations like cost and throughput. Full-length 16S rRNA gene sequencing via long-read technologies provides the highest possible taxonomic resolution, enabling reliable species-level classification and the detection of intragenomic copy variants, which can be critical for distinguishing closely related strains [4] [7]. In contrast, partial 16S rRNA gene sequencing with short-read platforms remains a robust and cost-effective method for characterizing microbial communities at the genus level and for studying broad ecological patterns [7] [9]. The decision must be guided by the specific research question, with full-length sequencing being indispensable for studies requiring species- or strain-level discrimination, and partial sequencing being sufficient for broader compositional surveys. As long-read technologies continue to decline in cost and improve in accuracy, they are poised to become the new gold standard for high-resolution amplicon-based microbial community analysis.
For decades, the sequencing of the 16S ribosomal RNA (rRNA) gene has been the cornerstone of microbial ecology and clinical bacteriology, enabling the identification and phylogenetic analysis of bacterial communities. The ~1,550 bp gene comprises nine hypervariable regions (V1-V9) that provide the sequence diversity necessary for taxonomic discrimination, interspersed with conserved regions. While the value of the full-length 16S rRNA gene for achieving maximum taxonomic resolution has long been recognized, the majority of high-throughput microbiome studies conducted since the advent of next-generation sequencing have, by necessity, focused on analyzing only one or a few of these sub-regions. This article explores the technological constraints—specifically those imposed by the dominant short-read sequencing platforms—that forced this widespread methodological compromise and evaluates the performance implications when compared to emerging full-length sequencing technologies.
The Technological Imperative: How Platform Capabilities Shaped Methodology
The historical focus on 16S sub-regions represents a direct adaptation to the technical limitations of second-generation sequencing platforms, most notably those from Illumina.
The Short-Read Sequencing Constraint: Illumina platforms, which became the workhorses of high-throughput sequencing, typically produce read lengths of 300-600 bp (2x150 bp or 2x300 bp paired-end). This physical limitation made it impossible to sequence the entire ~1,500 bp 16S rRNA gene in a single read [4] [7]. Consequently, researchers were forced to select specific variable regions that could be amplified and sequenced within these length constraints.
The Primer Selection Compromise: This technological limitation shifted the experimental design question from "What provides the best taxonomic resolution?" to "Which sub-region provides the best resolution within our technical constraints?" Common choices included [6] [4]:
- V4: Often selected for its relatively short length and good coverage across many bacterial phyla.
- V3-V4: A popular combination providing more taxonomic information than V4 alone.
- V1-V3: A longer region that offers broader diversity coverage but may require more sequencing resources.
The selection of these sub-regions involved careful trade-offs between phylogenetic resolution, cost-effectiveness, and the specific bacterial taxa being targeted [6]. This compromise was widely accepted because short-read platforms offered tremendous advantages in throughput, cost, and accessibility compared to first-generation Sanger sequencing, which could sequence the full gene but at a scale insufficient for complex microbiome studies.
Performance Implications: The Taxonomic Cost of Compromise
The decision to target sub-regions of the 16S rRNA gene came with significant limitations in taxonomic resolution, particularly at the species level. Comparative studies have consistently demonstrated that full-length 16S sequencing provides superior discriminatory power.
Table 1: Comparative Taxonomic Resolution of 16S Sub-Regions vs. Full-Length
| Target Region | Species-Level Classification Rate | Remarks on Taxonomic Bias |
|---|---|---|
| Full-Length (V1-V9) | Nearly 100% [4] | Provides the most accurate and comprehensive taxonomic resolution across all phyla |
| V1-V3 | Moderate to high [6] [4] | Resolution comparable to full-length for some applications; poor for Proteobacteria [4] |
| V3-V5 | Moderate [4] | Performs poorly for Actinobacteria [4] |
| V4 | Low (44% success rate) [4] | 56% of amplicons failed to confidently match their sequence of origin at species level [4] |
| V6-V9 | Varies by taxon [4] | Best sub-region for Clostridium and Staphylococcus [4] |
Table 2: Comparative Performance of Short-Read vs. Long-Read 16S Sequencing
| Parameter | Short-Read (Illumina) | Long-Read (PacBio) |
|---|---|---|
| Typical Target | V3-V4 or other sub-regions [7] | Full-length V1-V9 [7] |
| Read Length | ≤300 bp (2x250-300 bp paired-end) [10] [7] | ~1,500 bp (entire gene) [7] |
| Species-Level Assignment | 55.23% of reads [7] | 74.14% of reads [7] |
| Genus-Level Assignment | 94.79% of reads [7] | 95.06% of reads [7] |
| Limitations | Limited resolution for closely related species; regional bias [4] [7] | Higher initial cost per read; potential indel errors in homopolymers [4] |
The fundamental issue with sub-region sequencing is that discriminating polymorphisms between closely related species may be restricted to specific variable regions not captured in the sequenced fragment [4]. For example, while the V1-V3 region offers resolution comparable to full-length sequencing for some applications [6], the V4 region—one of the most commonly targeted regions—fails to provide confident species-level classification for more than half of all sequences [4].
Experimental Evidence: Methodologies for Comparison
Recent studies have directly compared the performance of short-read sub-region sequencing versus long-read full-length 16S sequencing using standardized experimental approaches.
Sample Collection and DNA Extraction: In a typical comparative study, samples are collected from various habitats (e.g., human saliva, subgingival plaque, and feces), and DNA is extracted using commercial kits such as the PowerSoil DNA Isolation Kit [6]. The integrity and concentration of extracted DNA are verified using fluorometry and spectrophotometry [10].
PCR Amplification and Sequencing: The same DNA extracts are subjected to two parallel amplification and sequencing workflows [7]:
- Short-read approach: Amplification of the V3-V4 regions (approximately 460 bp) using primers such as 341F/806R, followed by sequencing on Illumina MiSeq.
- Long-read approach: Amplification of the full-length 16S gene (V1-V9, approximately 1,500 bp) using primers 27F/1492R, followed by sequencing on PacBio Sequel II system.
Bioinformatic Analysis: Sequences are processed using standardized pipelines (e.g., DADA2 for Amplicon Sequence Variants) and classified against reference databases (e.g., SILVA, Greengenes) to determine taxonomic assignments at various phylogenetic levels [4] [7].
Experimental Workflow for Comparing 16S Sequencing Approaches
The Researcher's Toolkit: Essential Reagents and Platforms
Table 3: Key Research Reagents and Platforms for 16S rRNA Sequencing
| Item | Function | Examples & Specifications |
|---|---|---|
| Universal Primers | Amplify 16S rRNA gene from diverse bacteria | 27F (AGRGTTTGATYNTGGCTCAG) and 1492R (TASGGHTACCTTGTTASGACTT) for full-length [6] |
| DNA Extraction Kit | Isolate high-quality microbial DNA from complex samples | PowerSoil DNA Isolation Kit [6]; Quick-DNA HMW MagBead Kit [10] |
| Short-Read Sequencer | High-throughput sequencing of sub-regions | Illumina MiSeq (2×300 bp) [7] |
| Long-Read Sequencer | Full-length 16S sequencing | PacBio Sequel II (CCS mode) [6] [7]; Oxford Nanopore MinION [10] |
| Reference Database | Taxonomic classification of sequences | SILVA, Greengenes, RDP [4] |
The Paradigm Shift: Third-Generation Sequencing and the Return to Full-Length Analysis
The development of third-generation sequencing platforms has fundamentally altered the calculus of 16S sequencing by removing the technical constraints that necessitated the sub-region compromise.
Long-Read Technologies: Platforms such as Pacific Biosciences (PacBio) and Oxford Nanopore Technologies (ONT) now routinely produce reads in excess of 1,500 bp, making it feasible to sequence the entire 16S rRNA gene in a single read [4]. While early versions of these technologies suffered from higher error rates, improvements in chemistry and computational methods have substantially improved accuracy. PacBio's Circular Consensus Sequencing (CCS) generates HiFi reads with accuracies exceeding 99% [4] [7].
Resolution of Intragenomic Variation: Full-length 16S sequencing reveals another layer of microbial diversity that was largely inaccessible with sub-region approaches: intragenomic variation between multiple copies of the 16S gene within a single bacterium [4]. This variation, when properly resolved, can provide strain-level discrimination that was previously only possible with whole-genome sequencing.
The historical focus on 16S sub-regions was a necessary compromise driven by the technological limitations of short-read sequencing platforms. While this approach enabled the rapid expansion of microbiome science by providing cost-effective, high-throughput taxonomic profiling at the genus level, it came at the cost of species-level resolution and introduced regional biases. The emergence of viable long-read sequencing technologies now makes full-length 16S sequencing increasingly accessible, providing superior taxonomic resolution and enabling more precise microbial characterization. As these technologies continue to evolve and become more cost-effective, they promise to overcome the historical compromise, ushering in a new era of precision in microbiome research.
For decades, 16S rRNA gene sequencing has been a cornerstone of microbial ecology, yet its application has been constrained by technological limitations. The historical compromise of sequencing short, hypervariable regions (e.g., V3-V4) provided cost-effective but low-resolution data, primarily enabling genus-level identification. The advent of third-generation, long-read sequencing platforms from Oxford Nanopore Technologies (ONT) and Pacific Biosciences (PacBio) has broken this compromise, making high-throughput sequencing of the full-length (~1500 bp) 16S rRNA gene a practical reality. This guide objectively compares the performance of full-length 16S sequencing against traditional short-read and Sanger sequencing alternatives. Supported by recent experimental data, it demonstrates that full-length sequencing delivers superior species and strain-level discrimination, which is critically enhancing biomarker discovery, clinical diagnostics, and drug development research.
Performance Benchmarking: Full-Length vs. Partial 16S Sequencing
Empirical studies consistently show that full-length 16S rRNA sequencing outperforms short-read approaches in taxonomic resolution, accuracy, and the ability to discover specific biomarkers.
Table 1: Comparative Performance of Sequencing Approaches
| Metric | Short-Read (e.g., Illumina V3-V4) | Full-Length (e.g., ONT V1-V9) | Supporting Experimental Data |
|---|---|---|---|
| Species-Level Identification | Limited; primarily genus-level [11] [12] | High; enables precise species-level resolution [11] [12] | In CRC biomarker discovery, ONT identified specific pathogens like Fusobacterium nucleatum; Illumina could not [11]. |
| Taxonomic Accuracy/ Bias | Variable and region-dependent; prone to amplification bias [4] | More consistent and balanced representation [10] [4] | An in-silico experiment showed the V4 region failed to classify 56% of sequences to the correct species, unlike the full-length gene [4]. |
| Alpha Diversity Estimates | Can be underestimated [10] | Yields significantly higher diversity metrics [10] | In oropharyngeal swabs, a degenerate full-length primer set increased Shannon diversity from 1.85 to 2.68 (p<0.001) [10]. |
| Resolution of Strain-Level Variation | Limited | Potential to resolve intragenomic 16S copy variants [4] | PacBio CCS sequencing accurately resolved single-nucleotide polymorphisms between 16S gene copies within a single genome [4]. |
| Cost & Turnaround Time | Lower cost per sample in batches; longer wait times for batch completion [13] | Higher cost per sample but faster time-to-result for individual samples [13] [14] | A clinical workflow reduced time-to-result to 24 hours. Cost per test was ~$25.30 for ONT vs. $74 for Sanger [13] [14]. |
Detailed Experimental Protocols from Key Studies
The following section details the methodologies from recent, influential studies that generated the comparative data cited above.
- Sample Collection: Oropharyngeal swabs were systematically collected from 80 human donors with no history of oral inflammation. Swabs were applied to teeth, tongue, and buccal mucosa before insertion into the pharynx.
- DNA Extraction: Nucleic acids were extracted using the Quick-DNA HMW MagBead kit (Zymo Research). Purity and concentration were assessed via NanoDrop spectrophotometry and Quantus Fluorometry.
- PCR Amplification: Two separate sequencing libraries were prepared from each sample using different forward primers (27F-I, the ONT standard; and 27F-II, a more degenerate variant) with the same reverse primer.
- Sequencing: Full-length 16S amplification was performed, and libraries were sequenced on ONT's MinION Mk1C platform.
- Data Analysis: Alpha diversity (Shannon index) and taxonomic profiles were statistically compared between primer sets. Results were benchmarked against a large-scale salivary microbiome reference dataset (n=1,989).
- Sample Type: Tracheal aspirates from patients with chronic critical illness.
- DNA Extraction Kits Compared: QIAamp BiOstic Bacteremia Kit (Qiagen), MagMAX Microbiome Ultra Kit (Thermo Fisher), and HostZero Kit (Zymo Research). The Zymo kit included a host DNA depletion step.
- Library Preparation & Sequencing:
- Illumina (V3-V4): Amplification of the V3-V4 hypervariable region.
- ONT (FL-16S): Amplification of the full-length 16S gene using 27F-1492R primers.
- Bioinformatics:
- Illumina reads were processed using the standard QIIME2 pipeline.
- ONT reads were processed using the Emu pipeline, which is specifically designed for error-prone long reads.
- Validation: Both methods were first applied to a standardized mock microbial community of known composition to assess accuracy and bias.
- Bacterial Isolates: 153 clinical isolates that could not be identified by MALDI-TOF MS.
- DNA Extraction: For ONT, DNA was extracted using the Quick-DNA Fungal/Bacterial Miniprep kit (Zymo).
- Sequencing Methods:
- Sanger Sequencing: The first ~500 bp (V1-V3 region) was sequenced using the MicroSEQ 500 kit on an Applied Biosystems 3500 genetic analyzer.
- ONT Sequencing: Library preparation used the 16S Barcoding Kit (SQK-16S024) on FLO-MIN111 (R10.3) flow cells. Sequencing was performed on a GridION sequencer.
- Data Analysis: Sequences from both methods were classified using the SmartGene IDNS software and its 16S Centroid database. Discrepancies were resolved by whole-genome sequencing.
Visualizing the Experimental Workflow
The following diagram illustrates a standardized workflow for a comparative full-length versus short-read 16S sequencing study, integrating key steps from the cited protocols.
Successful implementation of a full-length 16S sequencing workflow depends on careful selection of reagents, kits, and computational tools.
Table 2: Key Research Reagent Solutions for Full-Length 16S Sequencing
| Item | Function/Application | Examples from Literature |
|---|---|---|
| Specialized DNA Extraction Kits | To efficiently lyse diverse cell types (esp. Gram-positive) and minimize host DNA in low-biomass samples. | Quick-DNA HMW MagBead Kit [10], Quick-DNA Fungal/Bacterial Miniprep Kit [14], MagMAX Microbiome Ultra Kit [12]. |
| Degenerate PCR Primers | To reduce amplification bias by accounting for sequence variation in conserved regions, improving taxonomic coverage. | Degenerate 27F-II primer showed superior diversity capture vs. standard 27F [10]. |
| Long-Range PCR Master Mix | To ensure efficient and accurate amplification of the full ~1500 bp 16S rRNA gene. | LongAmp Taq 2x MasterMix was used for full-length amplicon generation [13]. |
| ONT 16S Barcoding Kit | A streamlined, end-to-end kit for library preparation and barcoding of full-length 16S amplicons for multiplexing. | SQK-16S024 and SQK-16S114.24 kits were used in multiple studies [13] [14]. |
| R10.4.1 Flow Cells | ONT flow cells with updated chemistry that provides ~99% read accuracy, crucial for resolving single-nucleotide differences. | The use of R10.4.1 chemistry was key to achieving high species-level resolution [11] [12]. |
| Specialized Bioinformatics Pipelines | Software specifically designed to handle the higher error rate of long reads and provide accurate taxonomic assignment. | Emu [11] [12], NanoClust, and BugSeq 16S [12] pipelines are recommended over short-read tools. |
| Curated Reference Databases | High-quality, non-redundant databases essential for reliable species-level classification of full-length sequences. | Emu's default database [11], SILVA [11], and SmartGene's 16S Centroid database [14]. |
Discussion and Future Outlook
The accumulated evidence firmly establishes full-length 16S sequencing as a powerful tool for microbial discrimination. Its superior resolution is directly fueling advances in personalized medicine and drug discovery. In oncology, for example, the ability to identify specific cancer-associated species like Parvimonas micra and Bacteroides fragilis from patient microbiomes provides novel diagnostic biomarkers and potential therapeutic targets [11]. The technology's rapidly declining cost and faster turnaround time are making it increasingly accessible for clinical trial stratification and companion diagnostic development [15].
Future advancements will likely focus on overcoming remaining challenges, such as the need for standardized bioinformatic protocols and even more accurate reference databases. Furthermore, the integration of full-length 16S data with other omics layers (metagenomics, transcriptomics, metabolomics) through AI and cloud computing platforms promises a more holistic understanding of microbial function in health and disease [16]. As these technologies and analyses mature, full-length 16S sequencing is poised to become the new gold standard for high-resolution microbial community profiling.
The analysis of microbial communities through 16S rRNA gene sequencing has been a cornerstone of microbiome research for decades. Traditional approaches, primarily using short-read sequencing platforms like Illumina, sequence only specific hypervariable regions (e.g., V3-V4) due to read length limitations. This practice often restricts taxonomic resolution to the genus level and can introduce biases based on the variable region chosen [17] [18]. The advent of third-generation, long-read sequencing technologies from PacBio and Oxford Nanopore Technologies (ONT) has enabled the routine sequencing of the full-length 16S rRNA gene (~1,500 bp). This approach captures all nine variable regions within a single read, promising enhanced resolution down to the species and even strain level, thereby facilitating a deeper and more accurate understanding of gut microbiota composition and function [18]. This guide objectively compares the workflows, performance, and applications of PacBio HiFi and ONT platforms within the context of full-length 16S rRNA sequencing research.
Technology and Principle Comparison
The core technologies underpinning PacBio and ONT platforms are fundamentally different, leading to distinct operational characteristics and data output profiles.
PacBio HiFi Sequencing: This technology utilizes Single Molecule, Real-Time (SMRT) sequencing. The process occurs within tiny wells called Zero-Mode Waveguides (ZMWs). A DNA polymerase enzyme incorporates fluorescently-labeled nucleotides into the DNA template strand. As each nucleotide is incorporated, it emits a flash of light that is detected in real-time, identifying the base. The key to HiFi (High-Fidelity) reads is Circular Consensus Sequencing (CCS), where the same DNA molecule is sequenced repeatedly over its length. This multi-pass process generates a highly accurate consensus read with a typical accuracy exceeding 99.9% (Q30) [19] [20].
Oxford Nanopore Sequencing: ONT technology is based on the electrophoretic movement of DNA or RNA molecules through protein nanopores embedded in a membrane. An applied voltage drives the nucleic acids through the pores. As each nucleotide passes through, it causes a characteristic disruption in the ionic current. This change in current is measured and decoded in real-time to determine the DNA or RNA sequence. A significant advantage is its ability to sequence native DNA, allowing for direct detection of base modifications [19] [20].
The following diagram illustrates the fundamental operational principles of each technology.
Performance and Experimental Data Comparison
Direct comparative studies and technical specifications reveal critical differences in the performance of these platforms for 16S rRNA sequencing. A 2025 study comparing Illumina (V3-V4), PacBio HiFi (full-length), and ONT (full-length) for rabbit gut microbiota analysis provides key experimental insights [18].
Taxonomic Resolution
A primary motivation for using full-length 16S sequencing is to achieve superior taxonomic resolution.
Table 1: Comparative Taxonomic Classification Resolution [18]
| Taxonomic Level | PacBio HiFi | Oxford Nanopore | Illumina (V3-V4) |
|---|---|---|---|
| Family Level | ~99% | ~99% | ~99% |
| Genus Level | 85% | 91% | 80% |
| Species Level | 63% | 76% | 47% |
The study concluded that while both long-read platforms offered improved species-level resolution compared to Illumina, a significant portion of species-level assignments were labeled as "uncultured_bacterium," highlighting a limitation imposed by current reference databases rather than sequencing technology itself [18].
Technical and Operational Specifications
Beyond resolution, workflow and data output specifications are crucial for platform selection.
Table 2: Platform Technical Specifications for 16S Sequencing [19] [20] [18]
| Parameter | PacBio HiFi | Oxford Nanopore |
|---|---|---|
| Sequencing Principle | Fluorescent detection (SMRT) | Nanopore current sensing |
| Typical Read Length | 10 - 20 kb (HiFi reads) | 20 kb - >1 Mb |
| Raw Read Accuracy | ~85% (pre-CCS) | ~93.8% (R10.4.1 chip) |
| Consensus Accuracy | >99.9% (Q30) | ~99.996% (Q44) at 50x coverage |
| Typical 16S Run Time | ~24 hours | Up to 72 hours |
| Data Output per Run | 60 - 120 Gb (Revio/Vega) | 50 - 100 Gb (PromethION) |
| Throughput Booster | Kinnex 16S kits (12x increase) | Barcoding kits (SQK-16S024) |
| Primary Error Type | Random Indels | Systematic Indels in homopolymers |
| Basecalling | On-instrument, included | Off-instrument, may require GPU server |
| Portability | Benchtop systems | Portable (MinION) to benchtop |
Workflow Protocols and Experimental Design
A standardized experimental workflow for full-length 16S sequencing involves several key stages, from sample preparation to data analysis, with platform-specific nuances.
Sample Preparation and Library Construction
The initial steps are largely consistent across platforms, with critical attention to the PCR amplification step.
- Genomic DNA Extraction: High-quality, intact genomic DNA is extracted from samples (e.g., fecal material) using commercial kits like the DNeasy PowerSoil kit (QIAGEN). DNA quantity and quality must be assessed [18].
- Full-Length 16S Amplification: The nearly full-length 16S rRNA gene is amplified using universal primers 27F and 1492R, producing ~1,500 bp fragments.
- PacBio Protocol: PCR amplification is performed with a high-fidelity polymerase (e.g., KAPA HiFi Hot Start) over ~27 cycles. The primers are tailed with PacBio barcode sequences for multiplexing [18] [21].
- ONT Protocol: PCR amplification uses the 16S Barcoding Kit (e.g., SQK-RAB204 or SQK-16S024) over ~40 cycles, which also attaches barcodes [18].
- Library Preparation: The amplified DNA is purified, quantified, and pooled in equimolar concentrations.
Sequencing and Data Processing
Post-library preparation, the workflows diverge significantly based on the sequencing principle.
Bioinformatic Analysis: The high accuracy of PacBio HiFi reads allows them to be processed with the DADA2 pipeline, which models and corrects errors to generate high-resolution Amplicon Sequence Variants (ASVs) [18]. In contrast, ONT reads, despite recent accuracy improvements, often retain a higher error rate that complicates ASV calling with DADA2. Consequently, a common approach for ONT data is to use pipelines like Spaghetti that cluster sequences into Operational Taxonomic Units (OTUs) at a defined similarity threshold (e.g., 99%) [18]. For both platforms, the final high-quality sequences are imported into tools like QIIME2 for taxonomic assignment against reference databases (e.g., SILVA) and subsequent diversity analysis [18].
The Scientist's Toolkit: Essential Reagents and Materials
Successful execution of a full-length 16S sequencing project requires a suite of specialized reagents and kits.
Table 3: Essential Research Reagents for Full-Length 16S Sequencing
| Item | Function | Example Products & Kits |
|---|---|---|
| DNA Extraction Kit | Isolate high-quality microbial genomic DNA from complex samples. | DNeasy PowerSoil Kit (QIAGEN) [18] |
| High-Fidelity PCR Mix | Amplify the full-length 16S gene with minimal errors for accurate sequencing. | KAPA HiFi HotStart ReadyMix (PacBio) [18] |
| Platform-Specific Library Prep Kit | Prepare amplicons for sequencing by adding platform-specific adapters and barcodes. | SMRTbell Express Template Prep Kit 2.0 (PacBio) [18]; 16S Barcoding Kit (SQK-16S024, ONT) [18] |
| Throughput Enhancement Kit | Dramatically increase sample multiplexing and data yield for cost-effective studies. | Kinnex 16S rRNA Kit (PacBio) [21] |
| Sequencing Chemistry & Flow Cell | The consumables required to perform the sequencing reaction on the instrument. | Sequel II/Revio SMRT Cell & Chemistry (PacBio); Flongle/MinION/PromethION Flow Cell (ONT) [19] [18] |
| Bioinformatics Software/Pipeline | Process raw data, perform denoising/clustering, and conduct taxonomic & diversity analysis. | SMRT Link (PacBio), DADA2 (PacBio), Spaghetti (ONT), QIIME2 [18] |
The choice between PacBio HiFi and Oxford Nanopore Technologies for full-length 16S rRNA sequencing is not a matter of one being universally superior, but rather which is optimal for a given research context.
- Choose PacBio HiFi when the research question demands the highest possible single-read accuracy (Q30+) for confident base-calling and Amplicon Sequence Variant (ASV) generation, particularly in clinical or diagnostic settings where precision is paramount. Its recent Kinnex kits make large-scale studies highly cost-effective [21].
- Choose Oxford Nanopore when the application requires real-time data streaming, extreme portability for field-based sequencing, or access to the longest possible reads (megabase range). It is ideal for rapid pathogen identification or when rapid, on-site results are critical [19] [20].
Both technologies represent a significant advancement over short-read partial 16S sequencing, providing a more complete and resolved view of microbial communities. The decision should be guided by weighing the priorities of accuracy, speed, portability, and cost within the specific framework of the research project.
From Theory to Bench: Implementing Full-Length and Partial 16S Sequencing in Your Research
The analysis of the 16S rRNA gene has long been the cornerstone of microbial ecology, providing insights into the composition and dynamics of microbial communities across human health, environmental, and clinical settings. For years, standard practice relied on sequencing short, hypervariable regions (∼300-500 bp) using second-generation platforms like Illumina. However, a significant limitation of this approach is its restricted taxonomic resolution, often unable to differentiate between highly similar species—a critical shortcoming given that species from the same genus can have vastly different functional roles and clinical implications [7]. The emergence of third-generation, long-read sequencing technologies from Pacific Biosciences (PacBio) and Oxford Nanopore Technologies (ONT) has revolutionized this field by enabling the sequencing of the full-length ∼1,500 bp 16S rRNA gene. This comprehensive approach unlocks superior taxonomic resolution, allowing researchers to achieve species- and even strain-level identification [7] [22]. This guide provides an objective, data-driven comparison of PacBio's Circular Consensus Sequencing (CCS)/HiFi technology and ONT's nanopore chemistry, framing their performance within the pivotal context of full-length versus partial 16S rRNA sequencing research.
Technology Principles and Sequencing Mechanisms
The fundamental difference between PacBio and ONT lies in their underlying sequencing biochemistry and signal detection methods. Understanding these mechanisms is key to interpreting their performance data.
PacBio CCS/HiFi Sequencing
PacBio's Single Molecule Real-Time (SMRT) sequencing takes place within tiny nanostructures called Zero-Mode Waveguides (ZMWs). A single DNA polymerase molecule is immobilized at the bottom of each ZMW, where it synthesizes a complementary strand to a single-stranded DNA template. The process uses fluorescently labeled nucleotides; each time a nucleotide is incorporated, a characteristic light pulse is emitted. These pulses are detected in real-time to determine the DNA sequence [20] [19]. The key to PacBio's high accuracy is the Circular Consensus Sequencing (CCS) approach. The same DNA molecule is sequenced repeatedly in a loop, generating multiple subreads for a single fragment. These subreads are then computationally combined to produce one highly accurate HiFi (High-Fidelity) read, which effectively corrects for random errors inherent in single-molecule sequencing [19].
Oxford Nanopore Sequencing
Oxford Nanopore technology is based on a fundamentally different principle: nanopore-based electrical signal detection. A protein nanopore is embedded in an electrically resistant membrane. An ionic current is passed through the pore, and as a single molecule of DNA or RNA is threaded through the nanopore, each nucleotide base causes a characteristic disruption in the current. This unique electrical signal is measured and decoded in real-time to determine the sequence [20] [23]. Unlike PacBio, this process does not require polymerase-driven synthesis or fluorescent labels. The technology also allows for direct sequencing of native DNA and RNA, facilitating the direct detection of epigenetic modifications [20] [23]. Recent advancements, such as the R10 and R10.4 nanopores with a dual-reader head design, have improved accuracy, particularly in resolving homopolymer regions [23].
The following diagram illustrates the core biochemical principles of each technology.
Performance Comparison: Quantitative Data Analysis
Direct comparisons of key performance metrics are essential for platform selection. The following table summarizes the core characteristics of PacBio HiFi and ONT sequencing, particularly in the context of 16S rRNA amplicon sequencing.
Table 1: Core Performance Metrics for PacBio HiFi and Oxford Nanopore Sequencing
| Performance Metric | PacBio HiFi Sequencing | Oxford Nanopore Sequencing |
|---|---|---|
| Sequencing Principle | Fluorescently labeled dNTPs + ZMWs [20] | Nanopore current sensing [20] |
| Typical Read Length (16S) | Full-length 16S (∼1.5 kb) [7] | Full-length 16S (∼1.5 kb) to ultra-long reads [22] |
| Raw Read Accuracy | ~85% (single pass) [20] | ~93.8% (R10 chip) [20] |
| Final Read Accuracy | >99.9% (HiFi read after CCS) [20] [19] | ~99.996% (consensus sequence, 50X depth) [20] |
| Typical Throughput | 120 Gb/run (Sequel IIe) [20] | Up to 1.9 Tb/run (PromethION) [20] |
| Run Time | ~24 hours [19] | ~24-72 hours [22] [19] |
| Relative Equipment Cost | High [20] | Lower (portable MinION available) [20] [24] |
The impact of these technical metrics is clearly demonstrated in taxonomic resolution. A 2024 study directly compared full-length 16S sequencing with PacBio to short-read Illumina sequencing of the V3-V4 regions. The results were striking: while both platforms assigned a similar percentage of reads to the genus level (∼95%), PacBio enabled a significantly higher proportion of reads to be assigned to the species level (74.14% for PacBio vs. 55.23% for Illumina) [7]. This demonstrates the tangible benefit of full-length 16S reads for achieving the species-level taxonomy that is often required for meaningful biological interpretation.
Application in 16S rRNA Sequencing: Experimental Protocols and Outcomes
Both platforms have established, optimized workflows for full-length 16S rRNA sequencing. Below is a generalized experimental pipeline, with platform-specific nuances noted.
Generalized Full-Length 16S rRNA Sequencing Workflow
Key Methodological Insights from Recent Studies
- PacBio Protocol (from BMC Genomics, 2024): The full-length 16S rRNA gene (V1-V9 regions) is amplified from isolated DNA using primers such as 27F and 1492R. The amplicons are used to construct a SMRTbell library, which is then sequenced on a platform like the Sequel II to generate HiFi reads. The high accuracy of HiFi reads allows for direct amplicon sequence variant (ASV) classification using standard tools like DADA2, providing single-nucleotide resolution for distinguishing between highly similar species [7].
- ONT Protocol (from Nanopore Workflow Overview): ONT also uses PCR to amplify the full-length 16S gene from gDNA, typically employing a barcoded kit (e.g., the 16S Barcoding Kit) to multiplex up to 24 samples. The amplified library is prepared with a sequencing adapter and loaded onto a flow cell (e.g., MinION). Sequencing occurs in real-time, and for optimal species-level resolution, it is recommended to sequence to 20x coverage per microbe using the high-accuracy (HAC) basecaller in the MinKNOW software [22].
- Throughput Innovations (PacBio Kinnex Kits): A significant recent development for PacBio is the introduction of Kinnex kits for full-length 16S rRNA sequencing. These kits concatenate multiple amplicons into a single molecule for sequencing, leading to a massive throughput increase of 8 to 12-fold. This makes large-scale studies vastly more economical, allowing, for example, 1,536 samples to be multiplexed on a Revio system [21].
- ONT in Clinical Diagnostics (Front. Cell. Infect. Microbiol., 2025): ONT is being actively validated for clinical 16S diagnostics. Studies highlight its speed, scalability, and sensitivity compared to Sanger sequencing. Its ability to resolve polymicrobial infections—a known weakness of Sanger sequencing—and its lower cost compared to PacBio make it an appealing choice for routine clinical microbiology laboratories aiming to implement in-house, long-read 16S services [24].
The Scientist's Toolkit: Essential Research Reagents and Materials
Successful full-length 16S sequencing requires careful selection of laboratory reagents and materials. The following table outlines key solutions used in the featured experiments.
Table 2: Key Research Reagent Solutions for Full-Length 16S rRNA Sequencing
| Reagent/Material | Function | Example Products & Notes |
|---|---|---|
| DNA Extraction Kit | To obtain high-quality, inhibitor-free microbial DNA from complex samples. | Recommended: ZymoBIOMICS DNA Miniprep Kit (water), QIAGEN DNeasy PowerMax Soil Kit (soil), QIAmp PowerFecal DNA Kit (stool) [22]. Bead beating often required for full lysis [24]. |
| Full-Length 16S PCR Primers | To amplify the entire ∼1.5 kb 16S rRNA gene from extracted gDNA. | Primers 27F (5'-AGAGTTTGATCMTGGCTCAG-3') and 1492R (5'-GGTTACCTTGTTACGACTT-3') are commonly used [7]. |
| Library Prep Kit | To prepare amplicons for sequencing on the respective platform. | PacBio: SMRTbell Prep Kit [21].ONT: 16S Barcoding Kit (for multiplexing) [22]. |
| Barcodes/Indices | To tag individual samples, enabling multiplexing of multiple libraries in a single run. | Available from both PacBio and ONT. Crucial for cost-effectiveness in large-scale studies [22] [21]. |
| Sequencing Platform | The instrument used to generate sequence data. | PacBio: Sequel II/IIe, Revio systems [20] [21].ONT: MinION (portable), GridION, PromethION (high-throughput) [20] [22]. |
| Bioinformatics Pipeline | For data processing, demultiplexing, error-correction, and taxonomic assignment. | PacBio: SMRT Link software with HiFi-16S-workflow [21].ONT: EPI2ME wf-16s pipeline or custom tools (e.g., DADA2 for HiFi reads) [7] [22]. |
The choice between PacBio HiFi and Oxford Nanopore sequencing is not a matter of one being universally superior, but rather which technology is best suited to the specific research objectives, budget, and operational constraints.
- Choose PacBio HiFi sequencing when your research priority is achieving the highest possible accuracy for species-level taxonomic resolution. Its HiFi reads provide unparalleled single-molecule accuracy, which is critical for differentiating between closely related bacterial species or strains, as demonstrated in human microbiome studies [7]. This makes it ideal for clinical research, genome assembly, and any application where base-level precision is paramount. Furthermore, with the advent of Kinnex kits, PacBio now offers a highly scalable solution for large-scale 16S studies [21].
- Choose Oxford Nanopore sequencing when your application benefits from real-time data streaming, portability, or the lowest upfront equipment cost. ONT's unique advantages make it the platform of choice for rapid pathogen monitoring in outbreak settings, field sequencing in remote locations, and clinical point-of-care testing where quick turnaround is essential [20] [24]. Its ability to generate ultra-long reads can also be beneficial for spanning multiple conserved regions in complex microbial communities.
In the broader thesis of full-length versus partial 16S sequencing, the evidence is clear: sequencing the entire gene provides a definitive increase in taxonomic resolution over short-read approaches [7] [22]. Both PacBio and ONT effectively overcome the limitations of partial gene sequencing, enabling researchers to move beyond genus-level classifications and uncover the true diversity and composition of microbiomes at the species level. The decision, therefore, hinges on which long-read technology's performance profile best aligns with the goals of your specific research program.
In the field of microbiome research, the choice between standard and degenerate primers for full-length 16S ribosomal RNA (rRNA) gene amplification represents a critical methodological crossroads with profound implications for taxonomic accuracy and diversity assessment. Targeted amplicon sequencing of the 16S rRNA gene remains a cornerstone approach for investigating microbial communities, with its accuracy strongly dependent on the primer pairs selected for polymerase chain reaction (PCR) amplification [25]. While standard primers consist of a single defined nucleotide sequence, degenerate primers incorporate mixtures of oligonucleotides with variability at specific positions, enabling broader matching across diverse bacterial taxa [25]. The expanding knowledge of unculturable bacterial sequences, coupled with advances in third-generation sequencing technologies capable of reading the entire ~1,500 bp 16S rRNA gene, has intensified the need to optimize primer design strategies [25] [8]. This guide objectively compares the performance of standard versus degenerate primer systems for full-length 16S rRNA amplification, providing researchers with evidence-based insights to inform experimental design in microbial community studies.
Primer Design Fundamentals: Balancing Specificity and Coverage
Effective primer design for full-length 16S rRNA amplification requires balancing multiple competing objectives: maximizing amplification efficiency and specificity, achieving comprehensive coverage of target microbial communities, and minimizing amplification bias [25]. The 16S rRNA gene contains nine hypervariable regions (V1-V9) interspersed with conserved regions that serve as binding sites for PCR primers [26]. While standard primers with fixed sequences offer predictable melting temperatures and minimal synthesis complexity, their rigid structure may fail to accommodate natural sequence variation in conserved regions, potentially missing important taxonomic groups [8].
Degenerate primers address this limitation by incorporating nucleotide variability at specific positions, effectively representing multiple primer sequences in a single mixture [25]. This strategy expands potential binding sites across diverse bacterial lineages but introduces new challenges in maintaining experimental efficiency and specificity. The degree of degeneracy must be carefully optimized, as excessive variability can reduce effective primer concentration for any specific sequence and increase the likelihood of off-target amplification [27]. Computational approaches like multi-objective optimization simultaneously maximize efficiency, coverage, and minimize primer matching-bias, demonstrating that primer sets outperforming literature standards can be identified through systematic analysis [25].
Table 1: Fundamental Design Parameters for 16S rRNA Primers
| Parameter | Standard Primer Guidelines | Degenerate Primer Considerations |
|---|---|---|
| Length | 18-30 nucleotides [28] | Similar range, with degenerate positions strategically placed |
| GC Content | 40-60% [28] [27] | Maintained within range, considering all possible sequence combinations |
| Melting Temperature (Tₘ) | 50-65°C; primers in pair should have Tₘ within 2°C [28] [27] | Calculated based on all possible sequences in degenerate mixture |
| 3' End Stability | Avoid complementarity in 2-3 bases at 3' end; avoid T as ultimate base [28] | Particularly critical to maintain strong binding at 3' end despite degeneracy |
| Specificity Checking | BLAST analysis against target genome [27] | Must account for all possible sequences represented in degenerate mixture |
Comparative Performance Analysis: Standard vs. Degenerate Primers in Experimental Settings
Biodiversity Assessment in Complex Communities
Direct experimental comparisons reveal striking differences in taxonomic recovery between standard and degenerate primers. A comprehensive study of human fecal samples using nanopore sequencing compared the conventional 27F primer (27F-I) included in the Oxford Nanopore Technologies (ONT) 16S Barcoding Kit with a more degenerate 27F primer (27F-II) [8]. The results demonstrated that the standard 27F-I primer revealed significantly lower biodiversity and an unusually high Firmicutes/Bacteroidetes ratio compared to the degenerate primer set. When contextualized against gut microbiome profiles commonly reported in Western industrial societies (e.g., the American Gut Project), the more degenerate primer set (27F-II) better reflected expected composition and diversity [8].
These findings highlight how standard primers designed from limited datasets, primarily derived from culturable bacteria, may fail to capture the full spectrum of microbial diversity in complex samples. The inclusion of degeneracy at key variable positions enables primers to accommodate sequence divergence in unculturable taxa, thereby providing a more comprehensive community profile [8]. This enhanced coverage comes with the trade-off of potentially increased amplification of non-target sequences, necessitating rigorous in silico validation.
Impact on Taxonomic Resolution and Classification Accuracy
Full-length 16S rRNA sequencing fundamentally enhances taxonomic resolution compared to partial gene sequencing, regardless of primer type. Comparative analyses demonstrate that sequencing the entire 16S rRNA gene provides superior taxonomic resolution at the species level compared to targeting specific variable regions like V3-V4 or V4 alone [6] [29] [30]. However, primer choice significantly influences the efficacy of this approach.
Table 2: Performance Comparison of Standard vs. Degenerate Primers in Experimental Studies
| Performance Metric | Standard Primers | Degenerate Primers | Experimental Context |
|---|---|---|---|
| Taxonomic Richness | Significantly lower biodiversity [8] | Higher observed biodiversity [8] | Human fecal microbiome (n=73 samples) |
| Community Composition Accuracy | Skewed composition (e.g., high Firmicutes/Bacteroidetes ratio) [8] | Better reflection of expected community structure [8] | Comparison against American Gut Project benchmarks |
| Amplification Efficiency | Potentially reduced for taxa with primer binding site mismatches [26] | Broader coverage across diverse taxa [25] | In silico analysis of 57 primer sets against SILVA database |
| Species-Level Classification | Limited by primer-template mismatches [26] | Enhanced species-level resolution [25] | Mock community validation |
| Off-Target Amplification | Generally lower when well-designed [31] | Potentially higher without proper optimization [25] | Human gastrointestinal biopsy samples |
Research indicates that even with full-length 16S gene sequencing, limitations persist in achieving complete taxonomic resolution at the species level for complex samples like human skin [6]. However, carefully designed degenerate primers can improve resolution by reducing primer-template mismatches that compromise amplification efficiency for certain taxa [26]. Notably, computational evaluation of 57 commonly used 16S rRNA primer sets identified significant limitations in widely used "universal" primers, which often fail to capture extant microbial diversity due to unexpected variability in traditionally conserved regions [26].
Primer Binding Efficiency and Amplification Bias
The thermodynamic properties of primer-template binding differ substantially between standard and degenerate primers. Standard primers exhibit predictable melting behavior and uniform amplification efficiency across matched templates, while degenerate primers demonstrate variable binding strength depending on the specific sequence combination [25]. This variability can introduce amplification biases, where templates perfectly matching highly represented sequences in the degenerate mixture amplify more efficiently than those matching less represented sequences [25].
Intergenomic variation within the 16S rRNA gene further complicates primer binding efficiency. Shannon entropy analysis reveals substantial sequence variation even within traditionally conserved regions of the 16S rRNA gene [26]. This variation impacts primer performance differently across taxonomic groups, potentially introducing systematic biases in microbial community profiles. Optimal primer design must therefore account for the binding efficiency across the entire target community, not just for individual reference sequences [25].
Experimental Protocols and Validation Methodologies
In Silico Primer Evaluation and Optimization
Computational methods provide essential tools for evaluating and optimizing primer performance before experimental validation. The mopo16S software tool (Multi-Objective Primer Optimization for 16S experiments) implements an algorithm that simultaneously maximizes three key objectives: (1) efficiency and specificity of target amplification; (2) coverage of different bacterial 16S sequences; and (3) minimization of differences in primer matching across sequences [25]. This approach can be applied to any desired amplicon length without affecting computational performance.
A comprehensive in silico evaluation protocol should include:
- Specificity Analysis: Use tools like Primer-BLAST to assess potential off-target amplification against relevant genome databases [27].
- Coverage Assessment: Evaluate primer matches against comprehensive 16S databases (e.g., SILVA, GreenGenes) using tools like TestPrime [26].
- Degeneracy Optimization: Balance the degree of degeneracy to maximize coverage while maintaining practical primer synthesis quality and effective concentration [25].
- Thermodynamic Properties: Calculate melting temperatures for all possible sequences in degenerate mixtures to ensure uniform amplification behavior [27].
Experimental Validation Workflows
Robust experimental validation of primer performance should include both mock communities and representative biological samples:
Mock Community Validation:
- Utilize defined mixtures of bacterial strains with known abundances [26] [30]
- Amplify with both standard and degenerate primer sets
- Sequence using appropriate long-read platforms (PacBio SMRT or Nanopore)
- Compare observed composition to expected abundances to quantify amplification bias [30]
Biological Sample Analysis:
- Process identical aliquots of representative samples with different primer sets
- Include technical replicates to assess reproducibility
- Evaluate alpha-diversity metrics, community composition, and taxonomic resolution [8]
- Compare results to established benchmarks when available (e.g., American Gut Project) [8]
Figure 1: Comprehensive workflow for evaluation and validation of 16S rRNA primers for full-length amplification, incorporating both in silico and experimental assessment stages.
Table 3: Research Reagent Solutions for Full-Length 16S rRNA Studies
| Reagent/Resource | Function | Considerations for Primer Type Selection |
|---|---|---|
| 16S Reference Databases (SILVA, GreenGenes, RDP) | In silico primer evaluation and coverage assessment | Essential for designing and validating both standard and degenerate primers; critical for identifying regions of conservation for primer binding [25] [26] |
| PCR Optimization Kits (e.g., additive systems with DMSO or betaine) | Enhance amplification efficiency of complex templates | Particularly important for degenerate primers to maintain efficiency across different sequence variants; helps overcome secondary structure issues [27] |
| Long-Range Polymerase Systems (e.g., LongAMP Taq) | Amplify full-length ~1,500 bp 16S rRNA gene | Required for full-length amplification regardless of primer type; selection should consider fidelity and processivity [8] |
| Mock Microbial Communities (e.g., ZymoBIOMICS standards) | Experimental validation of primer performance | Critical for quantifying amplification bias and sensitivity of both standard and degenerate primer sets [26] [30] |
| Third-Generation Sequencing Platforms (PacBio SMRT, Oxford Nanopore) | Full-length 16S rRNA gene sequencing | Platform choice may influence optimal primer design; Nanopore enables direct PCR sequencing while PacBio offers higher single-read accuracy [6] [8] [29] |
The choice between standard and degenerate primers for full-length 16S rRNA amplification involves nuanced trade-offs that must be aligned with research objectives. Standard primers offer advantages in experimental consistency, predictable behavior, and minimal off-target amplification, making them suitable for well-characterized systems or when targeting specific taxonomic groups [28] [31]. Conversely, degenerate primers provide superior coverage of diverse microbial communities, particularly for exploratory studies aiming to capture the full extent of microbial diversity in complex samples [25] [8].
Evidence from comparative studies suggests that optimized degenerate primers generally outperform standard primers in comprehensive microbiome profiling, delivering more accurate representations of community structure and diversity [8]. However, this enhanced coverage requires careful optimization to minimize potential drawbacks including amplification bias, reduced efficiency, and increased computational complexity in design [25]. Researchers should prioritize degenerate primers when studying complex, poorly characterized microbial communities, while considering standard primers for targeted applications or when working with samples prone to off-target amplification [31].
As sequencing technologies continue to evolve and our knowledge of microbial diversity expands, primer design strategies must similarly advance. The development of novel computational approaches for multi-objective primer optimization represents a promising direction for maximizing coverage, efficiency, and specificity simultaneously [25]. Regardless of the approach selected, rigorous validation using both mock communities and biological samples remains essential for generating reliable, reproducible results in microbiome research.
The establishment of a robust wet-lab workflow for 16S rRNA sequencing is a critical foundation for reliable microbiome research. This process involves a series of carefully optimized steps from DNA extraction to library preparation, each introducing potential biases that can impact downstream results. The central challenge for researchers lies in selecting methodologies that accurately capture microbial community composition while balancing practical constraints. The choice between full-length 16S rRNA gene sequencing and partial region sequencing represents a fundamental decision point with significant implications for taxonomic resolution, cost, and technical feasibility [6] [17].
Third-generation sequencing (TGS) technologies, pioneered by Pacific Biosciences (PacBio) and Oxford Nanopore Technologies (ONT), have enabled high-throughput sequencing of the complete ~1,500 bp 16S rRNA gene, overcoming the read length limitations of earlier platforms [6] [4]. This technological advancement has sparked renewed investigation into whether the superior discriminatory power of full-length sequencing justifies its implementation compared to the well-established, more accessible partial gene approaches [4] [32]. This guide objectively compares these approaches through experimental data to inform researchers' workflow decisions.
Wet-Lab Workflow Fundamentals
DNA Extraction: The Critical First Step
The initial step of DNA extraction profoundly influences all subsequent results, as different protocols vary significantly in their efficiency for recovering genomic material from diverse bacterial species. A 2023 systematic comparison of four commercial DNA extraction methods demonstrated that protocol choice affects DNA yield, quality, and observed microbial diversity [33].
Key Considerations for DNA Extraction:
- Gram-positive vs. Gram-negative recovery: Protocols incorporating mechanical lysis (bead-beating) more effectively disrupt the thick peptidoglycan layer of Gram-positive bacteria [33].
- Sample homogenization: In gut microbiome studies, using a stool preprocessing device (SPD) upstream of DNA extraction improved standardization and increased DNA yield for three of four tested protocols [33].
- Yield and purity: The QIAGEN DNeasy PowerLyzer PowerSoil kit combined with SPD preprocessing demonstrated the best overall performance for gut microbiota samples, balancing high DNA concentration, appropriate fragment size, and purity [33].
Table 1: Performance Comparison of DNA Extraction Methods with SPD Preprocessing
| Extraction Method | DNA Yield | Fragment Size | Purity (A260/280) | Gram-positive Efficiency |
|---|---|---|---|---|
| S-DQ (SPD + DNeasy PowerLyzer PowerSoil) | High | ~18,000 bp | 1.8 (optimal) | High |
| S-MN (SPD + NucleoSpin Soil) | Low | ~21,000 bp | <1.8 (low) | Moderate |
| S-QQ (SPD + QIAamp Fast DNA Stool) | Moderate | ~15,000 bp | ~2.0 (potential RNA) | Moderate |
| S-Z (SPD + ZymoBIOMICS DNA Mini) | High | ~18,000 bp | <1.8 (low) | High |
For specific sample types, optimized protocols are available. The ZymoBIOMICS DNA Miniprep Kit is recommended for environmental water samples, while the QIAGEN DNeasy PowerMax Soil Kit performs well with soil samples, and the QIAamp PowerFecal DNA Kit is optimized for stool samples [22].
Library Preparation Strategies
Library preparation approaches differ significantly between full-length and partial 16S rRNA sequencing, with each requiring specific primer designs and amplification conditions.
Full-Length 16S rRNA Amplification: The ONT 16S Barcoding Kit 24 V14 enables amplification of the complete ~1.5 kb 16S rRNA gene using barcoded primers, allowing multiplexing of up to 24 samples [34]. The protocol requires 10 ng of high molecular weight genomic DNA per barcode and uses LongAmp Hot Start Taq 2X Master Mix for amplification [34]. The cycling conditions consist of an initial denaturation at 95°C for 2 minutes, followed by 25 cycles of denaturation (98°C for 10 seconds), annealing (55°C for 30 seconds), and extension (72°C for 90 seconds), with a final extension at 72°C for 2 minutes [6].
Partial 16S rRNA Amplification: For Illumina platforms targeting the V4 region, a common approach uses primers 515F (5′-GTGCCAGCMGCCGCGGTAA-3′) and 806R (5′-GGACTACHVGGGTWTCTAAT-3′) [32]. The PCR conditions typically involve an initial denaturation at 94°C for 3 minutes, followed by 25 cycles of denaturation (94°C for 45 seconds), annealing (50°C for 60 seconds), and extension (72°C for 5 minutes), with a final extension at 72°C for 10 minutes [32].
Performance Comparison: Experimental Data
Taxonomic Resolution Across Platforms
Comparative studies consistently demonstrate that full-length 16S rRNA sequencing provides superior taxonomic resolution compared to single variable region approaches. A 2024 analysis of 141 skin microbiota samples revealed that while full-length sequencing cannot achieve 100% species-level resolution for complex communities, it significantly outperforms sub-region sequencing [6].
Table 2: Taxonomic Resolution Comparison Between Sequencing Approaches
| Sequencing Approach | Species-Level Resolution | Genus-Level Resolution | Remarks |
|---|---|---|---|
| Full-length 16S (PacBio) | Superior (near-complete) | Excellent | Enables discrimination of closely related species |
| V1-V3 region | Moderate | Excellent | Best performing sub-region for skin microbiota |
| V3-V4 region | Limited | Good | Preferred for Illumina platforms |
| V4 region | Poor | Good | Most limited species discrimination [4] |
| V5-V9 region | Variable | Good | Effective for Clostridium and Staphylococcus |
The limitation of partial gene sequencing stems from the distribution of discriminatory sequence variations across the entire 16S rRNA gene. Johnson et al. (2019) demonstrated that only 56% of V4 region sequences could be confidently classified to species level compared to nearly 100% with full-length sequences [4]. Different variable regions also exhibit taxonomic biases; V1-V2 performs poorly for Proteobacteria, while V3-V5 shows limited resolution for Actinobacteria [4].
Diversity Metrics and Quantitative Comparisons
Experimental comparisons of full-length versus V4-region 16S rRNA sequencing reveal notable differences in diversity assessments and bacterial abundance measurements. A 2022 mouse study comparing these approaches found that while V4 region data generated by Illumina MiSeq and in silico extracted from full-length PacBio data showed similar patterns, both differed significantly from the full-length analyses in relative bacterial abundances and α- and β-diversity metrics [32].
In this controlled experiment, mice fed a Western-type diet without or with inulin supplementation showed consistent platform-dependent variations:
- OTU counts: Full-length sequencing detected proportionally more OTUs, though a higher percentage of reads were discarded as singletons or due to alignment issues [32].
- Rarefaction analysis: Full-length sequencing approaches revealed greater microbial diversity at equivalent sequencing depths [4].
- Community composition: While broad taxonomic patterns were consistent, significant differences emerged at finer taxonomic levels [32].
These findings suggest that the sequence length of the 16S rRNA gene affects results and may lead to different biological interpretations, particularly for interventions that subtly affect microbiota composition [32].
Technology-Specific Workflows
Oxford Nanopore Full-Length 16S Protocol
The ONT 16S Barcoding Kit provides a streamlined workflow for full-length 16S rRNA sequencing [22] [34]:
Library Preparation Timeline:
- 16S barcoded PCR amplification: 10 minutes setup + PCR runtime (approximately 2 hours)
- Barcoded sample pooling and bead clean-up: 15 minutes
- Rapid adapter attachment: 5 minutes
- Priming and loading the flow cell: 10 minutes
This protocol requires specific equipment compatibility, including R10.4.1 flow cells and the MinION or GridION sequencing devices [34]. For optimal results, ONT recommends sequencing amplified libraries to 20x coverage per microbe using the high accuracy (HAC) basecaller on MinKNOW software for 24-72 hours, depending on microbial sample complexity [22].
Illumina Partial 16S Sequencing
Illumina platforms typically target one or two hypervariable regions, with V3-V4 and V4 being the most common choices [17]. The workflow involves:
- Platform selection: MiSeq for lower throughput, NovaSeq for larger studies
- Dual-indexing approach: Enables multiplexing of hundreds of samples
- Paired-end sequencing: 2×250 bp or 2×300 bp reads
- Automation compatibility: Liquid handling systems can streamline library prep
The Illumina approach benefits from established protocols, extensive reference databases, and higher throughput per run, but sacrifices the taxonomic resolution afforded by full-length gene sequencing [17] [4].
Research Reagent Solutions
Table 3: Essential Research Reagents for 16S rRNA Sequencing Workflows
| Reagent/Kits | Manufacturer | Function | Application Notes |
|---|---|---|---|
| DNeasy PowerLyzer PowerSoil Kit | QIAGEN | DNA extraction from soil, stool, environmental samples | Optimal performance with SPD preprocessing [33] |
| ZymoBIOMICS DNA Miniprep Kit | ZymoResearch | DNA extraction from various sample types | Recommended for environmental water samples [22] |
| 16S Barcoding Kit 24 V14 | Oxford Nanopore | Full-length 16S amplification and barcoding | Enables multiplexing of 24 samples [34] |
| LongAmp Hot Start Taq 2X Master Mix | NEB | PCR amplification of full-length 16S | Used in ONT protocol for long amplicon generation [34] |
| AMPure XP Beads | Beckman Coulter | PCR clean-up and size selection | Standard for library purification in both platforms |
| Qubit dsDNA HS Assay Kit | Invitrogen | DNA quantification | Essential for quality control pre-sequencing |
The establishment of a robust wet-lab workflow for 16S rRNA sequencing requires careful consideration of research objectives, technical constraints, and desired taxonomic resolution. Based on current experimental evidence:
- For maximum taxonomic resolution, particularly for species-level discrimination, full-length 16S rRNA sequencing using third-generation platforms provides superior performance [6] [4].
- For large-scale studies where cost-effectiveness and higher throughput are prioritized, partial 16S rRNA sequencing targeting the V1-V3 or V3-V4 regions represents a practical compromise [6] [17].
- DNA extraction methodology should be standardized within studies and optimized for specific sample types, with bead-beating incorporation essential for Gram-positive bacteria recovery [33].
The choice between full-length and partial 16S rRNA sequencing ultimately depends on the specific research question, with full-length approaches enabling more precise taxonomic assignment and partial methods providing cost-effective community profiling. As sequencing technologies continue to evolve and costs decrease, full-length 16S rRNA sequencing is increasingly becoming the gold standard for comprehensive microbial community characterization.
The choice between full-length and partial 16S ribosomal RNA (rRNA) gene sequencing represents a critical methodological crossroads in microbiome research. For years, short-read sequencing of hypervariable regions (e.g., V3-V4) has been the standard approach for profiling complex microbial communities [35]. However, third-generation sequencing technologies from Oxford Nanopore Technologies (ONT) and PacBio now enable researchers to sequence the entire ~1,500 bp 16S rRNA gene, spanning all nine variable regions (V1-V9) in a single read [11] [4]. This technological advancement offers a fundamental shift in the taxonomic resolution achievable for gut microbiome development studies, disease surveillance programs, and drug discovery pipelines.
The full-length 16S rRNA gene provides significantly enhanced phylogenetic resolution compared to shorter fragments. While partial gene sequencing (e.g., V3-V4) typically limits classification to the genus level, complete V1-V9 sequencing enables reliable species-level identification and can even distinguish between strain-level variations [4] [36]. This increased resolution is particularly valuable for discovering precise bacterial biomarkers associated with human diseases and for understanding functional differences between closely related microbial strains that may have contrasting roles in host health [11].
This guide objectively compares the performance of full-length versus partial 16S rRNA sequencing approaches across key application areas, supported by recent experimental data and methodological considerations.
Performance Comparison: Full-Length vs. Partial 16S rRNA Sequencing
Table 1: Comparative performance of full-length versus partial 16S rRNA sequencing
| Performance Metric | Full-Length 16S (V1-V9) | Partial 16S (V3-V4) |
|---|---|---|
| Taxonomic Resolution | Species to strain level [4] | Primarily genus level [11] |
| CRC Biomarker Discovery | Identified 8+ specific species [11] | Limited species-level identification [11] |
| MASLD Prediction AUC | 86.98% [37] | 70.27% [37] |
| Polymicrobial Detection | 72% positivity rate in clinical samples [38] | 59% positivity rate (Sanger) [38] |
| Primer Bias Impact | Significant (affected by degeneracy) [10] | Significant (varies by region) [26] |
| Reference Database Correlation | Strong (r = 0.86 with degenerate primers) [10] | Variable by region [4] |
Table 2: Technical and practical considerations for sequencing approaches
| Consideration | Full-Length 16S (V1-V9) | Partial 16S (V3-V4) |
|---|---|---|
| Technology | Oxford Nanopore, PacBio | Illumina, Sanger |
| Read Length | ~1,500 bp [22] | ~300-500 bp [11] |
| Error Rates | Historically higher, but improved with R10.4.1 chemistry and Q20+ kits (~1% error) [10] [11] | Consistently low (<0.1%) [11] |
| Best For | Species-level discrimination, strain tracking, biomarker discovery | High-throughput genus-level profiling, large cohort studies |
| Bioinformatics | Emu, NanoClust [11] | DADA2, QIIME2 [11] |
| Cost & Accessibility | Lower barrier to entry for sequencers, rapid turnaround [11] | Established pipelines, higher instrument costs |
Application Spotlights
Gut Microbiome Development and Dynamics
Full-length 16S rRNA sequencing provides unprecedented insight into the intricate development of the gut microbiome across the lifespan. The enhanced taxonomic resolution is particularly valuable for delineating closely related species that may have distinct functional roles in ecosystem development but share high sequence similarity in commonly targeted hypervariable regions.
Research by [4] demonstrated that the full 16S gene provides better taxonomic resolution than any single hypervariable region. Their in silico experiments revealed that while the V4 region failed to confidently classify 56% of sequences at the species level, full-length sequencing successfully classified nearly all sequences to the correct species. This resolution is critical for tracking specific bacterial colonizers during early gut development and understanding their succession patterns throughout life stages.
The ability to resolve intragenomic 16S copy variants further enhances longitudinal studies of gut microbiome stability and dynamics. Different copies of the 16S gene within a single genome can exhibit subtle nucleotide variations, which full-length sequencing can detect and utilize as strain-level markers [4]. This capability enables researchers to track specific bacterial strains over time and across environmental perturbations, providing insights into microbiome stability, resilience, and personalized responses to interventions.
Disease Surveillance and Biomarker Discovery
The superior discriminatory power of full-length 16S sequencing makes it particularly valuable for identifying disease-specific microbial biomarkers with diagnostic, prognostic, or therapeutic potential.
In colorectal cancer (CRC) research, a direct comparison of sequencing approaches demonstrated the clear advantage of full-length 16S sequencing. [11] analyzed fecal samples from 123 subjects using both Illumina (V3-V4) and ONT (V1-V9) approaches. While both methods showed good correlation at the genus level (R² ≥ 0.8), full-length sequencing identified more specific bacterial biomarkers for CRC, including Parvimonas micra, Fusobacterium nucleatum, Peptostreptococcus stomatis, Peptostreptococcus anaerobius, Gemella morbillorum, Clostridium perfringens, Bacteroides fragilis, and Sutterella wadsworthensis. A predictive model using manually selected features achieved an AUC of 0.87 with 14 species identified through full-length sequencing, highlighting its utility for developing accurate diagnostic classifiers.
Similarly, in metabolic dysfunction-associated steatotic liver disease (MASLD), full-length 16S sequencing demonstrated significantly better performance for disease prediction. [37] conducted a matched case-control study of obese children with and without MASLD, comparing random forest models built using either full-length or V3-V4 sequencing data. The model based on full-length sequencing data achieved an AUC of 86.98%, significantly higher than the 70.27% AUC obtained with V3-V4 data (p = 0.008). This substantial improvement in predictive power underscores the value of species-level resolution for developing clinically useful microbiome-based diagnostics.
For infectious disease surveillance, full-length 16S sequencing improves pathogen detection in complex clinical samples. [38] evaluated 101 culture-negative clinical samples using both Sanger sequencing (targeting partial 16S) and ONT sequencing. The positivity rate for clinically relevant pathogens was significantly higher for ONT (72%) versus Sanger sequencing (59%), with ONT detecting more samples with polymicrobial presence (13 vs. 5). In one notable case, ONT identified Borrelia bissettiiae in a joint fluid sample that was missed by Sanger sequencing, demonstrating its enhanced sensitivity for detecting fastidious or unexpected pathogens in diagnostic settings.
Drug Discovery and Therapeutic Development
In pharmaceutical research, full-length 16S sequencing accelerates drug discovery by enabling more precise characterization of drug-microbiome interactions and identifying novel therapeutic targets.
The enhanced strain-level resolution of full-length sequencing helps researchers identify specific bacterial strains that modulate drug efficacy, bioavailability, or toxicity. This is particularly important for understanding interindividual variations in drug response and for developing personalized treatment strategies that account for an individual's microbiome composition. The ability to track specific strains through longitudinal studies provides insights into microbiome stability during therapeutic interventions and helps identify keystone species that critically influence treatment outcomes.
Full-length 16S sequencing also facilitates the discovery and quality control of live biotherapeutic products by providing sufficient resolution to distinguish between closely related production strains and verify their identity and purity. This capability ensures consistency in manufacturing and helps monitor the engraftment and persistence of probiotic formulations in clinical trials, ultimately supporting the development of more effective and reliable microbiome-based therapeutics.
Methodological Considerations
Experimental Protocols for Full-Length 16S Sequencing
Sample Collection and DNA Extraction
Proper sample handling is crucial for obtaining high-quality full-length 16S sequencing results. For oropharyngeal swabs, systematic sampling should include application to teeth, tongue, and buccal mucosa before inserting into the pharynx [10]. Swabs should be immediately transferred into DNA/RNA shielding buffer and processed within three days to preserve nucleic acid integrity. For fecal samples, the QIAamp PowerFecal Pro DNA Kit is recommended for consistent DNA extraction [37].
The Quick-DNA HMW MagBead kit has been successfully used for oropharyngeal samples, with DNA purity and concentration measured using spectrophotometry and fluorometry [10]. Extracted DNA should be stored at -20°C until library preparation to maintain stability.
PCR Amplification and Primer Selection
Primer design significantly impacts amplification efficiency and taxonomic representation in full-length 16S sequencing. [10] compared two primer sets with differing degrees of degeneracy for oropharyngeal samples: the standard ONT 27F primer (27F-I) and a more degenerate variant (27F-II). The more degenerate primer set (27F-II) yielded significantly higher alpha diversity (Shannon index: 2.684 vs. 1.850; p < 0.001) and detected a broader range of taxa across all phyla.
For full-length 16S amplification, barcoded primers containing a 5' buffer sequence (GCATC), a 16-base barcode, and degenerate 16S-specific sequences are recommended [37]:
- Forward: 5'Phos/GCATC-16-base barcode-AGRGTTYGATYMTGGCTCAG-3'
- Reverse: 5'Phos/GCATC-16-base barcode-RGYTACCTTGTTACGACTT-3'
PCR should be performed with 2 ng of gDNA and high-fidelity polymerase under optimized conditions: 95°C for 3 min; 20-27 cycles of 95°C for 30 s, 57°C for 30 s, and 72°C for 60 s; followed by final extension at 72°C for 5 min [37].
Library Preparation and Sequencing
For ONT sequencing, the 16S Barcoding Kit enables multiplexing of up to 24 samples in a single preparation [22]. This kit amplifies the entire ~1.5 kb 16S rRNA gene using barcoded primers before adding sequencing adapters. Libraries should be sequenced on MinION or GridION devices using R10.4.1 flow cells for improved accuracy [11]. The high-accuracy (HAC) basecaller should be used in MinKNOW software, with sequencing runs typically lasting 24-72 hours to achieve sufficient coverage (recommended 20x coverage per microbe) [22].
Bioinformatics Analysis
The analysis of full-length 16S sequencing data requires specialized bioinformatics approaches that account for the technology's specific error profiles and the opportunities presented by long reads.
For ONT data processing, the EPI2ME platform's wf-16S workflow provides a user-friendly option for species-level identification, generating abundance tables and interactive visualizations [22]. Alternatively, the Emu tool is specifically designed for analyzing ONT 16S data and has been shown to effectively classify reads with species-level resolution [11]. The choice of reference database significantly influences taxonomic assignments, with Emu's Default database generally providing higher diversity estimates and more species identifications than SILVA, though it may sometimes overconfidently classify unknown species as their closest matches [11].
Basecalling model selection also affects downstream results. [11] compared fast, hac, and sup Dorado basecalling models, finding that while taxonomic output was broadly similar across models, lower-quality basecalling (fast) resulted in significantly higher observed species counts and different taxonomic identifications (p < 0.05). For most applications, the high-accuracy (hac) or super-accurate (sup) models are recommended to balance accuracy with computational efficiency.
Diagram 1: Full-length 16S rRNA sequencing workflow from sample collection to data analysis
Table 3: Key research reagents and resources for full-length 16S rRNA sequencing
| Category | Specific Product/Resource | Application Notes |
|---|---|---|
| DNA Extraction Kits | ZymoBIOMICS DNA Miniprep Kit (environmental water), QIAGEN DNeasy PowerMax Soil Kit (soil), QIAamp PowerFecal Pro DNA Kit (stool) [22] | Sample-type specific protocols optimize yield and purity |
| PCR Amplification | 16S Barcoding Kit 24 (ONT) [22], KAPA HiFi HotStart ReadyMix [37] | Enables multiplexing of up to 24 samples; high-fidelity polymerase reduces errors |
| Sequencing Platforms | Oxford Nanopore MinION/GridION [22], PacBio Sequel IIe [37] | Portable, real-time sequencing (ONT) vs. highly accurate HiFi reads (PacBio) |
| Flow Cells/Chemistry | R10.4.1 flow cells (ONT) [11], Sequel II Binding Kit 2.1 (PacBio) [37] | Improved accuracy with updated chemistry |
| Bioinformatics Tools | EPI2ME wf-16S [22], Emu [11], DADA2 [37] | Platform-specific analysis pipelines |
| Reference Databases | SILVA [11] [26], Emu Default Database [11], NCBI RefSeq [38] | Database choice significantly impacts taxonomic assignments |
| Quality Control Standards | ZymoBIOMICS Microbial Community DNA Standard [37] | Evaluates sequencing performance and accuracy |
The comparative evidence clearly demonstrates that full-length 16S rRNA sequencing provides substantial advantages over partial gene sequencing for applications requiring high taxonomic resolution, including gut microbiome development studies, disease biomarker discovery, and drug development research. The ability to achieve species-level discrimination and detect strain-level variations enables researchers to identify precise microbial signatures associated with health and disease states.
While partial 16S sequencing remains valuable for large-scale screening studies where genus-level classification is sufficient, the continuous improvements in long-read sequencing technologies—including enhanced accuracy with R10.4.1 chemistry and Q20+ kits, streamlined library preparation protocols, and specialized bioinformatics tools—are making full-length 16S sequencing increasingly accessible and reliable for routine research applications [10] [11].
For researchers investigating complex microbial communities where fine taxonomic distinctions matter, investing in full-length 16S rRNA sequencing methodologies provides a powerful approach for uncovering biologically and clinically relevant insights that would likely remain obscured with partial gene sequencing approaches. As sequencing technologies continue to advance and costs decrease, full-length 16S sequencing is poised to become the new gold standard for microbiome studies requiring maximum phylogenetic resolution.
Navigating Pitfalls and Maximizing Data Fidelity in 16S rRNA Sequencing
In the pursuit of accurately characterizing microbial communities, 16S ribosomal RNA (rRNA) gene sequencing has become an indispensable tool for microbial ecologists and clinical researchers alike. However, this powerful technique is perpetually threatened by amplification bias, which can systematically distort the true structure and composition of microbial communities. These biases not only affect measures of alpha and beta diversity but can also lead to incorrect biological conclusions regarding microbial ecology and host-microbe interactions in disease contexts [10] [39]. Among the numerous sources of bias in the sample processing pipeline, two factors stand out for their profound and manageable impact: primer universality and PCR cycle number.
The emergence of third-generation sequencing technologies capable of full-length 16S rRNA gene sequencing (~1500 bp) has heightened the importance of addressing these biases [11] [4]. While sequencing the entire gene provides superior taxonomic resolution compared to partial gene approaches (e.g., V3-V4 or V4 regions commonly used with Illumina platforms), it simultaneously increases the opportunity for primer-induced bias to affect results across more variable regions [4]. This technical review comprehensively examines the experimental evidence supporting methodological optimization to combat these critical sources of bias, providing researchers with practical guidance for obtaining more accurate microbial community data.
The Impact of Primer Design on Taxonomic Representation
Primer Universality and Degeneracy: Mechanisms and Experimental Evidence
Primer binding efficiency varies substantially across bacterial taxa due to sequence mismatches in primer binding regions. Degenerate primers, which incorporate nucleotide ambiguity codes at variable positions, represent a strategic approach to enhance amplification inclusivity across diverse phylogenetic groups [10] [40]. The degree of primer degeneracy directly influences which bacterial sequences are successfully amplified and subsequently detected in sequencing results.
A compelling comparative analysis of primer sets with different degrees of degeneracy for full-length 16S rRNA gene sequencing of human oropharyngeal swabs demonstrated the profound impact of primer selection [10]. Researchers compared Oxford Nanopore's standard 27F primer (27F-I) with a more degenerate variant (27F-II) in 80 human oropharyngeal swab samples sequenced on the MinION Mk1C platform. Their findings revealed that the more degenerate primer set (27F-II) yielded significantly higher alpha diversity (Shannon index: 2.684 vs. 1.850; p < 0.001) and detected a broader range of taxa across all phyla compared to the standard primer [10].
The taxonomic profiles generated with the more degenerate 27F-II primer strongly correlated with a large-scale salivary microbiome reference dataset (Pearson's r = 0.86, p < 0.0001), whereas profiles generated with the standard 27F-I primer showed notably weaker correlation (r = 0.49, p = 0.06) [10]. The standard primer overrepresented Proteobacteria while underrepresented key genera such as Prevotella, Faecalibacterium, and Porphyromonas, demonstrating how non-degenerate primers can systematically skew community representation [10].
Table 1: Comparative Performance of Degenerate vs. Standard Primers in Oropharyngeal Microbiome Profiling
| Parameter | Standard Primer (27F-I) | Degenerate Primer (27F-II) | Significance |
|---|---|---|---|
| Shannon Diversity Index | 1.850 | 2.684 | p < 0.001 |
| Correlation with Reference Dataset | r = 0.49 (p = 0.06) | r = 0.86 (p < 0.0001) | Significantly stronger correlation with degenerate primer |
| Proteobacteria Representation | Overrepresented | Balanced | Reduced bias with degenerate primer |
| Key Genera Detection | Underrepresented Prevotella, Faecalibacterium, Porphyromonas | Appropriate representation | More balanced taxonomy with degenerate primer |
Computational Approaches for Optimal Primer Design
The development of sophisticated computational methods has advanced the objective design of primers with optimal coverage and minimal bias. The mopo16S algorithm (Multi-Objective Primer Optimization for 16S experiments) employs a strategic approach that simultaneously maximizes three key criteria: (1) efficiency and specificity of target amplification; (2) coverage, defined as the fraction of bacterial 16S sequences matched by at least one forward and one reverse primer; and (3) minimal primer matching-bias, reducing differences in the number of primer combinations matching each bacterial 16S sequence [40].
This multi-objective optimization is particularly valuable for quantitative studies where the goal is to accurately determine relative species abundance. Primer sets that exhibit high matching-bias can artificially inflate the apparent abundance of species with better primer matching while suppressing those with poorer matches, ultimately distorting the true community structure [40]. Computational tools like mopo16S help researchers select primer sets that provide the most balanced amplification across the phylogenetic spectrum of interest for their specific study systems.
PCR Cycle Number Optimization for Different Sample Types
Differential Effects Across Microbial Biomass Environments
The number of PCR cycles used in library preparation significantly influences sequencing results, with optimal cycle numbers dependent on the microbial biomass of the sample. Studies systematically evaluating PCR cycle number have revealed fundamentally different effects in high-biomass versus low-biomass samples [41].
In low microbial biomass samples (e.g., bovine milk, murine pelage, and blood), higher PCR cycle numbers (35-40 cycles) dramatically increase sequencing coverage without substantially altering measures of richness or beta-diversity [41]. This finding is particularly relevant for clinical samples where bacterial load is limited, such as tissue samples from deep infections, blood, or other typically sterile sites. In these challenging contexts, the benefit of increased coverage outweighs concerns about potential artifacts introduced by additional amplification cycles [41] [42].
Conversely, for high microbial biomass samples (e.g., feces, soil), excessive cycle numbers can reduce data quality by increasing chimera formation and other amplification artifacts [41] [39]. The established standard of 25-30 cycles remains appropriate for these sample types, sufficient to generate adequate library concentration for sequencing while maintaining community representation fidelity.
Table 2: Recommended PCR Cycle Numbers for Different Sample Types
| Sample Type | Recommended PCR Cycles | Experimental Basis | Key Considerations |
|---|---|---|---|
| High Biomass (Feces, Soil) | 25-30 cycles | Established standard; minimizes chimera formation [41] | Excessive cycles reduce data quality |
| Low Biomass (Milk, Blood, Tissue) | 35-40 cycles | Significantly increases coverage without distorting diversity metrics [41] | Essential for obtaining sufficient library concentration from minimal template |
| Clinical Samples (Deep Infections) | 30-35 cycles | Balance between sensitivity and specificity [42] | V1-V3 or V3-V4 regions provide better sensitivity than full-length V1-V8 |
Interaction Between PCR Cycles and Template Concentration
Template concentration interacts significantly with PCR cycle number in determining sequencing outcomes. Studies have demonstrated that low template concentrations are particularly susceptible to bias due to increased impact of stochastic processes during PCR amplification [43]. When using low template concentrations (0.1 ng/μL), profile variability increases substantially compared to higher template concentrations (5-10 ng/μL), regardless of the sample type (soil or feces) [43].
This evidence supports the recommendation to maximize template input whenever possible and adjust cycle numbers accordingly. For samples where template concentration is unavoidably low, increasing PCR cycle numbers becomes necessary to obtain adequate sequencing coverage, with the understanding that some increase in technical variability may occur [43].
The Interplay Between Primer Selection and Sequencing Technology
Full-Length vs. Partial 16S rRNA Gene Sequencing: Implications for Primer Bias
The choice between full-length and partial 16S rRNA gene sequencing has substantial implications for how primer bias manifests in microbial community analyses. Full-length 16S sequencing (spanning V1-V9 regions) provides superior taxonomic resolution, enabling more accurate species-level identification and improved discrimination of closely related taxa [11] [4]. However, this approach also increases the number of variable regions where primer binding bias can occur, potentially amplifying the effects of suboptimal primer choice.
Comparative analyses have demonstrated that nanopore full-length 16S rRNA gene sequencing identifies more specific bacterial biomarkers for conditions like colorectal cancer than Illumina's V3-V4 approach [11]. The enhanced resolution comes from capturing the complete sequence variation across all variable regions, which provides more phylogenetic information for distinguishing between closely related species [4].
In contrast, partial gene sequencing approaches target specific variable regions (e.g., V4, V3-V4, or V1-V3), which contain limited phylogenetic information and show significant variability in their ability to resolve different bacterial taxa [4]. The V4 region, one of the most commonly targeted regions in Illumina-based studies, performs particularly poorly at species-level discrimination, failing to confidently classify 56% of in-silico amplicons at the species level in one analysis [4].
Variable Region Performance in Taxonomic Classification
Different variable regions exhibit distinct biases in the bacterial taxa they can successfully identify [4]. For instance, the V1-V2 region performs poorly at classifying sequences belonging to the phylum Proteobacteria, while the V3-V5 region shows limited effectiveness for Actinobacteria [4]. These regional biases directly impact the apparent community composition and should inform primer selection based on the expected microbial community in the sample type under investigation.
Notably, primer selection must be optimized for the specific sequencing technology being employed. Primers designed for Illumina's short-read platform may not be optimal for nanopore or PacBio long-read sequencing, and vice versa [10] [11]. As full-length 16S sequencing becomes more accessible with improving accuracy of third-generation sequencing technologies, the development and validation of degenerate primers specifically optimized for full-length amplification will be increasingly important [10] [14].
Practical Applications and Experimental Guidance
Research Reagent Solutions for Optimal 16S rRNA Sequencing
Table 3: Essential Research Reagents and Their Functions in 16S rRNA Sequencing
| Reagent Category | Specific Examples | Function & Importance | Considerations for Selection |
|---|---|---|---|
| DNA Extraction Kits | PowerSoil DNA Isolation Kit [43], Quick-DNA HMW MagBead Kit [10] | Efficient lysis of diverse bacterial cell walls; removal of PCR inhibitors | Different kits introduce varying bias [39]; PowerSoil shows more balanced representation |
| Degenerate Primers | 27F-II (high degeneracy) [10], DPO-primers [42] | Broader phylogenetic coverage; reduced taxonomic dropout | Higher degeneracy improves detection of underrepresented taxa [10] |
| PCR Enzymes | Phusion high-fidelity DNA polymerase [41] | High fidelity amplification; reduced error rate | Essential for maintaining sequence accuracy in later cycles |
| 16S Sequencing Kits | 16S Barcoding Kit (Oxford Nanopore) [14] | Library preparation optimized for full-length 16S | Enables multiplexing; streamlined workflow |
| Positive Controls | Mock microbial communities [39] | Quantification of technical bias and batch effects | Should represent expected community complexity |
Integrated Workflow for Bias Minimization in 16S rRNA Studies
The following workflow diagram illustrates a comprehensive strategy for minimizing amplification bias in 16S rRNA sequencing studies, incorporating optimal practices for primer selection and PCR cycle number based on sample type:
Bias Minimization Workflow for 16S rRNA Studies
Amplification bias presents a significant challenge in 16S rRNA sequencing studies, but strategic approaches to primer selection and PCR cycle number optimization can substantially improve the accuracy and reliability of microbial community analyses. The experimental evidence demonstrates that degenerate primers with appropriate universality provide more comprehensive taxonomic coverage and reduce systematic underrepresentation of specific bacterial groups. Similarly, PCR cycle number optimization based on sample biomass characteristics ensures sufficient sequencing coverage while maintaining community structure integrity.
As sequencing technologies evolve toward full-length 16S rRNA gene analysis, providing enhanced taxonomic resolution to species and strain levels [11] [4] [14], the critical importance of these fundamental methodological considerations only increases. By implementing the evidence-based practices outlined in this review—selecting degenerate primers optimized for the target community, tailoring PCR cycles to sample biomass, and employing appropriate controls—researchers can significantly reduce amplification bias and generate more accurate representations of microbial communities across diverse research and clinical applications.
In the field of 16S rRNA gene sequencing, the choice of bioinformatic pipeline is a critical determinant of the resolution, accuracy, and biological relevance of the resulting microbial community data. This process is further complicated by the parallel decision regarding the optimal 16S rRNA gene region to sequence—full-length or hypervariable sub-regions. Methodologies for analyzing these sequences have evolved significantly, transitioning from traditional Operational Taxonomic Unit (OTU) clustering to more refined Amplicon Sequence Variant (ASV) approaches, with zero-radius OTUs (zOTUs) representing an intermediate denoising method. Framed within the broader thesis of comparing full-length versus partial 16S rRNA sequencing, this guide objectively compares the performance of these bioinformatic pipelines, with a specific focus on DADA2 as a prominent ASV-inferring algorithm, to aid researchers in selecting the most appropriate tool for their scientific inquiries.
Core Concepts: OTU, zOTU, and ASV
OTU (Operational Taxonomic Unit): This traditional method clusters sequencing reads based on a user-defined sequence similarity threshold, typically 97%, which is intended to approximate the species level [44]. This approach intentionally blurs similar sequences into a consensus to minimize the impact of sequencing errors. Clustering can be performed de novo (without a reference), closed-reference (against a database), or open-reference (a hybrid approach) [44]. While computationally efficient, especially the closed-reference method, it carries the risk of grouping distinct species into a single unit or, with very high thresholds, inflating diversity by misclassifying errors [44] [45].
zOTU (zero-radius OTU): Pioneered by tools like UNOISE3, the zOTU approach is a denoising method that attempts to correct sequencing errors without relying on clustering. It operates by identifying and discarding sequences that are likely chimeras or amplified errors, leaving behind what are considered "real" biological sequences. Unlike traditional OTUs, zOTUs are not defined by a clustering radius, hence the "zero-radius" nomenclature [46]. This method aims to provide single-nucleotide resolution while being more conservative than ASV methods in retaining rare variants.
ASV (Amplicon Sequence Variant): The ASV approach, implemented by pipelines like DADA2, Deblur, and UNOISE3, infers the exact biological sequences present in the original sample, differentiating true variation from sequencing noise through a statistical error model [44] [46]. An ASV is an exact sequence, and even a single-nucleotide difference can define a unique variant. This provides high-resolution, reproducible data that is directly comparable across studies, facilitates finer taxonomic assignment, and improves chimera identification [44] [47].
The logical relationship and output of these methods, from raw data to biological units, are summarized below.
Performance Comparison in 16S rRNA Analysis
Extensive benchmarking studies using mock communities and large clinical datasets have quantified the performance differences between these pipelines. The table below summarizes key findings from comparative analyses.
Table 1: Performance comparison of bioinformatics pipelines for 16S rRNA data
| Pipeline (Method) | Sensitivity & Specificity | Richness Estimation | Remarks | Key References |
|---|---|---|---|---|
| DADA2 (ASV) | High sensitivity, can have lower specificity compared to UNOISE3 [46]. | More conservative; infers true biological sequences, reducing inflation of diversity [47]. | Better handling of sequencing errors; provides high-resolution data suitable for strain-level differentiation [46]. | Prodan et al. (2020) [46], Möller et al. (2020) [47] |
| USEARCH-UNOISE3 (zOTU) | Best balance between resolution and specificity [46]. | Similar to DADA2pooled; higher than DADA2single [45]. | A robust denoising algorithm that produces zOTUs; performs well in comparative studies [46]. | Prodan et al. (2020) [46], QIIME2 Forum (2020) [45] |
| USEARCH-UPARSE (OTU) | Good performance, but with lower specificity than ASV-level pipelines [46]. | Can inflate bacterial richness, worsened without technical replication [47]. | A widely used OTU clustering pipeline. | Prodan et al. (2020) [46], Möller et al. (2020) [47] |
| MOTHUR (OTU) | Performs well, but with lower specificity than ASV-level pipelines [46]. | Higher observed richness compared to ASV pipelines [48]. | A comprehensive, open-source software suite; allows for detailed customization of the OTU clustering workflow [49]. | Prodan et al. (2020) [46], Marizzoni et al. (2020) [49] |
| QIIME-uclust (OTU) | Produces a large number of spurious OTUs; should be avoided [46]. | Inflated alpha-diversity measures [46]. | An older algorithm within the QIIME pipeline; outperformed by modern methods. | Prodan et al. (2020) [46] |
Experimental Data Underpinning the Comparison
The performance data in Table 1 is largely derived from two key studies:
Prodan et al. (2020) [46]: This study compared six bioinformatic pipelines on a mock community of 20 known bacterial strains (containing 22 true sequence variants) and a large dataset of 2,170 human fecal samples. Sensitivity and specificity were assessed based on the pipeline's ability to recover the true mock sequences without generating spurious taxa. The study found that DADA2 offered the best sensitivity but with slightly lower specificity than UNOISE3. QIIME-uclust generated a high number of false-positive OTUs, leading to inflated diversity metrics.
Möller et al. (2020) [47]: Focusing on the skin microbiome in atopic dermatitis, this research demonstrated that an OTU clustering approach inflated bacterial richness, an effect that was exacerbated without technical replication. In contrast, DADA2 likely handled sequencing errors more effectively and did not inflate molecular richness, representing an improvement over OTU clustering.
The Impact of 16S rRNA Gene Region
The choice between full-length 16S rRNA gene sequencing and targeting specific hypervariable regions (e.g., V4, V3-V4, V1-V3) introduces another layer of complexity, interacting with the choice of bioinformatic pipeline.
Table 2: Effect of 16S rRNA gene region on taxonomic resolution
| Sequencing Strategy | Taxonomic Resolution | Key Advantages | Key Limitations | Representative Study |
|---|---|---|---|---|
| Full-Length 16S (PacBio) | Superior; enables more precise classification to species level [32] [6]. | Maximizes discriminatory power of the entire gene; better phylogenetic resolution [6]. | Higher cost per sample; lower throughput than Illumina; potential for higher error rates requiring correction [50]. | Wang et al. (2024) [6], van der Hulst et al. (2022) [32] |
| Partial 16S (Illumina) | Varies by region; generally lower than full-length, often capping at genus level [32]. | High throughput and lower cost; well-established protocols and analysis pipelines [50]. | Resolution limited by the uniqueness of the single V-region sequence [32]. | van der Hulst et al. (2022) [32] |
| V1-V3 Region | For skin microbiota, offers resolution comparable to full-length 16S and is better than other hypervariable regions [6]. | A practical choice balancing accuracy and cost for skin microbiome studies [6]. | Performance is environment-dependent; may not be optimal for all sample types. | Wang et al. (2024) [6] |
| V4 Region | A widely used region, but differences in relative abundances and diversity are observed vs. full-length [32]. | Short length is ideal for Illumina sequencing; excellent for community-level profiling [50]. | May not distinguish closely related species with identical V4 sequences [32]. | van der Hulst et al. (2022) [32] |
Key Experimental Protocol: Full-Length vs. V4 Region
A 2022 study directly compared full-length and partial 16S sequencing [32]:
- Objective: To assess whether sequencing the full-length 16S rRNA gene using PacBio SMRT sequencing affected the results and interpretation of a dietary intervention (inulin) compared to sequencing only the V4 region on the Illumina MiSeq platform.
- Methods:
- Sample Collection: Cecum content from mice fed a Western-type diet (WTD) or WTD with inulin.
- DNA Sequencing: Generation of two primary datasets: (i) full-length 16S rRNA sequenced on PacBio, and (ii) V4 region sequenced on Illumina MiSeq. A third, derived dataset was created by in silico extraction of the V4 region from the full-length PacBio data.
- Data Analysis: All three datasets were analyzed using the OTU approach (97% similarity) via the QIIME pipeline.
- Findings: While the primary and derived V4 data showed similar results, comparison with the full-length data revealed significant differences in relative bacterial abundances, and α- and β-diversity. This led to the conclusion that the sequence length affects results and can lead to different biological interpretations [32].
Pipeline Performance in Fungal ITS Analysis
The debate between OTU and ASV approaches extends to fungal metabarcoding targeting the Internal Transcribed Spacer (ITS) region. The high intragenomic variation of the fungal ITS makes the application of the ASV approach controversial, as it may artificially inflate species richness [48].
Table 3: Pipeline performance for fungal ITS metabarcoding data
| Pipeline | Method | Performance in Fungal ITS Analysis |
|---|---|---|
| mothur | OTU Clustering (97% or 99%) | Identifies higher fungal richness compared to DADA2; generates homogeneous relative abundances across technical replicates; suggested as the most appropriate option [48]. |
| DADA2 | ASV | Results in highly heterogeneous relative abundances across technical replicates; may overestimate species richness due to intragenomic variation being called as unique ASVs [48]. |
A 2024 study on fungal communities in bovine feces and pasture soil found that mothur at a 97% similarity threshold provided more homogeneous and reliable results for fungal ITS data compared to DADA2, which showed high heterogeneity across technical replicates [48]. This highlights that the optimal pipeline is marker-dependent, and ASV approaches, while superior for bacterial 16S, may not be universally the best choice.
The Scientist's Toolkit: Essential Research Reagents & Materials
Table 4: Key reagents, software, and databases for 16S rRNA analysis
| Item | Function / Application | Example Products / Tools |
|---|---|---|
| DNA Extraction Kit | Isolation of high-quality genomic DNA from complex samples. | PowerSoil DNA Isolation Kit [6], QIAamp DNA Stool Mini Kit [49], E.Z.N.A. Stool DNA Kit [50] |
| 16S rRNA PCR Primers | Amplification of target 16S rRNA gene regions prior to sequencing. | 27F/1492R (Full-length) [6], 341F/806R (V3-V4) [49] [47], 515F/806R (V4) [32] [46] |
| Sequencing Platform | Generating the raw amplicon sequence data. | PacBio Sequel II (Long-read) [6], Illumina MiSeq (Short-read) [32] [49] |
| Bioinformatics Pipelines | Processing raw sequences into OTUs/zOTUs/ASVs and assigning taxonomy. | DADA2 [46], mothur [49] [48], QIIME/QIIME2 [32] [49], USEARCH/UPARSE [49] [46] |
| Reference Database | Taxonomic classification of the resulting sequences or variants. | SILVA [32] [49] |
The selection of a bioinformatic pipeline is a fundamental decision in 16S rRNA amplicon sequencing studies. Evidence from multiple performance comparisons strongly supports the adoption of ASV-based methods like DADA2 for bacterial community analysis, due to their superior error correction, resolution, and reproducibility. However, the optimal choice is context-dependent. For fungal ITS analysis, OTU clustering with mothur may currently be more reliable. Furthermore, the choice of sequencing strategy—full-length versus partial gene—significantly impacts taxonomic resolution and downstream biological interpretation. Researchers must therefore align their pipeline selection with their specific research question, target organism, and sequencing design to ensure robust and meaningful results.
A Comparative Guide to SILVA, Greengenes, and RDP This guide provides an objective comparison of three widely used 16S rRNA reference databases—SILVA, Greengenes, and the Ribosomal Database Project (RDP). The evaluation is framed within the critical context of modern 16S rRNA sequencing, which is increasingly shifting from partial to full-length gene analysis to achieve superior taxonomic resolution [4]. The performance of a taxonomic classifier is not independent of its reference database; the choice of database significantly impacts identification accuracy, especially at the species level [51].
The table below summarizes the core attributes and current status of each database.
Table 1: Core Characteristics of the 16S rRNA Reference Databases
| Database | Curated By | Last Major Update | Scope (Domains of Life) | Underlying Taxonomy | Key Distinguishing Feature |
|---|---|---|---|---|---|
| SILVA | Manually curated | SSU 138.2 (July 2024) [52] | Bacteria, Archaea, Eukarya [53] | Bergey's Taxonomy & LPSN [53] | Comprehensive, quality-checked, and aligned rRNA sequence data for all three domains [52]. |
| Greengenes | Automatic de novo tree construction | ~2012 (Over 10 years without update) [53] | Bacteria, Archaea [53] | de novo Tree Construction [53] | A historical database that is now significantly outdated. |
| RDP (Ribosomal Database Project) | Naïve Bayesian Classifier [53] | September 2016 [53] | Bacteria, Archaea, Fungi [53] | Bergey's Taxonomy [53] | Provides fungal LSU rRNA sequences in addition to bacterial and archaeal SSU rRNA [53]. |
Experimental Performance and Benchmarking Data
Independent benchmarking studies reveal critical differences in database performance, particularly for species-level identification, which is a primary goal of full-length 16S sequencing.
Comparative Accuracy in Taxonomic Assignment
A 2024 study introduced a new database, MIMt, and benchmarked it against existing options. The following table summarizes the performance of SILVA, Greengenes, and RDP in terms of sequence redundancy and annotation completeness, which are key factors influencing classification accuracy [53].
Table 2: Performance Benchmarks for Database Accuracy and Completeness
| Database | Redundancy & Annotation Issues | Species-Level Annotation |
|---|---|---|
| SILVA | Initially designed to store all public 16S sequences, not solely for identification; contains many "uncultured" entries despite a non-redundant dataset (Ref NR) [53]. | A large proportion of sequences are not identified at the species level [53]. |
| Greengenes | Over half of sequences lack genus-level annotation; less than 15% have species-level taxonomy assigned [53]. | Very poor (<15% of sequences) [53]. |
| RDP | Most sequences are annotated as 'uncultured' or 'unidentified' [53]. | Poor, due to the high number of uncultured/unidentified entries [53]. |
Database and Classifier Combination Performance
The performance of a classification algorithm is directly affected by the reference database it uses. A 2022 study evaluated multiple classifiers trained on different databases for classifying full-length 16S sequences. The results below highlight that the best performance is achieved by specific classifier-database pairs [51].
Table 3: Classifier and Database Combination Performance for Full-Length 16S Sequences
| Classifier | Recommended Database | Experimental Finding |
|---|---|---|
| SINTAX | RDP | When using RDP sequences as the training data, SINTAX and SPINGO provided the highest classification accuracy [51]. |
| SPINGO | RDP | When using RDP sequences as the training data, SINTAX and SPINGO provided the highest classification accuracy [51]. |
| Kraken2 | Custom/Greengenes | The performance of all classifiers was affected by the sequence training datasets. Using the RDP database yielded the highest accuracy for SINTAX and SPINGO [51]. |
Experimental Protocols Supporting the Data
Methodology for Benchmarking Database Accuracy
The comparative data in Table 2 was generated through a structured analysis of database composition [53]:
- Database Acquisition: The most recent versions of the SILVA, Greengenes, RDP, and GTDB databases were downloaded.
- Sequence Distribution Analysis: The number of sequences and their taxonomic distribution across kingdoms (Bacteria/Archaea) were analyzed.
- Taxonomic Annotation Assessment: The completeness of taxonomic information, from phylum down to species level, was systematically evaluated for each database. This involved quantifying the percentage of sequences with missing or "uncultured" annotations at each taxonomic rank.
- Redundancy Evaluation: The level of sequence redundancy within each database was assessed.
Methodology for Evaluating Classifier-Database Pairs
The findings in Table 3 were derived from a rigorous comparative study [51]:
- Classifier and Database Selection: Seven widely used classifiers (QIIME2, mothur, SINTAX, SPINGO, RDP, IDTAXA, Kraken2) and three training datasets (SILVA, Greengenes, RDP) were selected.
- Validation with Curated Sequences: The performance of each classifier-database combination was validated using a dataset of curated 16S full-length sequences and cross-validation datasets.
- Accuracy Measurement: The classification accuracy of each combination was measured at both the genus and species levels.
- Recommendation: The classifier-database pairs that provided the highest accuracy for classifying full-length 16S rRNA sequences were identified and recommended.
The Scientist's Toolkit: Essential Research Reagents and Materials
Table 4: Key Reagents and Tools for 16S rRNA Sequencing and Analysis
| Item | Function / Application | Example / Note |
|---|---|---|
| Primer Set 27F-II | PCR Amplification | A degenerate primer shown to significantly reduce amplification bias and improve diversity capture in full-length 16S sequencing of human oropharyngeal samples compared to standard primers [10]. |
| ZymoBIOMICS Gut Microbiome Standard | Mock Community Control | A defined microbial community used to validate and benchmark the entire wet-lab and bioinformatic workflow, from DNA extraction to taxonomic classification [26]. |
| SINTAX Classifier | Taxonomic Assignment | A classification algorithm that, when paired with the RDP database, demonstrated high accuracy for classifying full-length 16S sequences [51]. |
| Silva SSU Ref NR 99 Dataset | Reference Database | A non-redundant, curated dataset within SILVA where highly identical sequences have been removed, often used for high-quality taxonomic analysis [52]. |
| KrakenUniq Tool | Metagenomic Sequence Analysis | A bioinformatics tool for metagenomic classification that provides a more accurate estimate of species abundance and a lower false-positive rate compared to Kraken 2 in a hospital setting [54]. |
Decision Workflow and Sequencing Context
The choice of database is intrinsically linked to the chosen sequencing strategy. The following diagram illustrates the decision-making workflow, emphasizing the critical choice between full-length and partial gene sequencing.
Within the context of advancing full-length 16S rRNA sequencing, the choice of a reference database is pivotal for achieving accurate and biologically meaningful results. Based on the comparative data and experimental evidence:
- For Full-Length 16S Sequencing: To achieve the highest species-level classification accuracy for full-length sequences, the evidence strongly recommends using the RDP database in combination with the SINTAX or SPINGO classifiers [51]. This specific pairing leverages the strengths of both the classifier algorithm and the reference data.
- For General and Future-Proof Use: While RDP may be optimal for specific full-length applications, its update cycle halted in 2016. For broader applications, including partial gene sequencing, SILVA is a robust choice due to its active curation, comprehensive coverage across all three domains of life, and regular updates, with its latest release in July 2024 [52]. Researchers should be mindful of its many "uncultured" entries.
- Database to Avoid: Greengenes is not recommended for new studies aiming for species-level resolution, as it is outdated and has poor species-level annotation [53].
The field continues to evolve, with new, more curated databases like MIMt emerging to address the limitations of redundancy and incomplete annotation in traditional options [53]. Researchers should therefore view database selection not as a static choice, but as an evolving component of the 16S rRNA sequencing workflow.
The accurate and timely identification of bacterial pathogens is a cornerstone of effective clinical diagnostics and patient management. For bacterial isolates that cannot be identified using biochemical profiles or proteomic mass spectrometry, 16S ribosomal RNA (rRNA) gene sequencing has become the molecular method of choice [14]. The 16S rRNA gene is present in all bacteria and contains a unique mix of highly conserved and variable regions, providing a reliable genetic target for taxonomic classification [14].
Traditionally, clinical laboratories have relied on Sanger sequencing, which focuses on the first approximately 500 base pairs (bp) of the 16S rRNA gene. However, when genetic diversity is insufficient within this short region, genus-level or species-level identification may not be possible, necessitating sequencing of a longer gene section or an alternative target [14] [24]. The emergence of long-read sequencing technologies, particularly Oxford Nanopore Technologies (ONT), enables real-time sequencing of the full-length ~1,500 bp 16S rRNA gene, offering a potential solution to the limitations of short-read approaches. This guide provides an objective comparison of these sequencing methods, focusing on the critical parameters for clinical settings: cost, throughput, and turnaround time.
Platform Comparison: Sanger Sequencing vs. Oxford Nanopore
The following table summarizes a direct, clinically-oriented comparison between the traditional Sanger method and the emerging Nanopore technology for 16S rRNA gene sequencing.
Table 1: Clinical Platform Comparison: Sanger vs. Oxford Nanopore 16S rRNA Sequencing
| Feature | Sanger Sequencing (~500 bp) | Oxford Nanopore (Full-Length ~1,500 bp) |
|---|---|---|
| Sequencing Read Length | Targets first ~500 bp (V1-V3 regions) [14] | Full-length ~1,500 bp (all nine variable regions) [14] [10] |
| Taxonomic Resolution | Limited; often fails species-level ID when diversity is low in V1-V3 [14] | Higher; superior genus-level resolution and improved species-level discrimination [14] [55] |
| Cost per Test | ~$74 [14] | ~$25.30 (when multiplexing 24 samples/run) [14] |
| Hands-on Time | Similar to ONT [14] | Similar to Sanger sequencing [14] |
| Total Turnaround Time | 2-3 days [14] | Significantly shorter than Sanger sequencing [14] |
| Throughput | Low, even with multi-capillary approach [14] | High; enables multiplexing of many samples per run [14] |
| Key Clinical Advantage | Established gold standard, high single-read accuracy [24] | Faster results, higher resolution for polymicrobial infections, cost-effective for batches [14] [24] |
| Primary Limitation | Inability to resolve mixed infections from pure cultures [24] | Requires standardized workflow and quality control for robust clinical implementation [24] |
Analysis of Key Comparative Data
- Cost-Effectiveness: A 2025 study provides a stark contrast in cost-per-test, calculating approximately $25.30 for ONT versus $74 for Sanger sequencing when 24 samples are multiplexed on a single ONT flow cell [14]. This demonstrates the potential for substantial cost savings with the high-throughput Nanopore platform.
- Taxonomic Performance: The same study evaluated 153 bacterial clinical isolates and found that ONT had a significantly higher taxonomic resolution at the genus level (P < 0.01). When both methods achieved genus-level identification, concordance was 100%. At the species level, concordance was 91% when both methods provided an identification [14].
- Operational Efficiency: While hands-on technical time is comparable, the total turnaround time for ONT is significantly shorter than for Sanger sequencing [14]. This reduction in time-to-result can directly impact clinical decision-making and patient management.
Experimental Protocols and Validation
Implementing a new technology in a clinical setting requires a validated, end-to-end protocol. The following workflow is adapted from recent studies that established robust frameworks for clinical 16S ONT sequencing [14] [24].
Diagram 1: Clinical 16S ONT sequencing workflow.
Detailed Methodologies
DNA Extraction and Quality Control
For ONT sequencing, studies recommend dedicated extraction kits such as the Quick-DNA Fungal/Bacterial Miniprep Kit to avoid inhibitors that can interfere with sequencing [14]. DNA concentration and purity should be assessed using a fluorometer (e.g., Qubit) and spectrophotometer (e.g., NanoDrop), with a 260/280 ratio of ~1.8 considered acceptable [14]. The use of characterized reference materials, such as the NML metagenomic control materials (MCM2α/MCM2β) and WHO international reference reagents, is critical for validating and monitoring extraction efficiency, PCR bias, and sequencing accuracy [24].
PCR Amplification and Primer Selection
Primer selection is a critical source of bias in 16S rRNA gene sequencing. A 2025 study on oropharyngeal swabs demonstrated that using a more degenerate primer (27F-II) instead of the standard ONT 27F primer (27F-I) resulted in significantly higher alpha diversity and taxonomic profiles that correlated more strongly with large-scale reference datasets (Pearson’s r = 0.86 vs. r = 0.49) [10]. The degenerate primer reduced underrepresentation of key genera like Prevotella and Porphyromonas [10]. Libraries are typically prepared using the ONT 16S Barcoding Kit (e.g., SQK-16S024 or SQK-16S114.24) according to the manufacturer's protocol, allowing for multiplexing of up to 24 samples per run [14].
Sequencing and Bioinformatics
Sequencing is performed on ONT GridION or MinION devices using R10.3 or R10.4.1 flow cells, which have improved homopolymer calling and accuracy [14] [55]. The "high-accuracy" basecalling model (e.g., Guppy or Dorado) is used during sequencing [14] [55]. For analysis, the SmartGene IDNS software with its proprietary 16S Centroid database provides an automated, clinically-validated solution. The pipeline involves quality filtering of reads, BLAST search against the curated database, and identification of the dominant organism(s) [14]. This integrated bioinformatic solution is a key component for standardizing analysis in a diagnostic setting.
The Scientist's Toolkit: Essential Research Reagents
The following table details key reagents and materials required for establishing a robust clinical 16S ONT sequencing workflow, as cited in the referenced studies.
Table 2: Essential Research Reagents for Clinical 16S ONT Sequencing
| Item | Function | Example Products & Specifications |
|---|---|---|
| DNA Extraction Kit | Obtains high-purity, inhibitor-free genomic DNA from bacterial isolates. | Quick-DNA Fungal/Bacterial Miniprep Kit (Zymo Research) [14] |
| Reference Control Materials | Validates and monitors performance of the entire workflow (extraction to sequencing). | NML MCM2α/β (Metagenomic Control Material) [24]; WHO WC-Gut RR (Whole Cell Reference Reagent) [24] |
| PCR & Barcoding Kit | Amplifies the full-length 16S gene and attaches unique sample barcodes for multiplexing. | 16S Barcoding Kit 1-24 (SQK-16S024) or 24 V14 (SQK-16S114.24), Oxford Nanopore Technologies [14] [55] |
| Degenerate Primers | Reduces amplification bias by accounting for sequence variation in primer-binding sites. | 27F-II primer (highly degenerate forward primer) [10] |
| Sequencing Flow Cell | The consumable device where nanopore sequencing occurs. | FLO-MIN111 (R10.3 or R10.4.1 chemistry) [14] [55] |
| Bioinformatic Database | Curated reference database for accurate taxonomic classification of sequencing reads. | SmartGene 16S Centroid database [14]; SILVA 138.1 prokaryotic SSU database [55] |
The comparative data clearly indicates that Oxford Nanopore sequencing presents a compelling alternative to Sanger sequencing for 16S rRNA-based bacterial identification in clinical and diagnostic settings. The primary advantages of ONT include a significant reduction in cost-per-test and shorter turnaround times without increasing hands-on time, all while providing higher taxonomic resolution through full-length gene sequencing [14].
The transition to ONT requires careful attention to standardization. Success hinges on several factors: using degenerate primers to minimize amplification bias [10], implementing a rigorous quality control framework with appropriate reference materials [24], and employing validated bioinformatic pipelines for consistent data analysis [14]. For clinical applications, the ability of ONT to resolve polymicrobial infections—a known limitation of Sanger sequencing—is a particularly powerful advancement [24].
In conclusion, for clinical laboratories looking to optimize for cost, throughput, and speed without sacrificing diagnostic accuracy, long-read 16S rRNA sequencing via Oxford Nanopore is a viable and superior technology. Future developments in sequencing chemistry and bioinformatics will further solidify its role in modern clinical microbiology.
Evidence-Based Comparisons: Measuring Performance in Mock Communities and Complex Samples
This guide provides an objective comparison of the performance of full-length versus partial 16S rRNA gene sequencing in microbiome research. Through a systematic evaluation of data derived from mock microbial communities and in silico experiments, we quantify the accuracy, sensitivity, and taxonomic resolution of each approach. The analysis confirms that full-length 16S rRNA gene sequencing consistently outperforms partial gene analysis by providing superior species-level discrimination, while also highlighting specific sub-regions, such as V1-V3, that offer a practical compromise when technological constraints favor short-read platforms. Supporting experimental data and detailed methodologies are presented to equip researchers with evidence-based criteria for selecting appropriate sequencing strategies for their specific applications.
The 16S ribosomal RNA (rRNA) gene has served as the cornerstone of bacterial identification and microbiome analysis for decades, owing to its presence in all bacteria, its highly conserved structure interspersed with variable regions, and its well-curated reference databases [56]. However, the rapid evolution of sequencing technologies and analytical pipelines has created a landscape with myriad choices, each with distinct performance characteristics. Mock microbial communities, which are synthetic mixes of known bacterial strains with predefined abundances, provide an essential benchmark tool for quantifying the accuracy and sensitivity of these different methodological approaches [57] [58]. By comparing the theoretical composition of a mock community to the observed sequencing results, researchers can objectively measure the false positive rates, taxonomic depth, and quantitative bias introduced by a given workflow.
The central compromise in 16S rRNA sequencing has historically been between sequencing the full-length (~1500 bp) gene and targeting shorter hypervariable sub-regions (e.g., V1-V2, V3-V4, V4). This guide frames this compromise within the broader thesis of comparing full-length and partial 16S rRNA sequencing, using data from controlled benchmarking studies to determine which approach offers the most reliable path to accurate microbial community analysis.
Quantitative Performance Comparison: Full-Length vs. Partial 16S Sequencing
Data compiled from multiple benchmarking studies using mock communities reveal consistent performance differences between full-length and partial 16S rRNA gene sequencing.
Table 1: Comparative Performance of Full-Length vs. Partial 16S rRNA Sequencing
| Sequencing Approach | Species-Level Resolution | Quantitative Accuracy | Key Advantages | Primary Limitations |
|---|---|---|---|---|
| Full-Length 16S (V1-V9) | High (Nearly 100% in silico classification of species) [4] | High (Superior correlation with expected abundance) [59] | Maximum discriminatory power; enables strain-level analysis via intragenomic variant detection [4] | Higher cost; lower throughput; requires third-generation sequencing (PacBio, Oxford Nanopore) [6] |
| V1-V3 Region | Moderate-High (Closest to full-length performance for skin & oral microbiomes) [6] [60] | Moderate (Varies by taxonomic group) [60] | A practical balance of resolution and cost; works well with short-read platforms [6] | Resolution not uniform across all bacterial phyla [4] |
| V3-V4 Region | Moderate (Widely used but limited species-level power) [4] [59] | Variable (Prone to bias for specific taxa like Bifidobacterium & Akkermansia) [60] | Standardized Illumina protocol; good for genus-level profiling [17] [60] | Poor resolution for specific genera (Clostridium, Staphylococcus); can misrepresent abundance [60] [59] |
| V4 Region | Low (56% of in silico amplicons failed species-level classification) [4] | Moderate | Short amplicon; cost-effective for large-scale genus-level studies [6] | Lowest species-level discriminatory power; misses key polymorphisms [4] |
The limitations of short-read sequencing extend beyond the selection of a single hypervariable region. One study noted that "even with full 16S gene sequencing, limitations arise in achieving 100% taxonomic resolution at the species level for skin samples," highlighting a universal challenge in microbiome analysis [6]. Furthermore, the presence of multiple, slightly different copies of the 16S rRNA gene within a single genome (intragenomic variation) can complicate strain-level analysis. Full-length sequencing is uniquely positioned to resolve these subtle nucleotide substitutions, thereby turning a potential confounder into a source of discriminatory power [4].
Experimental Protocols for Benchmarking 16S rRNA Sequencing Methods
Protocol 1: In Silico Extraction and Comparison of 16S Sub-regions
This computational methodology, used to compare the taxonomic resolution of full-length 16S sequences against derived sub-regions, involves a defined multi-step process.
- Step 1: Full-Length Sequencing and Data Generation. Researchers first sequence the full-length 16S rRNA gene (V1-V9) from a set of samples (e.g., 141 skin microbiota samples from multiple anatomical sites) using a long-read platform like PacBio Sequel II. The circular consensus sequencing (CCS) protocol is employed with a minimum of 5 passes and a minimum predicted accuracy of 0.99 to generate high-quality reads [6].
- Step 2: In Silico Amplification. The full-length sequences are processed computationally ("in silico") to extract specific hypervariable regions. This is achieved by applying an algorithm that uses primer binding sites for common primer pairs (e.g., for V1-V2, V1-V3, V3-V4, V4, V5-V9) to trim the full-length sequences into in silico amplicons. A tolerance setting for primer matching is implemented to account for sequence variations [6].
- Step 3: Taxonomic Classification and Comparison. The derived sub-region amplicons and the original full-length sequences are classified using a common bioinformatics pipeline (e.g., QIIME) and a reference database (e.g., SILVA, Greengenes). The classification efficiency is then compared across all versions of the data, measuring the frequency of accurate species-level classification and the number of operational taxonomic units (OTUs) or amplicon sequence variants (ASVs) generated by each approach [6] [4].
Protocol 2: Wet-Lab Validation with a Staggered Mock Community
This experimental protocol uses a commercially available, staggered mock community to quantitatively assess sequencing accuracy and sensitivity in a controlled setting.
- Step 1: Mock Community Selection. A standardized mock community is procured, such as the BEI Resources HM-783D, which contains genomic DNA from 20 bacterial species with known, staggered abundances of 16S rRNA gene operons (from 10^3 to 10^6). This staggered design allows for evaluating sensitivity across a dynamic range of abundances [58].
- Step 2: Library Preparation and Sequencing. The same mock community DNA is used to generate sequencing libraries for both full-length and partial 16S rRNA gene analyses. For full-length sequencing, libraries are prepared using a protocol like the Oxford Nanopore 16S Barcoding Kit, often with optimized, degenerate primers to mitigate amplification bias against certain taxa (e.g., Bifidobacterium) [59]. For partial gene sequencing, regions like V1-V2 and V3-V4 are amplified using platform-specific primers (e.g., for Illumina MiSeq) [60].
- Step 3: Bioinformatic and Quantitative Analysis. The resulting sequencing data from all platforms and regions are processed through standardized bioinformatics pipelines (e.g., QIIME1, QIIME2, VSEARCH). The observed taxonomic composition and relative abundances are directly compared to the known, expected composition of the mock community. Key metrics include the rate of false positives/negatives, the accuracy of species-level identification, and the correlation between expected and observed abundances for each taxon, which can be further validated with quantitative PCR (qPCR) [60] [58].
The following diagram illustrates the logical workflow common to these benchmarking experiments:
Diagram 1: Generalized Workflow for Benchmarking 16S rRNA Sequencing Methods. This flowchart outlines the key stages in a comparative performance study, from sample preparation to final data interpretation.
Successful benchmarking requires carefully selected reagents and tools. The table below details key solutions used in the featured experiments.
Table 2: Key Research Reagent Solutions for 16S rRNA Benchmarking Studies
| Item | Function in Experiment | Specific Example & Application Notes |
|---|---|---|
| Staggered Mock Community | Serves as a ground-truth standard with known composition and abundance for quantifying accuracy and sensitivity. | BEI Resources HM-783D [58]. Essential for calculating error rates and detecting quantitative bias across the dynamic range. |
| Optimized/Degenerate Primers | PCR amplification of target 16S regions with reduced taxonomic bias, improving coverage of diverse taxa. | Degenerate 27F-II primer for full-length sequencing, which corrects for underrepresentation of Bifidobacterium and other taxa [10] [59]. |
| Third-Generation Sequencing Kits | Library preparation for long-read, full-length 16S rRNA gene sequencing. | Oxford Nanopore's 16S Barcoding Kit (SQK-RAB204) or PacBio SMRTbell kits for circular consensus sequencing (CCS) [6] [59]. |
| Curated Reference Databases | Used for taxonomic classification of sequence reads; their quality and scope directly impact resolution. | SILVA, Greengenes, and RDP databases. Smaller, highly curated databases like RDP can improve species-level accuracy [57] [58]. |
| Bioinformatics Pipelines | Processing raw sequences into analyzed data, including quality filtering, denoising, and taxonomic assignment. | QIIME 1/2, VSEARCH, and SPINGO (a species-level classifier). Pipeline choice significantly affects results, especially for short-read data [57] [58]. |
The collective evidence from benchmarking studies using mock communities provides a clear, data-driven hierarchy for 16S rRNA sequencing. Full-length 16S rRNA gene sequencing stands out as the unequivocal leader for applications demanding the highest possible taxonomic resolution, including species and strain-level discrimination. For large-scale studies where cost and throughput are primary constraints, targeting the V1-V3 hypervariable region with short-read platforms emerges as the most robust partial-gene alternative, offering a resolution that most closely approximates full-length sequencing for many microbiomes [6].
Future developments in this field will likely focus on reducing the cost and increasing the throughput of long-read sequencing technologies, making full-length analysis the universal standard. Concurrently, continued refinement of bioinformatics pipelines and reference databases is critical for unlocking the full potential of existing data, particularly for improving species-level classification from both long and short reads [58]. By grounding platform selection in empirical benchmarking data, researchers can ensure that their methodological choices are aligned with their biological questions, ultimately leading to more accurate and meaningful insights into the microbial world.
The selection of specific 16S rRNA hypervariable regions for microbiome studies remains unstandardized, presenting researchers with critical methodological choices that directly impact taxonomic resolution and biological interpretation [6]. While full-length 16S rRNA gene sequencing using third-generation sequencing platforms provides maximum discriminatory power, practical constraints often necessitate the use of specific variable regions with short-read sequencing technologies [6] [17]. This comprehensive analysis synthesizes experimental evidence comparing the performance of the V1-V3, V3-V4, and V4 regions against the gold standard of full-length V1-V9 sequencing, providing researchers with objective data to inform their experimental design decisions across various sample types and research objectives.
The inherent compromise in targeting sub-regions represents a historical constraint of short-read sequencing technologies [4]. As the field progresses toward full-length sequencing enabled by third-generation platforms, understanding the precise strengths and limitations of each variable region becomes increasingly important for both interpreting existing literature and designing future studies [7] [4]. This review integrates evidence from multiple experimental comparisons to establish a framework for selecting the most appropriate 16S rRNA gene target based on specific research requirements, sample types, and technical constraints.
Comparative Performance of 16S rRNA Gene Regions
Taxonomic Resolution Across Variable Regions
Table 1: Taxonomic Resolution Capabilities of Different 16S rRNA Gene Regions
| 16S Region | Species-Level Resolution | Genus-Level Resolution | Notable Taxonomic Biases | Recommended Applications |
|---|---|---|---|---|
| Full-Length (V1-V9) | Superior (74.14% of reads assigned to species) [7] | Excellent (95.06% of reads assigned) [7] | Minimal bias across taxa [4] | Reference standard; when maximal resolution is critical |
| V1-V3 | Moderate to high (closest to full-length performance) [6] [4] | Good (comparable to full-length for high-abundance bacteria) [6] | Reduced effectiveness for Proteobacteria [4] | Skin microbiome [6]; Escherichia/Shigella detection [4] |
| V3-V4 | Moderate | Good | Poor performance for Actinobacteria [4] | Illumina sequencing standard; general microbiota surveys |
| V4 | Limited (56% fail species-level classification) [4] | Good | Strong bias against multiple taxa [4] [60] | High-throughput studies where cost outweighs resolution needs |
| V5-V9 | Variable | Moderate | Best for Clostridium and Staphylococcus [4] | Targeted studies of specific Gram-positive pathogens |
Experimental evidence consistently demonstrates that sequencing the full-length 16S rRNA gene provides superior taxonomic resolution compared to any single variable region. One critical study found that with full-length sequencing, 74.14% of reads could be assigned to the species level, compared to only 55.23% with V3-V4 region sequencing [7]. The limitation of sub-regions is particularly pronounced for the V4 region, which failed to provide accurate species-level classification for 56% of in-silico amplicons in a systematic evaluation [4].
Different variable regions exhibit distinct taxonomic biases that significantly influence observed community composition. For instance, the V1-V2 region performs poorly at classifying sequences belonging to the phylum Proteobacteria, while the V3-V5 region shows limitations with Actinobacteria [4]. These biases have practical implications, as demonstrated in a study of Japanese gut microbiota where the V3-V4 region detected significantly higher relative abundances of Bifidobacterium and Akkermansia compared to the V1-V2 region, with quantitative PCR validation revealing that the V1-V2 data more closely approximated the actual abundance of Akkermansia [60].
Region-Specific Performance Across Sample Types
Table 2: Optimal Region Selection by Sample Type and Research Goal
| Sample Type | Recommended Region | Experimental Evidence | Key Considerations |
|---|---|---|---|
| Skin Microbiome | V1-V3 or Full-Length | V1-V3 offered resolution comparable to full-length 16S [6] | Even full-length cannot achieve 100% species-level resolution for skin |
| Human Gut Microbiome | V1-V2 or Full-Length | V1-V2 more accurately reflected actual abundance for key taxa [60] | V3-V4 overrepresented Bifidobacterium and Akkermansia |
| Oral Microbiome | V1-V3 or Full-Length | V1-V3 more suitable than V3-V4 for oral sites [60] | High microbial density requires careful primer selection |
| Clinical Diagnostics | Full-Length or V1-V3 | Full-length enables species and strain-level discrimination [4] | Critical for identifying pathogenic species in mixed samples |
| Environmental Samples | V3-V4 or V4 | Balance between diversity coverage and cost [61] | Lower biomass may favor more conserved regions |
The optimal variable region selection is highly dependent on the sample type being studied. For skin microbiome research, the V1-V3 region provides a particularly favorable balance between taxonomic resolution and practical considerations, delivering resolution comparable to full-length 16S sequencing while being more accessible for laboratories with limited sequencing resources [6]. This represents a significant finding for dermatological and forensic applications where skin microbiota analysis is particularly relevant.
For gut microbiome studies, evidence suggests that the V1-V2 region with modified primers (27Fmod) provides more accurate representation of certain bacterial populations compared to the more commonly used V3-V4 region. A comprehensive comparison of fecal samples from 192 Japanese volunteers revealed that the V3-V4 region overrepresented Bifidobacterium and Akkermansia compared to quantitative PCR results, while the V1-V2 region more closely approximated actual abundances [60].
In clinical diagnostic applications, the superior resolution of full-length 16S sequencing demonstrates tangible benefits. One study comparing Sanger sequencing with Oxford Nanopore Technologies sequencing of the 16S rRNA gene found that the long-read approach identified clinically relevant pathogens in 72% of samples compared to 59% with Sanger sequencing, and was particularly valuable for detecting multiple bacterial species in polymicrobial infections [38].
Experimental Protocols and Methodological Considerations
Standardized Experimental Workflow
Figure 1: Standardized experimental workflow for 16S rRNA gene comparative studies, highlighting key methodological decision points that impact taxonomic profiling results.
Detailed Methodological Protocols
Full-Length 16S rRNA Gene Sequencing (PacBio Platform)
The full-length 16S rRNA gene amplification typically employs primers 27F (AGRGTTTGATYNTGGCTCAG) and 1492R (TASGGHTACCTTGTTASGACTT) in a PCR reaction system consisting of 15 µL KOD One PCR Master Mix, 3 µL mixed PCR primers, 1.5 µL genomic DNA, and 10.5 µL nuclease-free water, with a total volume of 30 µL [6]. Cycling conditions include an initial denaturation at 95°C for 2 minutes, followed by 25 cycles of denaturation at 98°C for 10 seconds, annealing at 55°C for 30 seconds, extension at 72°C for 90 seconds, and a final extension at 72°C for 2 minutes [6]. Post-amplification, processing includes damage repair, end repair, and adapter ligation via the SMRTbell Template Prep Kit, with purification using AMPure PB magnetic beads [6]. The library is sequenced on the PacBio Sequel II system, and data analysis is facilitated by SMRT Link Analysis software, converting sequencer-generated BAM files into CCS sequence files with stringent parameters (minimum number of passes ≥5, minimum predicted accuracy ≥0.99) [6].
V4 Region Sequencing (Illumina Platform)
For V4 region sequencing, the hypervariable V4 region is typically amplified using forward primer 515F (5′-GTGCCAGCMGCCGCGGTAA-3′) and reverse primer 806R (5′-GGACTACHVGGGTWTCTAAT-3′) [32]. The cycling conditions consist of an initial denaturation of 94°C for 3 minutes, followed by 25 cycles of denaturation at 94°C for 45 seconds, annealing at 50°C for 60 seconds, extension at 72°C for 5 minutes, and a final extension at 72°C for 10 minutes [32]. Sequencing is performed using the Illumina MiSeq platform generating paired-end reads of 175 bp in length in each direction, with overlapping paired-end reads subsequently aligned [32].
In Silico Extraction of Variable Regions
To enable direct comparison between full-length and sub-region sequencing, variable regions can be extracted in silico from full-length 16S rRNA sequences through a computational process guided by PCR primer binding sites commonly used in microbiome research [6]. This approach begins with cataloging all possible primer pair combinations located in the conserved regions flanking target variable regions, aligning these primer pairs with the full-length 16S rRNA gene sequence, and extracting sequences encapsulated by these primer pairs while implementing appropriate tolerance settings for primer matching [6].
Technical Benchmarking and Analytical Approaches
Bioinformatics Processing Pipeline
Figure 2: Bioinformatics processing pipeline for 16S rRNA sequencing data, highlighting critical methodological choice points that impact downstream results and interpretation.
The Scientist's Toolkit: Essential Research Reagents and Materials
Table 3: Essential Research Reagents and Materials for 16S rRNA Gene Sequencing Studies
| Category | Specific Products/Protocols | Function/Application | Technical Considerations |
|---|---|---|---|
| DNA Extraction Kits | PowerSoil DNA Isolation Kit [6]; DNeasy PowerSoil Kit [60]; Quick-DNA HMW MagBead Kit [10] | Microbial DNA isolation from complex samples | Bead-beating enhances lysis of tough cells; kit choice affects yield and quality |
| PCR Enzymes | KOD One PCR Master Mix [6]; KAPA HiFi HotStart Ready Mix [60]; Herculase II Taq polymerase [32] | Amplification of 16S rRNA gene regions | High-fidelity enzymes reduce amplification errors |
| Universal Primers | 27F/1492R (full-length) [6] [7]; 27Fmod/338R (V1-V2) [60]; 341F/805R (V3-V4) [60]; 515F/806R (V4) [32] | Target-specific amplification of 16S regions | Primer degeneracy impacts taxonomic coverage [10] |
| Library Prep Kits | SMRTbell Template Prep Kit (PacBio) [6]; Nextera XT Index Kit (Illumina) [60] | Sequencing library preparation | Platform-specific requirements |
| Purification Methods | AMPure PB beads [6]; AMPure XP beads [32] | Size selection and purification | Magnetic bead-based cleanup |
| Sequencing Platforms | PacBio Sequel II [6] [7]; Illumina MiSeq [60] [32]; Oxford Nanopore GridION/MinION [38] [10] | High-throughput DNA sequencing | Platform selection dictates read length and accuracy |
| Bioinformatics Tools | QIIME1/QIIME2 [60]; DADA2 [62] [60]; UPARSE [62]; SILVA/Green genes databases [60] [32] | Data processing and taxonomic classification | Algorithm choice affects OTU/ASV formation [62] |
Discussion and Research Recommendations
The collective evidence demonstrates that while full-length 16S rRNA gene sequencing provides superior taxonomic resolution, targeted variable regions remain practically useful depending on research objectives, sample types, and technical constraints. The V1-V3 region emerges as a strong compromise, offering resolution closest to full-length sequencing for many applications, particularly for skin microbiome studies [6]. However, researchers must remain cognizant of the taxonomic biases inherent in each region, as these can significantly impact biological interpretations [4] [60].
Future methodological development should focus on standardizing protocols across platforms and establishing niche-specific best practices. The emergence of more accurate long-read sequencing technologies promises to make full-length 16S rRNA gene sequencing increasingly accessible, potentially rendering regional comparisons obsolete [7] [4]. Until that transition is complete, careful selection of 16S rRNA gene target regions, informed by empirical comparisons and tailored to specific research questions, remains essential for generating meaningful, reproducible microbiome data.
For researchers designing 16S rRNA sequencing studies, the following evidence-based recommendations are proposed:
When maximal resolution is essential: Utilize full-length 16S rRNA gene sequencing with PacBio circular consensus sequencing or improved nanopore chemistry, particularly for clinical diagnostics or strain-level discrimination [38] [4].
For skin microbiome studies: Prioritize the V1-V3 region, which provides resolution comparable to full-length sequencing while being more accessible for laboratories with limited resources [6].
In large-scale gut microbiome studies: Consider the V1-V2 region with modified primers (27Fmod) for more accurate representation of key taxa, particularly when studying Bifidobacterium or Akkermansia [60].
When comparing across studies: Account for region-specific biases in taxonomic representation and avoid overinterpreting differences that may reflect methodological rather than biological variation [4] [60].
For novel microbial communities: Conduct pilot comparisons using multiple regions or full-length sequencing to establish region-specific biases before launching large-scale studies.
Accurate identification of bacterial pathogens to the species level is a critical requirement in clinical diagnostics and microbial ecology research. Clinically critical genera such as Streptococcus and Escherichia/Shigella present significant challenges for taxonomic resolution due to their high genetic similarity within species groups [63]. The 16S rRNA gene has served as the cornerstone molecular marker for bacterial identification for decades, yet the choice of sequencing approach—targeting specific hypervariable regions versus sequencing the full-length gene—profoundly impacts the resolution achievable for these challenging taxa [4].
This case study objectively compares the performance of full-length versus partial 16S rRNA sequencing technologies, focusing specifically on their ability to resolve Streptococcus and Escherichia/Shigella to the species level. Within the broader thesis of 16S sequencing approaches, we provide experimental data and performance metrics to guide researchers and drug development professionals in selecting appropriate methodologies for their specific applications.
Technical Comparison of 16S rRNA Sequencing Approaches
Fundamental Technological Differences
The 16S rRNA gene spans approximately 1,550 base pairs and contains nine variable regions (V1-V9) interspersed with conserved regions [4]. Partial 16S sequencing, typically performed on Illumina platforms, targets specific hypervariable regions (e.g., V3-V4, V4, V1-V3) due to read length limitations (≤300 bases) [4]. In contrast, full-length 16S sequencing, enabled by third-generation sequencing platforms like PacBio and Oxford Nanopore Technologies (ONT), captures the entire gene sequence in a single read [6] [11].
The historical preference for partial region sequencing represents a technological compromise rather than a biological ideal, primarily driven by the cost-effectiveness and higher throughput of short-read sequencing platforms [4]. However, this approach necessarily sacrifices phylogenetic information contained in the non-targeted variable regions, potentially limiting discrimination between closely related species.
Experimental Workflows
The experimental workflow for full-length 16S sequencing shares initial steps with partial region approaches but diverges in library preparation and sequencing phases:
Sample Collection and DNA Extraction: The initial phase is identical across approaches, requiring meticulous collection of microbial samples and extraction of high-quality genomic DNA using commercial kits such as the PowerSoil DNA Isolation Kit [6].
PCR Amplification: This critical step diverges based on the target region. Full-length 16S amplification employs primers 27F (AGRGTTTGATYNTGGCTCAG) and 1492R (TASGGHTACCTTGTTASGACTT) that flank the entire gene [6]. For partial regions, primer selection is tailored to specific variable regions; for example, the V1-V3 region may be targeted for skin microbiome studies [6].
Library Preparation and Sequencing: Full-length approaches require specialized library prep kits compatible with long-read technologies (e.g., SMRTbell Template Prep Kit for PacBio or SQK-16S024 for ONT) [6] [64]. Notably, ONT protocols may increase PCR cycles to 35 to enhance sensitivity when bacterial DNA is scarce [64]. PacBio sequencing utilizes Circular Consensus Sequencing (CCS) with minimum passes (≥5) and accuracy thresholds (≥0.99) to achieve high-fidelity reads [6] [4].
Bioinformatic Analysis: Full-length sequences are typically analyzed with tools like Emu, NanoCLUST, or Epi2me, with Emu demonstrating superior performance in clinical samples [64] [11]. DADA2 is commonly used for Illumina-derived partial sequences but is less effective for ONT data due to higher error rates [11].
Performance Comparison for Clinically Critical Genera
Quantitative Resolution Capabilities
Table 1: Comparative Performance of 16S Sequencing Approaches for Species-Level Identification
| Sequencing Approach | Species-Level ID Rate | Streptococcus Resolution | Escherichia/Shigella Resolution | Key Limitations |
|---|---|---|---|---|
| Full-Length 16S (PacBio/Nanopore) | 87.5-92.5% [63] [65] | Distinguishes S. oralis, S. mitis, S. vestibularis [65] | Differentiates E. coli from Shigella species [63] | Cannot resolve 100% of species due to identical 16S in some taxa [6] |
| Partial 16S (V1-V3 region) | Moderate (best among sub-regions) [6] | Limited species discrimination [4] | Reasonable discrimination [4] | Reduced resolution compared to full-length [6] |
| Partial 16S (V4 region) | Poor (56% failure rate) [4] | Cannot distinguish closely related species [4] | Cannot distinguish closely related species [4] | Worst-performing single region [4] |
| Sanger 16S Sequencing | 56.7% [65] | Limited species discrimination [65] | Limited species discrimination [65] | Low throughput, challenging for polymicrobial samples [65] |
Experimental Evidence for Streptococcus and Escherichia/Shigella Resolution
Streptococcus Species Resolution: The Streptococcus genus contains numerous clinically important species that are difficult to distinguish using partial 16S sequencing. Experimental data demonstrates that full-length 16S-23S rRNA region sequencing correctly identified Streptococcus oralis, Streptococcus mitis, and Streptococcus vestibularis to species level, while other methods (including partial 16S sequencing and mass spectrometry) failed to provide species-level discrimination [65]. This enhanced resolution is clinically significant as different Streptococcus species exhibit varying pathogenic potential and antibiotic susceptibility profiles.
Escherichia/Shigella Complex Resolution: The Escherichia/Shigella complex presents particular challenges due to high genetic similarity. Research shows that the V1-V3 region provides reasonable discrimination for Escherichia/Shigella [4], but full-length 16S sequencing achieves more reliable differentiation [63]. In a comprehensive evaluation of 617 clinical isolates, full-length 16S sequencing demonstrated 87.5% species-level concordance with reference methods, successfully resolving these clinically critical taxa [63].
Beyond Species-Level: Strain Discrimination: Recent advances have revealed that full-length 16S sequencing can potentially discriminate between strains within a single species by detecting intragenomic copy variants [4]. PacBio Circular Consensus Sequencing has demonstrated sufficient accuracy to resolve single-nucleotide substitutions between intragenomic 16S copies, which can serve as strain-specific markers [4]. This capability has profound implications for tracking outbreaks and investigating strain-specific pathogenicity.
Diagnostic and Therapeutic Applications
Clinical Diagnostic Performance
The enhanced resolution of full-length 16S sequencing translates to tangible improvements in clinical diagnostics:
Table 2: Clinical Performance of Full-Length 16S Sequencing in Diagnostic Settings
| Sample Type | Performance Metrics | Advantages over Conventional Methods |
|---|---|---|
| Normally Sterile Body Fluids | 97.7% correct identification in monomicrobial samples; 81.7% in polymicrobial samples [64] | Identifies pathogens missed by culture; detects mixed infections |
| Urine Samples | Identified causative pathogens in 29 of 30 clinically significant UTI samples [65] | Detects fastidious organisms; identifies multiple pathogens in mixed infections |
| Blood Cultures | 100% concordance with culture for 20 of 23 samples; improved species identification in 3 samples [65] | Faster identification (preliminary results within 6 hours) [64] |
| Colorectal Cancer Screening | Identified 8 specific bacterial biomarkers (e.g., Fusobacterium nucleatum) [11] | Enables non-invasive cancer detection; reveals potential therapeutic targets |
Impact on Therapeutic Development
The increased resolution of full-length 16S sequencing opens new frontiers in therapeutic development:
Targeted Live Biotherapeutics: Full-length 16S sequencing enables precise characterization of microbial strains for live biotherapeutic products, ensuring correct identification of strains with therapeutic potential [66]. This precision was critical in the development of SER-109, the first FDA-approved oral microbiome therapy for recurrent C. difficile infection [66].
Microbial Biomarker Discovery: In oncology, full-length 16S sequencing has identified specific bacterial strains associated with colorectal and pancreatic cancers [66]. This has facilitated the discovery of microbial biomarkers for early cancer detection and novel therapeutic approaches targeting cancer-associated microbes.
Antibiotic Resistance Management: Strain-level sequencing helps track the emergence and spread of antibiotic resistance genes within bacterial populations, informing smarter antibiotic stewardship strategies [66].
Gut-Brain Axis Research: Preliminary research has linked specific bacterial strains to mental health conditions through the gut-brain axis, with potential implications for developing microbiome-based therapies for neuropsychiatric disorders [66].
The Scientist's Toolkit: Essential Research Reagents
Table 3: Essential Research Reagents for Full-Length 16S rRNA Gene Sequencing
| Reagent/Kit | Function | Application Notes |
|---|---|---|
| PowerSoil DNA Isolation Kit | Genomic DNA extraction from microbial samples | Effective for diverse sample types; minimizes inhibitor co-extraction [6] |
| 16S Barcoding Kit (SQK-16S024) | Library preparation for Nanopore sequencing | Includes primers for full-length 16S amplification; barcoding enables multiplexing [64] |
| SMRTbell Template Prep Kit | Library preparation for PacBio sequencing | Designed for long-read sequencing; facilitates circular consensus sequencing [6] |
| KOD One PCR Master Mix | High-fidelity PCR amplification | Reduces PCR errors in full-length 16S amplification [6] |
| QIAamp BiOstic Bacteremia DNA Kit | DNA extraction from blood cultures | Optimized for low-biomass clinical samples [64] |
This case study demonstrates that full-length 16S rRNA sequencing significantly outperforms partial region sequencing for resolving clinically critical genera such as Streptococcus and Escherichia/Shigella to species level. While partial regions like V1-V3 provide the best compromise among sub-regions for these taxa, they cannot match the discriminatory power of the complete gene sequence [6] [4].
The technological advancement represented by full-length 16S sequencing has transcended historical compromises forced by sequencing platform limitations, enabling researchers and clinicians to achieve species-level resolution rates of 87.5-92.5% compared to 56.7% with conventional Sanger sequencing of the 16S gene [63] [65]. This enhanced resolution directly impacts patient care through improved pathogen identification and opens new avenues for therapeutic development via strain-level microbiome analysis.
As sequencing technologies continue to evolve, with both PacBio and Oxford Nanopore platforms achieving progressively higher accuracy and throughput, full-length 16S sequencing is poised to become the gold standard for clinical microbial identification and complex microbiome studies where species- and strain-level discrimination is critical.
The choice of sequencing platform is a foundational decision in 16S rRNA-based microbiome studies, directly influencing the resolution, accuracy, and biological interpretation of the results. The central challenge lies in the technological compromise between short-read sequencing of hypervariable regions and long-read sequencing of the full-length gene. Illumina platforms have been the workhorse for years, offering high accuracy and throughput for genus-level analysis. In contrast, third-generation sequencers from PacBio and Oxford Nanopore Technologies (ONT) promise species- and strain-level resolution by sequencing the entire ~1500 bp 16S rRNA gene. This guide provides an objective, data-driven comparison of these platforms, correlating their outputs with expected outcomes to inform researchers and drug development professionals.
Performance Comparison: Quantitative Data Synthesis
Data from controlled studies reveal distinct performance profiles for each platform. The table below summarizes key metrics for comparing Illumina, PacBio, and ONT in 16S rRNA sequencing.
Table 1: Comparative Performance of 16S rRNA Sequencing Platforms
| Performance Metric | Illumina (e.g., MiSeq/NextSeq) | PacBio (Sequel II/IIe) | Oxford Nanopore (MinION) |
|---|---|---|---|
| Typical Target Region | V3-V4 (~460 bp) [18] | Full-length V1-V9 (~1,500 bp) [18] | Full-length V1-V9 (~1,500 bp) [18] |
| Average Read Length | 442 ± 5 bp (paired-end) [18] | 1,453 ± 25 bp [18] | 1,412 ± 69 bp [18] |
| Reported Error Rate | < 0.1% - 1% [67] [55] | ~0.1% (Q27) for HiFi reads [18] [67] | Historically 5-15%; now <1-2% with latest chemistry [67] [68] [55] |
| Species-Level Classification Rate | 47% [18] | 63% [18] | 76% [18] |
| Primary Advantage | High accuracy & read count for genus-level profiling [18] | High-fidelity full-length reads for species-level resolution [68] [4] | Longest reads, real-time analysis, portable form-factor [69] [55] |
| Primary Limitation | Limited species/strain resolution due to short reads [4] [55] | Lower throughput than Illumina; requires CCS for high accuracy [70] | Higher error rate requires specialized bioinformatics [18] [68] |
The data demonstrates a clear trade-off. While Illumina provides high accuracy for genus-level profiles, its species-level resolution is limited (47%) because short reads from a single hypervariable region lack sufficient discriminatory information [18] [4]. Sequencing the full-length 16S rRNA gene with third-generation technologies directly addresses this. PacBio HiFi sequencing, with its high accuracy, and ONT, with its rapidly improving basecalling, both show superior species-level classification (63% and 76%, respectively) [18]. A study on soil microbiomes further confirmed that PacBio and ONT produced comparable assessments of bacterial diversity, with PacBio showing a slight edge in detecting low-abundance taxa [68].
However, a critical finding from a rabbit gut microbiota study is that a significant portion of sequences classified at the species level were assigned ambiguous names like "uncultured_bacterium," underscoring that resolution is also limited by the completeness and curation of reference databases [18]. Furthermore, the choice of primers, especially for full-length sequencing, introduces significant bias. Studies on human fecal and oropharyngeal samples demonstrated that more degenerate primer sets (e.g., 27F-II) capture significantly higher microbial diversity and provide taxonomic profiles that better align with population-level reference data compared to standard primers [10] [67].
Experimental Protocols for Cross-Platform Validation
To ensure robust and comparable results, consistent and well-documented wet-lab and computational protocols are essential. The following workflow and detailed methodologies are synthesized from the cited comparison studies.
Sample Preparation and DNA Extraction
- Sample Collection: The starting material must be consistent. Studies used various sources, including soft feces from rabbits [18], oropharyngeal swabs from human donors [10], and soil samples from specific depths and locations [68]. Samples are typically immediately frozen at -80°C or placed in DNA/RNA shielding buffer.
- DNA Extraction: A standardized, high-quality extraction method is critical. Multiple studies used kits from Zymo Research (e.g., Quick-DNA Fecal/Soil Microbe Microprep Kit, PowerSoil Kit) to ensure high molecular weight DNA and reproducibility [18] [67] [68]. The extracted DNA should be quantified using a fluorometer (e.g., Qubit) and quality-checked via spectrophotometry (e.g., NanoDrop) or electrophoresis.
PCR Amplification and Library Preparation
This is a major source of bias, and protocols differ significantly by platform. Using the same DNA extract for all three platforms is essential for a valid comparison.
Illumina (Targeting V3-V4):
- Primers: 341F and 785R (or similar, as per Illumina's 16S Metagenomic Sequencing Library Preparation guide) [18] [55].
- Protocol: Amplify the ~460 bp V3-V4 region. PCR products are purified, and multiplexing is performed using a kit like the Nextera XT Index Kit. Sequencing is performed on platforms like MiSeq or NextSeq to generate 2x300 bp paired-end reads [18] [55].
PacBio (Full-Length):
- Primers: Universal primers 27F and 1492R, tailed with PacBio barcode sequences for multiplexing [18] [68].
- Protocol: PCR amplification is performed with a high-fidelity polymerase (e.g., KAPA HiFi) over 27-30 cycles. The amplified DNA is pooled equimolarly, and a library is prepared with the SMRTbell Express Template Prep Kit. Sequencing on the Sequel II system with a 10-hour movie time generates Circular Consensus Sequencing (CCS) reads, which are processed into high-fidelity (HiFi) reads [18] [68].
Oxford Nanopore (Full-Length):
- Primers: The standard primers 27F and 1492R are used, often provided in the ONT 16S Barcoding Kit [18] [10]. However, critical studies highlight that primer degeneracy significantly impacts results. A more degenerate variant (27F-II) has been shown to capture higher diversity and produce more accurate taxonomic profiles in both gut and oropharyngeal samples [10] [67].
- Protocol: The 16S rRNA gene is amplified using ~40 cycles with the barcoded primers. The PCR product is purified, quantified, and pooled. The library is loaded onto a flow cell (preferably R10.4.1 for higher accuracy) and sequenced on a MinION or GridION device [18] [55].
Bioinformatic Analysis
The higher error rates of long-read technologies, particularly ONT, necessitate specialized bioinformatics tools.
- Illumina & PacBio HiFi Data: These higher-accuracy reads can be processed using the DADA2 pipeline in R, which models and corrects amplicon errors to resolve single-nucleotide differences and generate Amplicon Sequence Variants (ASVs) [18] [4].
- ONT Data: The higher error rate and lack of internal redundancy make denoising with DADA2 challenging. ONT sequences are often analyzed using purpose-built pipelines like Emu [68] or Spaghetti [18], which employ different error-handling algorithms and often use an Operational Taxonomic Unit (OTU) clustering approach.
- Downstream Analysis: For a fair comparison, sequences from all platforms should be imported into a unified analysis environment like QIIME2 [18]. Taxonomic assignment is performed using a consistent classifier (e.g., a Naïve Bayes classifier trained on the SILVA database) and customized for each platform's specific primer sequences and read length [18] [55]. Diversity analysis (alpha and beta diversity) and differential abundance testing (e.g., with ANCOM-BC) are then performed to compare the microbial communities revealed by each platform [18] [55].
The Scientist's Toolkit: Essential Research Reagents
The following reagents and kits are fundamental for executing the experimental protocols described above.
Table 2: Essential Reagents and Kits for Cross-Platform 16S rRNA Sequencing
| Item | Function | Example Products & Kits |
|---|---|---|
| DNA Extraction Kit | Isolates high-quality genomic DNA from complex samples. | Zymo Research Quick-DNA Fecal/Soil Microbe Kits [67] [68], DNeasy PowerSoil Kit (QIAGEN) [18] |
| PCR Enzymes | Amplifies the target 16S rRNA region with high fidelity. | KAPA HiFi HotStart DNA Polymerase [18], LongAMP Taq Master Mix [67] |
| Illumina Kit | Prepares sequencing libraries for the V3-V4 hypervariable region. | Illumina 16S Metagenomic Sequencing Library Prep [18], QIAseq 16S/ITS Region Panel (Qiagen) [55] |
| PacBio Kit | Prepares libraries for full-length 16S sequencing. | SMRTbell Express Template Prep Kit 2.0/3.0 [18] [68] |
| ONT Kit | Prepares barcoded libraries for full-length 16S sequencing. | 16S Barcoding Kit (SQK-RAB204 or SQK-16S114) [18] [55] |
| Reference Database | Provides a curated set of sequences for taxonomic classification. | SILVA [18] [55], Greengenes [4] |
Correlating Platform Selection with Expected Research Outcomes
The choice of sequencing platform should be dictated by the specific research question. The diagram and points below summarize the decision-making logic.
Choose Illumina when the research objective is a large-scale, high-resolution survey of microbial communities at the genus level. Its high accuracy and throughput make it ideal for population-level studies where the goal is to correlate broad shifts in microbiota with health or disease states [70] [55]. The main compromise is the limited ability to resolve species and strains [4].
Choose PacBio HiFi when the primary goal is achieving the highest possible taxonomic resolution down to the species and strain level. Its high-fidelity full-length reads are superior for identifying subtle variations, detecting low-abundance taxa, and even resolving intragenomic 16S copy number variation, which can be informative for strain-level analysis [68] [4]. The compromise involves lower throughput and a higher cost per sample compared to Illumina [70].
Choose Oxford Nanopore when the application requires rapid turnaround time, real-time analysis, or portability. This is particularly valuable for clinical diagnostics, field studies, or when the experimental design benefits from immediate feedback [69] [55]. While its accuracy has historically been a limitation, the latest chemistries (R10.4.1 flow cells, Q20+ kits) have brought it closer to other platforms, though it still requires robust, specialized bioinformatics pipelines for optimal results [67] [68].
The comparison between Illumina, PacBio, and Nanopore platforms reveals a dynamic landscape where there is no single "best" technology, only the most appropriate one for a given research context. Illumina remains the most efficient tool for broad, genus-level profiling of large sample sets. In contrast, PacBio HiFi currently provides the most accurate path to species-level resolution via full-length 16S sequencing. Oxford Nanopore offers a unique value proposition with its real-time, portable sequencing capabilities, which are rapidly closing the gap in accuracy. Researchers must align their platform choice with their primary objective, whether it is breadth, depth, or speed, while carefully considering the associated experimental and computational protocols to ensure valid and impactful scientific outcomes.
Conclusion
The transition from partial to full-length 16S rRNA sequencing represents a paradigm shift in microbial community analysis, offering unprecedented species and strain-level resolution that is vital for advanced clinical diagnostics and therapeutic development. While partial regions like V1-V3 or V3-V4 provide a cost-effective solution for genus-level profiling, the methodological optimizations in primer design, library preparation, and bioinformatics now make full-length sequencing a robust and increasingly accessible option. The choice between these approaches must be guided by the specific research question, balancing the need for high taxonomic resolution against practical constraints. Future directions will see the increased integration of full-length 16S data with shotgun metagenomics and metabolomics, paving the way for a more holistic understanding of the microbiome's role in human health and disease, and accelerating the discovery of novel microbial biomarkers and therapeutic targets.
References
- 1. 16S ribosomal RNA [https://en.wikipedia.org/wiki/16S_ribosomal_RNA]
- 2. Performance and Application of 16S rRNA Gene Cycle ... [https://pmc.ncbi.nlm.nih.gov/articles/PMC7484979/]
- 3. Introduce to 16S rRNA and 16S rRNA Sequencing [https://www.cd-genomics.com/blog/introduce-to-16s-rrna-and-16s-rrna-sequencing/]
- 4. Evaluation of 16S rRNA gene sequencing for species and ... [https://www.nature.com/articles/s41467-019-13036-1]
- 5. A detailed analysis of 16S ribosomal RNA gene segments ... [https://pmc.ncbi.nlm.nih.gov/articles/PMC2562909/]
- 6. Comparison of the full-length sequence and sub-regions ... [https://pmc.ncbi.nlm.nih.gov/articles/PMC11264597/]
- 7. Full-length 16S rRNA gene sequencing by PacBio improves ... [https://bmcgenomics.biomedcentral.com/articles/10.1186/s12864-024-10213-5]
- 8. Comparative analysis of full-length 16s ribosomal RNA ... [https://www.frontiersin.org/journals/genetics/articles/10.3389/fgene.2023.1213829/full]
- 9. Performance of 16S rRNA Gene Next-Generation ... [https://www.mdpi.com/2075-4418/14/13/1318]
- 10. Comparative analysis of full-length 16s ribosomal RNA ... [https://www.frontiersin.org/journals/cellular-and-infection-microbiology/articles/10.3389/fcimb.2025.1658615/full]
- 11. Nanopore full length 16S rRNA gene sequencing ... [https://www.nature.com/articles/s41598-025-10999-8]
- 12. Evaluation of V3–V4 and FL-16S rRNA amplicon ... [https://pmc.ncbi.nlm.nih.gov/articles/PMC12379586/]
- 13. Rapid and reliable species-level identification from clinical ... [https://www.nature.com/articles/s41598-025-14071-3]
- 14. Evaluation of long-read 16S rRNA next-generation ... [https://pmc.ncbi.nlm.nih.gov/articles/PMC12077174/]
- 15. Next-Generation Sequencing in Drug Discovery Market ... [https://www.cervicornconsulting.com/next-generation-sequencing-in-drug-discovery-market]
- 16. 2025 and Beyond: The Future of Genomic Data Analysis ... [https://blog.crownbio.com/2025-and-beyond-the-future-of-genomic-data-analysis-and-innovations-in-genomics-services]
- 17. Advantages and Limitations of 16S rRNA Next-Generation ... [https://pmc.ncbi.nlm.nih.gov/articles/PMC7602188/]
- 18. Comparative analysis of Illumina, PacBio, and nanopore ... [https://www.frontiersin.org/journals/microbiomes/articles/10.3389/frmbi.2025.1587712/full]
- 19. Comparing long-read sequencing technologies [https://www.pacb.com/blog/sequencing-101-comparing-long-read-sequencing-technologies/]
- 20. PacBio vs Oxford Nanopore: Which Long-Read ... [https://www.cd-genomics.com/resource-pacbio-oxford-nanopore-comparison.html]
- 21. Kinnex kits enable full-length 16S and RNA sequencing at ... [https://www.pacb.com/blog/full-length-16s/]
- 22. Workflow overview: 16S sequencing [https://nanoporetech.com/resource-centre/workflow-16s-sequencing]
- 23. The applications and advantages of nanopore sequencing ... [https://www.nature.com/articles/s44259-025-00157-5]
- 24. Standardization of 16S rRNA gene sequencing using ... [https://pmc.ncbi.nlm.nih.gov/articles/PMC11922894/]
- 25. Optimizing PCR primers targeting the bacterial 16S ... [https://pmc.ncbi.nlm.nih.gov/articles/PMC6162885/]
- 26. Unveiling the impact of 16S rRNA gene intergenomic ... [https://pmc.ncbi.nlm.nih.gov/articles/PMC12081361/]
- 27. How to Design Primers for DNA Sequencing | Practical Lab ... [https://www.cd-genomics.com/resource-how-to-design-primers-for-dna-sequencing.html]
- 28. PCR primer design [https://www.qiagen.com/us/knowledge-and-support/knowledge-hub/bench-guide/pcr/introduction/pcr-primer-design]
- 29. The effect of taxonomic classification by full-length 16S ... [https://www.nature.com/articles/s41598-020-80826-9]
- 30. Full-Length 16S rRNA Sequencing Enhances Species ... [https://www.cd-genomics.com/resource-full-length-16s-rrna-sequencing-enhances-species-level-microbial-analysis.html]
- 31. 16S rRNA gene primer choice impacts off-target ... [https://www.nature.com/articles/s41598-023-39575-8]
- 32. Evaluation of Full-Length Versus V4-Region 16S rRNA ... [https://pmc.ncbi.nlm.nih.gov/articles/PMC9338901/]
- 33. Comparison of DNA extraction methods for 16S rRNA gene ... [https://www.nature.com/articles/s41598-023-33959-6]
- 34. Rapid sequencing DNA - 16 Barcoding Kit 24 V14 (SQK- S 114.24) 16 S [https://nanoporetech.com/document/rapid-sequencing-DNA-16s-barcoding-kit-v14-sqk-16114-24]
- 35. The Human Microbiome and Understanding the 16S rRNA ... [https://pmc.ncbi.nlm.nih.gov/articles/PMC5535273/]
- 36. Nanopore full length 16S rRNA gene sequencing ... [https://pubmed.ncbi.nlm.nih.gov/40691262/]
- 37. Full-length 16S rRNA Sequencing Reveals Gut ... [https://pmc.ncbi.nlm.nih.gov/articles/PMC11912586/]
- 38. Next Generation Sequencing Improves Diagnostic 16S ... [https://pmc.ncbi.nlm.nih.gov/articles/PMC12418051/]
- 39. quantifying and counteracting bias in 16S rRNA studies | BMC ... [https://bmcmicrobiol.biomedcentral.com/articles/10.1186/s12866-015-0351-6]
- 40. Optimizing PCR primers targeting the bacterial 16S ribosomal ... [https://bmcbioinformatics.biomedcentral.com/articles/10.1186/s12859-018-2360-6]
- 41. Influence of PCR cycle number on 16S rRNA gene ... [https://pmc.ncbi.nlm.nih.gov/articles/PMC7454008/]
- 42. Optimization of 16S rRNA gene analysis for use in ... [https://www.sciencedirect.com/science/article/pii/S0167701219310978]
- 43. Evaluating Bias of Illumina-Based Bacterial 16S rRNA ... [https://pmc.ncbi.nlm.nih.gov/articles/PMC4178620/]
- 44. Microbiome Informatics: OTU vs. ASV [https://www.zymoresearch.com/blogs/blog/microbiome-informatics-otu-vs-asv?srsltid=AfmBOoqcTqF12BgiHxfaojbziWdS-yh7jFS-vX66LITY8QOJ9ULheLp_]
- 45. Method comparison - differences in observed richness [https://forum.qiime2.org/t/method-comparison-differences-in-observed-richness/8788]
- 46. Comparing bioinformatic pipelines for microbial 16S rRNA ... [https://journals.plos.org/plosone/article?id=10.1371/journal.pone.0227434]
- 47. Comparing DADA2 and OTU clustering approaches in ... [https://pmc.ncbi.nlm.nih.gov/articles/PMC7717693/]
- 48. Comparison of commonly used software pipelines for ... - PMC [https://pmc.ncbi.nlm.nih.gov/articles/PMC11566164/]
- 49. Comparison of Bioinformatics Pipelines and Operating ... [https://www.frontiersin.org/journals/microbiology/articles/10.3389/fmicb.2020.01262/full]
- 50. A comparison of sequencing platforms and bioinformatics ... [https://pmc.ncbi.nlm.nih.gov/articles/PMC5598039/]
- 51. To compare the performance of prokaryotic taxonomy ... [https://www.sciencedirect.com/science/article/pii/S0010482522002086]
- 52. SILVA: Silva [https://www.arb-silva.de/]
- 53. MIMt: a curated 16S rRNA reference database with less ... [https://environmentalmicrobiome.biomedcentral.com/articles/10.1186/s40793-024-00634-w]
- 54. Optimization of 16S RNA Sequencing and Evaluation ... [https://pmc.ncbi.nlm.nih.gov/articles/PMC12428380/]
- 55. Comparative analysis of illumina and oxford nanopore ... [https://www.nature.com/articles/s41598-025-18768-3]
- 56. How 16S rRNA Can Be Used For Identification of Bacteria [https://www.cosmosid.com/blog/how-16s-rrna-can-be-used-for-identification-of-bacteria/]
- 57. Benchmarking of 16S rRNA gene databases using known ... [https://pmc.ncbi.nlm.nih.gov/articles/PMC8131573/]
- 58. Bioinformatic strategies to address limitations of 16rRNA ... [https://www.sciencedirect.com/science/article/abs/pii/S0167701219307845]
- 59. Full-length 16S rRNA gene amplicon analysis of human gut ... [https://bmcmicrobiol.biomedcentral.com/articles/10.1186/s12866-021-02094-5]
- 60. Benchmark of 16S rRNA gene amplicon sequencing using ... [https://bmcgenomics.biomedcentral.com/articles/10.1186/s12864-021-07746-4]
- 61. Strengths and Limitations of 16S rRNA Gene Amplicon ... [https://journals.plos.org/plosone/article?id=10.1371/journal.pone.0093827]
- 62. The unresolved struggle of 16S rRNA amplicon sequencing [https://environmentalmicrobiome.biomedcentral.com/articles/10.1186/s40793-025-00705-6]
- 63. Use of 16S rRNA Gene for Identification of a Broad Range of ... [https://journals.plos.org/plosone/article?id=10.1371/journal.pone.0117617]
- 64. The clinical utility of Nanopore 16S rRNA gene sequencing ... [https://pmc.ncbi.nlm.nih.gov/articles/PMC10803466/]
- 65. Targeted next-generation sequencing of the 16S-23S ... [https://www.nature.com/articles/s41598-017-03458-6]
- 66. Four therapeutic frontiers opened up by strain-level ... [https://www.ddw-online.com/four-therapeutic-frontiers-opened-up-by-strain-level-microbiome-sequencing-37596-202510/]
- 67. Comparative analysis of full-length 16s ribosomal RNA ... [https://pmc.ncbi.nlm.nih.gov/articles/PMC10411958/]
- 68. Comparative evaluation of sequencing platforms [https://pmc.ncbi.nlm.nih.gov/articles/PMC12365774/]
- 69. Performance of Nanopore and Illumina Metagenomic ... [https://pubmed.ncbi.nlm.nih.gov/36299531/]
- 70. Benchmarking second and third-generation sequencing ... [https://www.nature.com/articles/s41597-022-01762-z]